International Journal of Innovative Technology and Exploring Engineering (IJITEE) ISSN: 2278-3075,Volume-8 Issue-11, September 2019
Abstract: At present, triclustering is the well known data mining technique for analysis of 3D gene expression data (GST). Triclustering is a simultaneously clustering of subset of Gene (G), subset of Sample (S), and over a subset of Time point (T). Triclustering approach identifies a coherent pattern in the 3D gene expression data using Mean Correlation Value (MCV). In this chapter, Hybrid PSO based algorithm is developed for triclustering of 3D gene expression data. This algorithm can effectively find the coherent pattern with high volume of a tricluster. The experimental study is conducted on yeast cycle dataset to study the biological significance of the coherent tricluster using gene ontology tool.
Keywords: Gene Ontology, Hybrid Particle Swarm Optimization (Hybrid PSO), Gene Expression Data, Triclustering, Yeast Cell Cycle data.
I. INTRODUCTION
T
he 3D time series gene expression data analysis, plays a vital role in identify the most valuable genes along the Gene-Sample-Time (GST) or Gene-Condition-Time (GCT) dimension (Ziv Bar-Joseph, 2002). The analysis of microarray of 3D data represents a computational challenge due to the characteristic of these data. A large number of clustering approaches are proposed for the analysis of gene expression by many literatures. Triclustering techniques are the most recent simultaneous clustering of the 3D microarray data. Tricluster is a subset of genes that have similar patterns over a subset of condition during subset of time points. Triclustering is treated as one of the optimization problems. Its main objective is to find the quality tricluster with low mean squared residue and high volume. So Partcile Swarm Optimzation (PSO) is perfectly suitable for solving this problem.PSO is the optimization approach and it is population based algorithm. The whole populations are maintained throughout the procedure. The potential solution of PSO is said to be particles and every one of the particles is randomized velocity. Each particle is to attain the optimal solution in the solution space. There are two main features there are 1) Convergence Speed and 2) Relative Simplicity these features are suitable for solving the optimization problem. The main aim of this work is to find the quality of a tricluster using Hybrid PSO optimization.This chapter discusses the triclustering of 3D microarray data using Particle Swarm Optimization (Hybrid PSO) to find the
Revised Manuscript Received on September 05, 2019.
N. Narmadha, P.hD Research Scholar, Department of Computer Science,
Periyar University, Salem -636 011, Tamil Nadu, India
E-mail:[email protected]
Dr. R.Rathipriya, Assistant Professor , Department of Computer Science, Periyar University, Salem -636 011, Tamil Nadu, India, E-mail:[email protected]
maximum optimal tricluster with high MCV value and high volume. Finally, the empricial study is conducted on a Yeast cell cycle dataset to validate the effectiveness of the proposed algorithm. The biological and statistical significance of the result is evaluated using Gene Ontology.
The rest of chapter is organized as follows section II describes the literature review for this research work. Section III discusses the methods and materials. Section IV elaborates the proposed work. Results and discussions need for the studies are shown in section V. Section VI concludes this research work with possible future enhancement.
II. LITERATURE REVIEW
This section provides an overview of related works in the field of 3D microarray gene expression data analysis, in particular, the work related to the Particle Swarm Optimization (PSO).
Table- I: List of Existing Evaluation Measure for Clustering and Biclustering
S. No
Author Name Techni que
Description
1 D.W. van der
Merwe, A.P.
Engelbrecht (2004)
Cluster ing
PSO is used to find the centroids for user specified number of clusters
2 Rashmi
Chouhan ,
Anuradha Purohit (2018)
Cluster ing
PSO is used before K means to find the optimal point. This optimal point is taken as a initial cluster for K means to find the final cluster
3 Nuria Gómez
Blas, Octavio
López Tolic
(2016)
Cluster ing
PSO is to find the user specified cluster.
4 Jayshree
Ghorpade-Aher and Vishakha A. Metre (2014)
Cluster ing
Clustering of multidimensional data using PSO to reduce the minimum
5 Nadjet Kamel,
Imane Ouchen,
and Karim
Baali (2014)
Cluster ing
To cluster web document using PSO and K- means
6 R.Rathipriya , K.Thangavel , J.Bagyamani (2011)
Biclust ering
To find quality of bicluster in web usage data
7 R.Rathipriya , K.Thangavel , J.Bagyamani (2011)
Biclust ering
to identify the coherent browsing pattern using K-Means, Greedy Search Procedure and Genetic Algorithm
8 Shyama Das, S.
M.(2010)
Biclust ering
To find global optimal solution
using Particle Swarm
Optimization
9 Deepthi P S
(2015)
Biclust ering
PSO algorithm gives the good quality of cluster with an accuracy of 70-80 %
N. Narmadha, R. Rathipriya
S. No
Author Name Techni que
Description
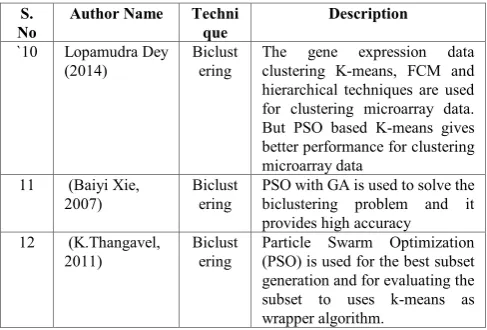
`10 Lopamudra Dey
(2014)
Biclust ering
The gene expression data clustering K-means, FCM and hierarchical techniques are used for clustering microarray data. But PSO based K-means gives better performance for clustering microarray data
11 (Baiyi Xie, 2007)
Biclust ering
PSO with GA is used to solve the biclustering problem and it provides high accuracy 12 (K.Thangavel,
2011)
Biclust ering
Particle Swarm Optimization (PSO) is used for the best subset generation and for evaluating the subset to uses k-means as wrapper algorithm.
This literature study clearly depicts that PSO or Hybrid PSO based approaches mainly used for one and two dimensional clustering of GST i.e. 3D microarray data. Moreover, there are many studies which highlights the benefits of Hybrid PSO over the evolutionary algorithm such as GA for gene based clustering/ biclustering is shown in table 1. Hence therefore, Hybrid PSO based triclustering approach is proposed in this work for 3D gene expression data to extract large volume tricluster with high coherent quality.
III. METHODS AND MATERIALS
This section provides the methods and materials needed for this research work
A. Tricluster
Three dimensional (3D) dataset A with r (genes) is denoted as G, c (columns) is denoted as S and t (time point) is denoted as T; that is Tricluster B = (G,S,T) is the subset of original dataset, where I is the subset of G (I ⊆ G) ,J is subset of S (J ⊆ S) and K is subset of T (K⊆T)
B. GST Microarray data /Triclustering Definition In GST Microarray data / Tricluster is represented by T(g ⊆ G, s ⊆ S, t ⊆ T)
Where
G = {g1,g2,g3…gn} be a set of ‘n’ genes
S = {s1,s2,s3…..sm} be a set of ‘m’ biological samples
T = {t1,t2,t3……tl} be a set of ‘l’ time points
A three dimensional (3D) microarray dataset is a real-valued n*m*l matrix
D = G*S*T whose three dimensions correspond to genes, samples and time points whereas simultaneously clustering of GST is said to be GST Microarray data or Triclustering
C. Encoding of Tricluster
First, two way K-means clustering algorithm is applied along the two dimensions of A(G, S, T) to generate kg and ks cluster and combined these clusters to get kg*ks initial bicluster for every time point ‘t’ in T.
[image:2.595.47.291.49.214.2]g1 g2 ….. gnG-1 gnG s1 s2 ….. snS Fig 1. Encoded Bicluster of length nG+nS
The biclusters generated from the seed generation phase are used to create an initial tricluster population (npop) for Hybrid PSO. First, to select the top 'npop' bicluster based on their Average Correlation Value from the entire set of biclusters. Secondly, to create initial tricluster population, generate random time point of size nb*nT and add these points with the ‘nb’ biclusters. Figure 2 shows single binary-encoded tricluster A(nG+nS+nT) as binary string of length nG+nS+nT.
g1 g2 ….. gnG-1 gn s1 s2 ….. snS t1 t2 …… tnT
8832 9 24
Fig 2. Encoded tricluster of length nG+nS+nT D. Mean Correlation Value for Tricluster
Mean Correlation Value of a Tricluster (MCV) is defined as:
Where = , =
Equation 1 shows the Mean Correlation Value (MCV) of a tricluster. The range of MCV is [0 ,1]. Value close to ‘1’ signifies high correlated tricluster otherwise low or null correlated tricluster. Therefore, MCV based fitness is designed to extract the optimal tricluster from GST gene expression data.
E. Fitness Function
[image:2.595.46.253.548.628.2]The main objective of this work is to discover high volume triclusters with high MCV from GST dataset. The following fitness function F (I, J, K) is used to extract optimal tricluster is shown in equation 2.
where |I|, |J|, |K| are number of rows, columns and the time points of Tricluster and MCV threshold ‘ ’ which range from 0 to 1. In this study, is set as 0.91 to 0.95.
F. Particle Swarm Optimization (PSO)
International Journal of Innovative Technology and Exploring Engineering (IJITEE) ISSN: 2278-3075,Volume-8 Issue-11, September 2019
For each particle to track its coordinates in the problem space and it checks whether they are associated with the best solution (fitness). The steps in PSO each time changing the velocity for accelerating then each particle moves toward its pbest and lbest. Random numbers are generated for acceleration toward pbest and lbest locations. In PSO the fitness is also be stored this value is said to be pbest. Then to find the other best value to track the particle swarm optimizer and check whether any particle is the neighbour of the particle, this location of the particle is said to lbest. In that, the entire particle takes all the population as its topological neighbours and the best value is said to be global best then it is called gbest. When compared to GA, PSO is easy to implement and to adjust the few parameters by researchers. PSO is applied successfully in many areas such as Function Optimization (FO), Artificial Neural Network (ANN), Fuzzy System Control (FSC) and others area like Genetic Algorithm (GA) can be applied.
G. Hybrid PSO (K –Means + PSO) There are two phases in Hybrid PSO. They are:
1. Seed Generation
Algorithm 1 mentions the step by step procedure for the seed generation phase using greedy approach. The output of this algorithm is treated as initial population or particle for Hybrid PSO.
2. Optimal Coherent Tricluster
Algorithm 2 depicts the optimal coherent triclustering approach using Hybrid PSO. Its aim is to extract the high volume coherent tricluster.
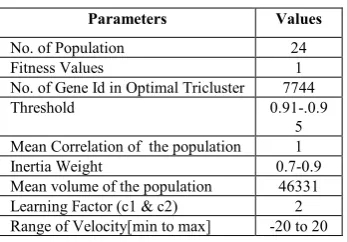
H. Parameters of Hybrid PSO Algorithm
[image:3.595.300.552.44.505.2]The parameter settings needed for this research work is in table 2. It tabulates the number of population, fitness value, number of gene id in optimal tricluster, threshold value, mean correlation of the population, inertia weight, mean volume of the population, learning factors and range of velocity etc.
Table II: The parameter setup of Hybrid PSO algorithm
Parameters Values
No. of Population 24
Fitness Values 1
No. of Gene Id in Optimal Tricluster 7744
Threshold 0.91-.0.9
5 Mean Correlation of the population 1
Inertia Weight 0.7-0.9
Mean volume of the population 46331
Learning Factor (c1 & c2) 2
Range of Velocity[min to max] -20 to 20
IV. PROPOSED WORK
This section elaborates the proposed work and discusses the application of hybrid Hybrid PSO algorithm for triclustering of gene expression data.
Algorithm 1: Seed Formation using Greedy Approach
Input : Initialization of (nG+nS)
Output: Gene Enlargement and Refined tricluster
Step 1: Compute kg gene cluster and ks sample cluster from (nG+nS)
Step 2: Compute kg and ks clusters to form kg * ks biclusters called genes. Step 3: For each gene
i) Call gene Enlargement (gene (G’, S’, T’))
ii) Call gene Refinement (gene (G’, S’, T’)) Step 4: Return the Gene Enlargement and Refined tricluster
Step 5:
// Sub functions of Gene Enlargement and Refined tricluster
Call gene Enlargement (gene (G’, S’, T’))
Step 1: Set of genes ‘g’ not in G’ Step 2: Set of samples ‘s’ not in S’
Step 3: Set of time point ‘t’ not in T’ Step 4: For each node g/s/t
If MCV (union (gene, (g/s/t)))> MCV (gene (G,S,T)) then 1. Add g/s/t to gene (G,S,T)
2. End (if) End (for)
Step 5: Return Enlarged gene set
Call gene Refinement (gene (G’,S’, T’))
Step 1: For each node g/s/t in Enlarged gene
Remove node g/s/t in Enlarged gene
G’’/S’’/T’ be set of rows /columns/timepoint in G’/S’/T’ but not contained g/s/t
If MCV Enlarged gene (G’’,S’’, T’’)> MCV (Enlarged gene (G’/S’/T’))
Update G’/S’/T’ End (if)
End (for)
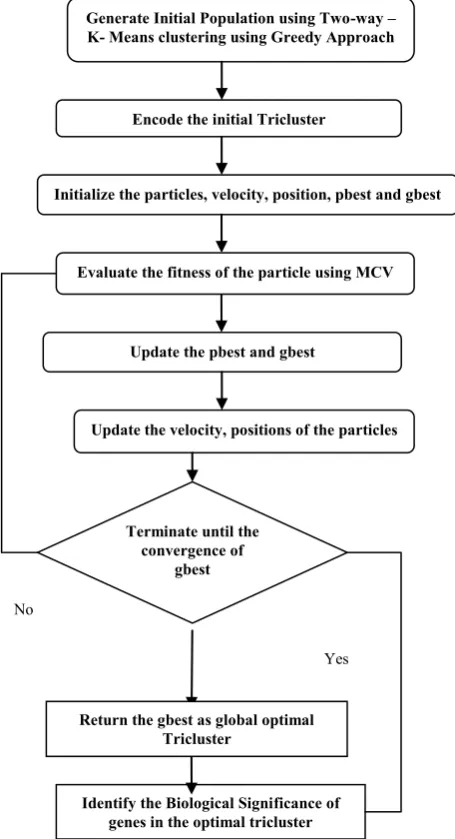
[image:3.595.83.257.586.707.2]Fig 3. An overview of Hybrid PSO based Triclustering Model
Table III: Effect of inertia weight on global volume of tricluster (Gbest) in Hybrid PSO
Particle Size Inertia Weight Gbest volume Gbest MCV
24 0.2 45808 0.9503
0.3 45808 0.9503
0.4 45808 0.9503
The table 3 shows the experimental results of Hybrid PSO Triclustering method with the different inertia weight from 0.2 to 0.4. It has revealed that there is no change in the global volume of optimal tricluster when inertia weight falls between 0.2 and 0.4. The Volume and MCV of this optimal tricluster is 45808 and 0.9503 respectively.
Table IV: Effect of inertia weight on global volume of tricluster (Gbest) in Hybrid PSO
Particle Size Inertia Weight Gbest volume Gbest MCV
24 0.7 46928 0.9515
0.8 46928 0.9515
0.9 46928 0.9515
Similarly, the table 4 shows the experimental results of Hybrid PSO Triclustering method with the different inertia weight from 0.7 to 0.9. It has observed that there is no change in the global volume of optimal tricluster when inertia weight falls between 0.7 and 0.9. The Volume and MCV of this
optimal tricluster is 46928 and 0.9515 respectively. But the volume and MCV of the optimal tricluster are increased significantly. It means that upper range of inertia weight extracts the higher volume of tricluster.
[image:4.595.333.524.179.279.2]From the above tables 3 and 4, it has evidented that lower range inertia weight favors local search whereas upper range inertia weight favors global search. Hence for this reason, higher inertia weight identifies the large volume tricluster with high coherent pattern.
Table V: Characteristics of Optimal Coherent Tricluster
Characteristics gpopulatio n
rpopulatio n
MCV 0.9515 0.900
Volume 46928 21
No.of Gene 8828 50
No.of Sample 7 16
No.of Time point 21 6
Gene Coverage % 99.95 % 74 %
Sample Coverage % 77.78% 93.75%
Time point Coverage % 87.5% 67%
The number of genes, samples and time point in the optimal tricluster are shown in table 5. Similarly gene coverage, sample coverage and time point coverage for the same is calculated using equations 3, 4, 5 is given below and their values are given in this table. Thus, the optimal tricluster for gpopulation covers the 99.95 % of genes from gene set G, 74 % of samples from sample set S and 77.78% of time points from time set T. But, the optimal tricluster for rpopulation covers 74% of genes from gene set G, 93.75 % of samples from sample set S and 67 % of time points from time set T respectively. The study of the biological significance of these genes will be shown in the following sections
Algorithm 2: Optimal Coherent Triclustering (OCT) using Hybrid PSO
Input: 3D Matrix
Output: Highly Correlated tricluster // Initial Tricluster Formation
Step 1: Perform Two-way K-means clustering on Microarray data to create initial tricluster
Step 2: Initialize the velocity and position ‘x’ of each particle Step 3: Set initial position as pbest and maximum of pbest is set as gbest
Step 4: Repeat
For each particle in the population current fitness = fitness (particle)
if current fitness > fitness (pbest (particle)) Update pbest with position of current particle end (if)
end(if) Update gbest
Update velocity using this equation
Update position using this equation
If(rand < s(vi,j)) then xi,j = 1; else xi,j =0 Until stopping criteria is met
Step 5: Return gbest as global best optimal tricluster
Generate Initial Population using Two-way – K- Means clustering using Greedy Approach
Encode the initial Tricluster
Initialize the particles, velocity, position, pbest and gbest
Update the pbest and gbest
Terminate until the convergence of
gbest
Yes No
Identify the Biological Significance of genes in the optimal tricluster Return the gbest as global optimal
Tricluster
Evaluate the fitness of the particle using MCV
International Journal of Innovative Technology and Exploring Engineering (IJITEE) ISSN: 2278-3075,Volume-8 Issue-11, September 2019
V. RESULTS AND DISCUSSION
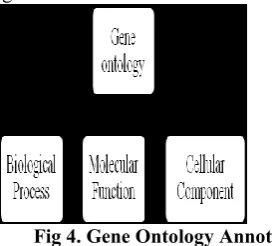
[image:5.595.305.545.116.256.2]This section shows the graphical representation for the Biological Significant of CDC15 Experiment for Yeast Cell Cycle data. Thus the dataset downloaded using the link (http://genome-www.stanford.edu/cellcycle/) it is the yeast cell cycle analysis projects are publicly available for the researchers. An experimental study is conducted with the CDC15 Data with 8832 number of genes, 9 number of samples and the 24 number of time point. There are three gene ontology annotation is processed the gene expression data are shown in figure 4.
Fig 4. Gene Ontology Annotation
The experimental study is conducted to CDC15 dataset is a microarray gene expression data with this link https://www.yeastgenome.org/goTermFinder. Using this link biological process, molecular function and the cellular component are evaluated. The experimental study is tested and conducted on CDC15 experiment using Hybrid PSO algorithm. Table 5 shows the Hybrid PSO Algorithm and the characteristics of optimal tricluster such as threshold value, number of genes, number of samples, number of time points, volume and optimal correlated tricluster value are given in table 6 for different threshold value. Eventhough, threshold value varies from 0.91 to 0.95 the proposed algorithm identifies the same tricluster. This is because, the optimal tricluster of the CDC15 dataset is the only one tricluster with larger volume which satisfies the given tricluster function. The threshold values beyond 0.96 the Hybrid PSO algorithm not able to identify any tricluster.
Table VI: Hybrid PSO algorithm and its parameter for CDC15 Experiment
Threshold No. of No. of No. of Volume Optimal
Correlated Optimal
Tricluster
value Genes Samples Time
Points
Tricluster Value
Optimal Tricluster
1
0.91 419 7 16 46928 0.9515
Optimal Tricluster
2
0.92 419 7 16 46928 0.9515
Optimal Tricluster
3
0.93 419 7 16 46928 0.9515
Optimal Tricluster
4
0.94 419 7 16 46928 0.9515
Optimal Tricluster
5
0.95 419 7 16 46928 0.9515
A. Biological Process
The biological process is evaluated using gene ontology tool. This tool helps to discover the number of similar genes in the list. From the input list, 6126 genes are either identified or unidentified but not clear. Unidentified shows the annotation providers are still included in the statistics. Also, 1026
duplicates were removed from the input list. The total number of genes used to calculate the background distribution of Gene Ontology (GO) terms is 7166. Displaying 341 terms out of a total of 4268 found. Thus the Biological Process networks for CDC15 dataset is shown in figure 5.
Figure 5: Biological Process networks for CDC15 dataset using Gene Ontology
[image:5.595.90.227.184.307.2]The gene ontology tool not only displays the network and similar gene in the list. It also helps to identify the standard name, systematic name, SGD ID, description of the name with the physical interaction and genetic interaction for biological process. Here all this kind of details is shown in table 7.
Table VII: Technical Names and terms for Biological process with their interaction
Standard
Name Systematic Name SGD ID
Name Descripti
on
Physical
Interaction Interaction Genetic
GCN51 YGR252W SGD5000003484
General Control Nonderepr
essible4
Affinity Capture-MS: 377
Dosage Growth Defect: 2 Affinity
Capture -RNA: 6 Lethality: 6 Dosage Affinity
Capture-Western: 87
Dosage Rescue: 15 Biochemical
Activity: 48 Genetic: 265 Negative Co-crystal
Structure: 2
Phenotypic Enhancement:
30 Co-Fractionati
on: 3
Phenotypic Suppression:
21 Co-Localizati
on: 5 Genetic: 61 Positive Co-Purificatio
n: 16
Synthetic Growth Defect: 158 Protein-Peptid
e: 1 Lethality: 115 Synthetic Reconstituted
Complex: 19 Rescue: 40 Synthetic Two-hybrid: 5
[image:5.595.300.562.366.605.2]Fig 6. Graphical Representation for Biological Process The biological significance of an overall experiment for the biological process is in table 8 with the help of gene ontology tool.
B. Molecular Function
From the input list, 6126 genes are either identified or unidentified but not clear. Unidentified genes shows the annotation providers are still included in the statistics. Also, 1026 duplicates were removed from the input list. The total number of genes used to calculate the background distribution of Gene Ontology (GO) terms is 7166. Displaying 80 terms out of a total of 1573 found. When compared to biological process the molecular function identifies more similarity gene. Thus the graphical representation of molecular function networks for CDC15 dataset using gene ontology is depicted in figure 7.
Fig 7. Molecular Function networks for CDC15 dataset using Gene Ontology
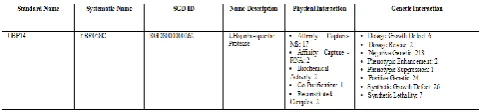
[image:6.595.45.293.50.182.2]The technical names and the terms used for the molecular function with their interactions are described in table 9.
[image:6.595.45.292.413.555.2]Table IX : Technical Names and terms for Molecular Function with their interaction
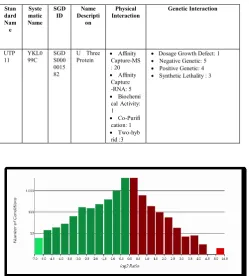
Fig 8. Graphical Representation for Molecular Function
The graphical representations of the molecular function are represented in figure 8. The overall experiment for biological significance for the molecular function is given in table 10. Thus the table shows the gene ontology term with their cluster frequency, their genome frequency with the corrected P-value.
C. Cellular Component
From the input list, 6126 genes are either identified or unidentified but not clear. Unidentified genes shows the annotation providers are still included in the statistics. Also, 1026 duplicates were removed from the input list. The total number of genes used to calculate the background distribution of Gene Ontology (GO) terms is 7166. Displaying 101 terms out of a total of 958 found.
Fig 9. Cellular Component networks for CDC15 dataset using Gene Ontology
[image:6.595.305.549.421.570.2] [image:6.595.48.288.662.718.2]International Journal of Innovative Technology and Exploring Engineering (IJITEE) ISSN: 2278-3075,Volume-8 Issue-11, September 2019
Table XI: Technical Names and terms for Cellular Component with their Interaction
Fig 10. Graphical Representation for Biological Process The graphical representations for the biological process are shown in figure 10. Thus the biological significance of the overall experiment for the cellular component is described in table 12.
VI. CONCLUSION
In this paper, a novel triclustering algorithm based using Hybrid PSO has proposed to extract the high quality of tricluster. The study has carried out with different inertia weight of the particles in Hybrid PSO for identification of optimal tricluster. It has observed that higher inertia weight converges to global optima of the particle. The result has shown in the work clearly pin point the performance of the proposed work in extracting the high volume tricluster with high MCV. The optimal tricluster holds the higher level of coherent pattern among the genes.
ACKNOWLEDGMENT
The first author gratefully acknowledges financial support from UGC- NFSC (Formerly Rajiv Gandhi) Scheme and its
award letter- number:
F1–17.1/2017–18/RGNF–2017–18–SC–TAM–29799/(SA–I II/Website) and dated : 27.07.2017.
REFERENCES
1. Baiyi Xie, S. C. (2007). Biclustering of Gene Expression Data Using PSO-GA Hybrid. 1st International Conference on Bioinformatics and Biomedical Engineering IEEE Xplore.
2. D.W. van der Merwe, A.P. Engelbrecht, “Data clustering using particle swarm optimization”, The 2003 Congress on Evolutionary Computation, 24 May 2004.
3. Deepthi P S, S. M. (2015). PSO Based Feature Selection for Clustering Gene Expression Data. IEEE.
4. Jayshree Ghorpade-Aher and Vishakha A. Metre,“Clustering Multidimensional Data with PSO based Algorithm”, Third Post Graduate Symposium on Computer Engineering cPGCON2014 Organized by department of Computer Engineering, MCERC Nasik 5. K. Thangavel, J. Bagyamani, R. Rathipriya , “Novel Hybrid PSO-SA
Model for Biclustering of Expression Data”, International Conference on Communication Technology and System Design 2011.
6. Lopamudra Dey, A. M. (2014). Microarray Gene Expression Data Clustering using PSO based K-means Algorithm. International Journal of Computer Science and its Applications.
7. Nadjet Kamel, Imane Ouchen, and Karim Baali “A
Sampling-PSO-K-means Algorithm for Document Clustering”, Genetic and Evolutionary Computing pp 45-54, Advances in Intelligent Systems and Computing , Springer International Publishing Switzerland 2014
8. Nuria Gómez Blas, Octavio López Tolic, “Clustering using Particle Swarm Optimization”, International Journal Information Theories and Applications, Vol. 23, Number 1, (c) 2016
9. R.Rathipriya , Dr. K.Thangavel , J.Bagyamani, “Evolutionary Biclustering of Clickstream Data”, IJCSI International Journal of Computer Science Issues, Vol. 8, Issue 3, No. 1, May 2011
10. R.Rathipriya , K.Thangavel , J.Bagyamani, “ Binary Particle Swarm Optimization based Biclustering of Web usage Data” International Journal of Computer Applications Volume 25– No.2, July 2011 11. Rashmi Chouhan , Anuradha Purohit, “An approach for document
clustering using PSO and K-means algorithm”, 2018 2nd International Conference on Inventive Systems and Control (ICISC), 28 June 2018 12. Shyama Das, S. M. (2010). Greedy Search-Binary PSO Hybrid for
Biclustering GeneExpression Data. International Journal of Computer Applications.
13. Ziv Bar-Joseph, Georg Gerber, David K. Gifford, “A new approach to analyzing gene expression time series data” 2002 ACM ISEN. Stan
dard Nam
e Syste matic Name
SGD ID
Name Descripti
on
Physical Interaction
Genetic Interaction
UTP 11
YKL0 99C
SGD S000 0015 82
U Three
Protein Capture-MSAffinity : 20
Affinity Capture -RNA: 5
Biochemi cal Activity: 1
Co-Purifi cation: 1
Two-hyb
rid :3
Dosage Growth Defect: 1
Negative Genetic: 5
Positive Genetic: 4