Vee diagram is a constructivist approach to teaching and learning, to help students understand the relevant principles and concepts of mathematical problem-solving. This study aimed to investigate the development of students’ conceptual and procedural knowledge after the Vee diagram is introduced as a problem-solving strategy in learning a topic in mathematics. This study used a quasi-experimental research design, which involved 48 lower secondary school students selected through purposive sampling. Data were collected using a set of pre-test and post-test that consists of 5 mathematical problem-solving questions. Data were analysed using Statistical Package for Social Science version 23. Findings of this study showed that the application of Vee diagram as a mathematical problem-solving strategy has significantly developed students’ conceptual and procedural knowledge.
Keywords: Conceptual knowledge, procedural knowledge, problem-solving strategy, Vee diagram
I. INTRODUCTION
Most of the activities involved mathematics in our daily life, particularly the application of mathematical understanding like purchasing items and doing an estimation. People will succeed in their life when they can understand and use mathematics appropriately [1]. Considering the wide application of mathematics in education and real-life, mathematics has become a compulsory subject in education and a basic requirement for science education. Since the 19th century, mathematics provided a significant influence in the area of technology, scientific development, daily life and different professional areas which are essential and relevant for Malaysia in becoming a developed country.
Besides playing an important role in the development of science and technological, mathematics also helps in the mental development, humankind strategic and systemic reasoning skills which are important in problem analysis and solving for adding value to the quality of life. Having such thinking processes helps people to make proper decision to solve problems in their everyday life [2].
Revised Manuscript Received on August 05, 2019.
Chua Ye Ling, HLCE Hope RC Sdn. Bhd., Taman Ponderosa, Johor, Malaysia.
Sharifah Osman*, School of Education, Faculty of Social Sciences and Humanities, Universiti Teknologi Malaysia.
Mohd Fadzil Daud, School of Mechanical Engineering, Faculty of Engineering, Universiti Teknologi Malaysia.
Wan Nazdah Wan Hussin, School of Mechanical Engineering, Faculty of Engineering, Universiti Teknologi Malaysia.
The mastery of mathematical concepts and
problem-solving skills are two crucial skills to be emphasized and embedded in recent mathematics education and curriculum [3]. The mathematics curriculum should be able to support and provide a mathematical understanding of concepts and procedures to all students. The students must develop a deep understanding through the mathematical connections by having a strong basic mathematical concept [1]. Moreover, mathematics is one of the primary subjects in school. Mathematical knowledge is an important part of human knowledge and applicable to almost all aspect of human life. Effective and meaningful learning of mathematics was not merely transferring the mathematical facts from educators to learners, but developing and improving students’ conceptual and procedural knowledge [4].
Unfortunately, many students inclined to understand the mathematics procedures without knowing and understanding the facts behind it. Students usually use their memorized procedures in solving mathematical problems and tend to use it repeatedly in solving new problems without really understanding the concepts underlying behind the procedures [5]. This situation explains the needs of teachers’ role in helping students to have a better understanding of the mathematical concepts. There were limited studies on developing concepts and problem-solving, which leads to an unclear relationship between concept development and problem-solving ability [6]. Most of the studies focused on the procedural skills compared to conceptual understanding which will affect students’ knowledge and achievement in mathematics in the long run [7]. The studies also indicated unclear independent effects for conceptual and procedural knowledge. Proven that both of the knowledge are bidirectional, but there were limited numbers of research on the comparison between alternative orderings of instruction on concepts and procedures [8]. For that, studies about the effectiveness of different approaches in sequencing instruction towards concepts and procedures will be the focus of future research.
Obviously, the above discussion showing that conceptual and procedural knowledge is the key factor to understand mathematics. For that, this study aimed to use Vee diagram as a mathematical problem-solving strategy in developing
students’ conceptual
knowledge and procedural knowledge, particularly math
Application of Vee Diagram as a
Problem-Solving Strategy in Developing
Students’ Conceptual and Procedural
Knowledge
word problems.
II. LITERATUREREVIEW
A. Conceptual and Procedural Knowledge
Conceptual and procedural knowledge is a type of knowledge regardless of types of problem. In mathematics education, conceptual knowledge is ‘comprehension of mathematical concepts, operations and relations’, adopted by the National Research Council which is also known as conceptual understanding of principle knowledge [9]. It can be defined as the direct or indirectly understanding of the principles that govern a domain and the interrelationship between the domain knowledge [10].
. Procedural knowledge is the ability to accomplish a sequence of actions to solve a problem which includes the ability of adaptation of known procedure transfer to word problems [11]. It includes skills, strategies, production and initial actions to solve a given problem. In mathematics education, it refers to processes that use algorithms or possible steps to solve a problem via problem-solving exercise [9].
B. Vee Diagram
A professor of Biology at Cornell University, D.B. Gowin, developed the Vee diagram, a visualization technique, which is also known as Vee heuristic/Gowin Vee to help students understand their research through reinforcing and guiding the students’ thinking skills [12]. Over two decades the Vee diagram has been regarded as a metacognitive tool despite no publication by Gowin since 1980s about Vee diagram. Nevertheless, for a decade, there have few relative research writing about Vee diagram and still attached to the old version of the V. As mentioned by Gowin, a heuristic is something utilized as a guide to take care of an issue or to comprehend a procedure. This instrument has been generally utilized by others in various fields and also as a diagnostic and assessment tool [13].
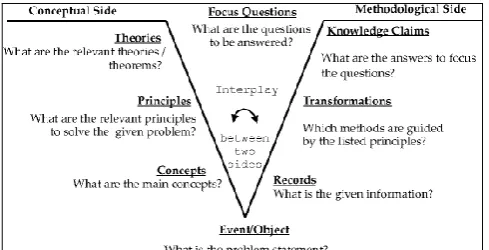
The development of Vee diagram serves as a guiding knowledge of the meaningful relationship between situations or objects by demonstrating what is known and what needs to be known or understood. It consists of two sides. The left-hand side represents the thinking, conceptual aspects which complement the methodological perspective represented by the right-hand side [14]. Gowin’s Vee has been modified and adapted initially to examine secondary mathematics students’ mathematical understanding, and later used for university mathematics students to analyse and solve mathematics problems [15], as shown in Figure 1.
Figure 1: Mathematics Problem-Solving Vee Diagram
III. METHODOLOGY
[image:2.595.304.549.49.174.2]This study used a quasi-experimental design. The participants of this study were selected through purposive sampling. Two pretest-posttest groups were assigned as a control group and an experimental group. The participants were 48 Form 1 students from a secondary school located in Johor Bahru, Johor. Half of the participants were exposed to Vee diagram and assigned to the experimental group. Whereas another half of the participants were taught using conventional teaching method and assigned to the control group, as shown in Table 1.
Table 1: Experimental and Control Groups
Experimental Group Control Group
Number of Students
24 24
Treatment Implementation of Vee diagram Teaching Method Conventional
In the beginning, a pre-test was given to both groups of the student and the results were recorded. Then, students were treated with the two different teaching methods accordingly. And again, students were assessed using a post-test after being exposed to the teaching methods. This study’s analysis was concerned about the significant differences in the marks obtained by the students from both groups after the implementation of Vee diagram in learning a topic in mathematics. Each of the pre and post-test consisted of 5 questions comprising Question 1(a), 1(b), Question 2, Question 3, Question 4 and Question 5(a), 5(b) and 5(c). Participants had to answer all the questions based on their conceptual and procedural knowledge. Participants had to show the solution or methods to solve each question (procedural knowledge) and explain the steps based on the concept behind each step (conceptual knowledge). Marks were given according to the prepared rubric [16]. Each question was given 4 marks for procedural answers and 4 marks for conceptual answers. Full marks for the pre and post-test were 64 which 32 marks for procedural answers and 32 marks for conceptual answers. The total marks were then converted to 100 percent for comparison purpose.
Data were analysed using IBM SPSS version 23. Results for pre-test and post-test were analysed by comparing means and independent-measures T-test to determine the statistically significant differences of
IV. RESULTSANDDISCUSSION
A. Pre-Test Analysis
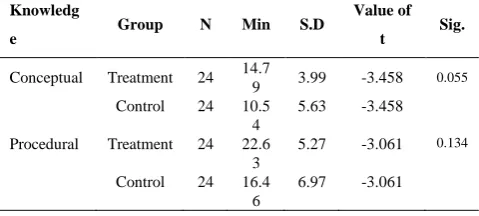
The independent t-test was run to determine any significant difference between the two groups for their conceptual and procedural. The mean and standard deviation of students’ conceptual knowledge for the treatment group were 14.79 and 3.989, respectively. On the other hand, the mean and standard deviation of students’ conceptual knowledge for the control group were 10.54 and 5.634, respectively. The independent t-test result for students’ conceptual knowledge between the control group and treatment group was t = -3.458, with significance value = 0.055 where p ˃ 0.05. Therefore, there is no statistically significant difference in students’ conceptual knowledge between the groups, as shown in table 2. Likewise, the independent t-test result for students’ procedural knowledge between the control group and treatment group was t = -3.061 with significance value = 0.134 where p ˃ 0.05. Whereas the difference in students’ procedural knowledge between the two groups was near-marginal significance, the pre-test results indicated that the students’ conceptual knowledge was close to being statistically different at the beginning of this study. Nevertheless, both conceptual and procedural knowledge of the students from both groups were having no statistically significant difference.
Table 2: Pre-Test Results on Students’ Conceptual and Procedural Knowledge
Knowledg
e Group N Min S.D
Value of
t Sig.
Conceptual Treatment 24 14.7
9 3.99 -3.458 0.055 Control 24 10.5
4
5.63 -3.458
Procedural Treatment 24 22.6 3
5.27 -3.061 0.134
Control 24 16.4 6
6.97 -3.061
B. Post-Test Analysis
The mean and standard deviation for students’ conceptual result in the treatment group were 45.67 and 9.286 respectively, while in the control group, the mean was 13.04, and the standard deviation was 4.268. The results of the post-test indicated that the students’ conceptual knowledge in the treatment group is higher than the control group. In comparison to the pre-test result, the mean for students’ conceptual knowledge in both groups increased but the treatment group showed a significant difference between the pre-test and post-test mean results. The mean difference between pre-test and post-test results of the treatment group was 30.88, whereas the control group was only 2.5. The independent t-test analysis suggested that there was a statistically significant difference between the groups in students’ conceptual knowledge, showing the value of t = -15.639 and significance value = 0.003. Thus, the null hypothesis of this study that there was no difference between the means, was rejected due to the low significance value, which was less than 0.05. Table 3 shows the independent t-test result for students’ conceptual knowledge.
Table 3: Students’ Conceptual Knowledge between Treatment and Control Groups
Conceptual
Knowledge N Min S.D
Value of
t Sig.
Treatment 24 45.67 9.286 - 15.639 0.003
Control 24 13.04 4.268
[image:3.595.49.289.397.505.2]Independent t-test was used to determine the significant difference in students’ procedural knowledge between the treatment group and control group which both groups consisted of 24 participants respectively. The mean of students’ procedural knowledge in the treatment group was 63.54, and the standard deviation was 7.052 while the mean of the control group was 48.88, and the standard deviation was 10.960. The results indicated that the students’ procedural knowledge in control group is lower than the treatment group. The mean of students’ procedural knowledge increased in both groups. The mean difference for the treatment group was 40.91 and for the control group was 32.42. The independent t-test analysis showed a statistically significant difference between groups in students’ procedural knowledge, with the value of t was -5.513 and the significant value was 0.014. Thus, the null hypothesis of this study that there was no difference between the means, was rejected as the significance value was less than 0.05. Table 4 shows the independent t-test result for procedural knowledge.
Table 4: Students’ Procedural Knowledge between Treatment and Control Groups
Procedural
Knowledge N Min S.D Value of t Sig.
Treatment 24 63.54 7.052 - 5.513 0.014
Control 24 48.88 10.960
Students learned angles topic using Vee diagram. Vee diagram consists of two sides: the left side of the Vee diagram was the conceptual side, and right side of Vee diagram was methodology (procedural) side. Students had to show procedure and concept behind each step in the Vee diagram during solving word problems in the classroom. From the results, the mean for students’ conceptual knowledge in the treatment group was significantly higher than the control group which was treated with the conventional teaching method. Rote learning in mathematics always applied in conventional teaching, where students used memorization technique based on the repetition of the mathematical procedure. The traditional mathematics teaching method inclined to produce rote learning and train the human to carry out an exact calculation [17]. Since in the twentieth century, students were required to learn all the accurate computation and precise algorithms, and slowly towards 21st century, the technology able to perform all the calculations and students started to ignore comprehending the nature and meaning of mathematics. The authors also argued that the students might have excellent skills in arithmetic procedures but they do not know the meaning or concept behind each process.
Hence, this study used a mathematical problem-solving strategy to develop students’
conceptual and procedural
knowledge through Vee
mean difference showed significant development in students’ conceptual knowledge after being taught with Vee diagram. Vee diagram has a significant impact on students’ mathematical understanding, and enable them to analyse the topics in mathematics by identifying major concepts, principles, theorems, and formulas [15]. Vee diagram highlights the essential conceptual and methodological knowledge in problem-solving [18]. It was important in explaining and identifying multiple mathematical solutions in problem- solving. The visualisation of Vee diagram mapped out theoretical and procedural information of a problem to connect between knowledge and skills as well as mathematics syllabus outcomes.
As shown in the results, the students’ conceptual knowledge of the treatment group was higher than the control group. It directly affected the students’ procedural knowledge. Once the students had a deep understanding of the topic in term of principles and concepts, they were able to solve problems in more appropriate manners and relate to the concepts of the topic. In this case, Vee diagram able to improve critical thinking and meta-cognitive development. The students do not just memorise the mathematical working steps through repetitive practices, but they were able to think mathematically by using Vee diagram. This is in line with the role of Vee diagram to provide a way to develop students’ meta-cognition, thinking skills, and reasoning skills [15]. The strategy enabled students to think mathematically and to connect their knowledge while solving the problem. Students managed to produce the procedure through identifying the major relevant mathematical concept, principles and formula. Hence, the conceptual side of the Vee diagram might guide the students to develop a solution for the mathematical problem.
In this study, Vee diagram was implemented in the teaching and learning process in the classroom. The “focus question”, “event/objects” and “record” in the Vee diagram assisted students to retrieve the information from the question. The “principle” part in the Vee diagram was to guide the students to develop a solution for the question. In this part, the Vee diagram helped the students move beyond the procedural view to be more conceptual by justifying the queries and answers and related it to the concepts behind the topic.
Furthermore, the Vee diagram was used as a visual display when solving the mathematical problem. This visual display was to guide students to relate their knowledge to the problem. The construction of the Vee diagram had let the students know why they are using the particular mathematical method to solve the problem through the conceptual and procedural sides.
From the results, it revealed that the students’ conceptual knowledge and their procedural knowledge were closely related. This finding supplemented previous studies about different views on the relations between conceptual and procedural knowledge [8-9][19-20]. There are four different theoretical viewpoints on the relations: Concepts-first views; Procedures-first views; Inactivation view and Iterative view [9]. The Concepts-first views propound that children initially acquire conceptual knowledge through explanations and then develop procedural knowledge from it through repeated practice solving problems. Meaning, students’ procedural knowledge can be developed when there are acquisition and attainment of their conceptual knowledge. Nevertheless, the relation between these two different types of knowledge is
still unclear and has been debated for about a decade [19]. A study revealed that conceptual and procedural knowledge had stable bidirectional relations and were not moderated by prior knowledge [19].
V. CONCLUSIONS
This study indicated that students’ conceptual and procedural knowledge has been significantly developed after using a problem-solving strategy, Vee diagram, in teaching and learning mathematics. Findings of this study corroborated and supplemented previous studies on the relations between conceptual and procedural knowledge. Despite having different views on the relations, this study underlined that the conceptual and procedural knowledge are somehow related during the learning process and in the mathematical problem-solving particularly.
ACKNOWLEDGMENT
This work was supported by the Contract Research Grant (R.J130000.7651.4C221).
REFERENCES
1. Faulkenberry, E. E. D. 2003. Secondary mathematics pre-service teachers’ conceptions of rational numbers. Unpublished Doctoral Dissertation, Oklahoma State University, Oklahoma.
2. Phonapichat, P., Wongwanich, S., & Sujiva, S. (2014). An analysis of elementary school students ’ difficulties in mathematical problem-solving. Procedia-Social and Behavioral Sciences, 116(2012), 3169–3174.
3. National Research Council. (2000). How People Learn: Brain, Mind, Experience, and School. Washington, D.C.: National Academies Press. doi:10.17226/9853.
4. Mutai, D. K., Changeiywo, J. M., & Learning, D. (2014). Effects of Gowin ’ s Vee Heuristic Strategy on Secondary School Students ’ Conceptual Understanding and Metacognition in the Topic of Moments in Physics, in Uasin Gishu County, Kenya. Journal of Education and Practice, 5(29), 2222–1735.
5. Yılmaz, G., & Kaçar, A. (2016). On the Teaching Polygons to Primary School 7 th Grade Students Using Vee Diagrams and Mind Maps Çokgen Konusunun Öğretiminde Kullanılan Vee Diyagramı v e Kavram Haritalarının İlköğretim 7 . Sınıf Öğrencilerinin Başarısı, 3(1), 13–24. 6. English, L., & Lesh, R. (2008). Future Directions and Perspectives for
Problem Solving Research and Curriculum Development. QUT Digital Repository, (July), 6–13.
7. Gilmore C, Clayton S, Cragg L, McKeaveney C, Simms V, Johnson S (2018) Understanding arithmetic concepts: The role of domain-specific and domain-general skills. PLoS ONE 13(9): e0201724. https://doi.org/10.1371/journal.pone.0201724
8. Rittle-johnson, B., Schneider, M., & Star, J. R. (2015). Not a One-Way Street : Bidirectional Relations Between Procedural and Conceptual Knowledge of Mathematics.
9. Rittle-johnson, B., & Schneider, M. (2015). Developing Conceptual and Procedural Knowledge of Mathematics. (Roi Cohen Kadosh, Ed.). Oxford University Press.
10. Rittle-johnson, B., & Alibali, M. W. (1999). Conceptual and Procedural Knowledge of Mathematics: Does One Lead to the Other? American Psychological Association, 91(1), 175–189
11. Rittle-johnson, B., & Star, J. R. (2007). Does Comparing Solution Methods Facilitate Conceptual and Procedural Knowledge ? An Experimental Study on Learning to Solve Equations. Journal of Educational Psychology, 99(3), 561–574.
12. Thiessen, R. (1992). The Vee Diagram : A Guide for Problem Solving. Aims Newsletter, pp. 3–6.
13. Jose, C. (2011). Heuristic Diagrams as a Tool to Teach History of Science ´. Springer.
14. Afamasaga-fuata, K. (2009). Secondary Pre-service Teachers ’ Use of Vee Diagrams to Analyse Problems
15. Afamasaga-fuata, K. (2003). Vee Diagrams as a Problem Solving Tool : Promoting Critical Thinking and Synthesis of Concepts and Applications in Mathematics. [online], Available: https://www.aare.edu.au/data/publications/2007/afa07202.pdf 16. Teachey, A. L. (2003). Investigations in Conceptual Understanding of
Polynomial Functions and the Impact of Mathematical Belief Systems on Achievement in an Accelerated Summer Program for Gifted Students. North Carolina State University.
17. Hashemi, N., Abu, M. S., Kashefi, H., & Rahimi, K. (2014). Undergraduate Students’ Difficulties in Conceptual Understanding of Derivation. Procedia - Social and Behavioral Sciences, 143, 358–366. 18. Afamasaga-Fuata’i, K. (2004). An Undergraduate Student’s Understanding of Differential Equations through Concept Maps and Vee Diagrams. First Int. Conference on Concept Mapping, 1(October), 21–30. R
19. Schneider, M., Rittle-Johnson, B., & Star, J. R. (2011). Relations among conceptual knowledge, procedural knowledge, and procedural flexibility in two samples differing in prior knowledge. Developmental Psychology, 47(6), 1525-1538.
20. Haapasalo, L. (2004). The conflict between conceptual and procedural knowledge: Should we need to understand in order to be able to do, or
vice versa? [online], Available:
https://pdfs.semanticscholar.org/5465/9ddf3ce1b9eb1891facce00a672 992df528c.pdf?_ga=2.73352851.1622265419.1564287598-57822485 4.1562745776
AUTHORSPROFILE
CHUA YE LING, M.Ed (Mathematics), Mathematics Teacher, HLCE Hope RC Sdn. Bhd., Taman Ponderosa, Johor, Malaysia.
SHARIFAH OSMAN, Ph.D. (Engineering Education), Senior Lecturer, School of Education, Faculty of Social Sciences and Humanities, Universiti Teknologi Malaysia, Skudai, Johor, Malaysia.
MOHD. FADZIL DAUD, Ph.D. (Engineering Education), Senior Lecturer, School of Mechanical Engineering, Faculty of Engineering, Universiti Teknologi Malaysia, Skudai, Johor, Malaysia.