Int. J. Electrochem. Sci., 8 (2013) 3731 - 3739
International Journal of
ELECTROCHEMICAL
SCIENCE
www.electrochemsci.org
Short Communication
Analysis of the Frequency Response of a Water Electrolysis cell
Kaveh Mazloomi*, Nasri Sulaiman, Siti Anom Ahmad, Nurul Amziah Md. Yunus
Department of Electrical and Electronic Engineering, Faculty of Engineering, University Putra Malaysia.
*
E-mail: [email protected]
Received: 11 October 2012 / Accepted: 25 January 2013 / Published: 1 March 2013
High frequency behavior and characteristics of a water electrolysis cell are evaluated in this work. Each experimental electrolytic bath of this report was configured to differ from other setups in electrodes' sizes, the distance between electrodes and electrolyte molarity. During the tests, the voltage, current and the phase angle has been recorded and the Bode plot of the nominal transfer function of the system was drawn for each experimental case. In every single experiment, the same pattern was observed in both magnitude and phase plots. A simplified equivalent circuit has been introduced as a result, which can justify the observed behavior.
Keywords: Water Electrolysis; Frequency Response; Spectrum; Equivalent Circuit; Bode Plot
1. INTRODUCTION
Electrolytic hydrogen production has been a subject of interest for many researchers over a long time [1, 2]. Moreover, different aspects of water electrolysis have been analyzed regarding to the electrons' movement and behavior during the process [3, 4]. Earliest experiments in this field were carried out by Michel Faraday, who introduced his first and second laws of electrolysis [5, 6]. Faraday's laws of electrolysis can be mathematically addressed by equation 1 as below:
z
F
M
Q
m
(1)Int. J. Electrochem. Sci., Vol. 8, 2013
3732 Moreover, Q is known to be a function of current I and the time t during which the current is passing through a medium.
dt
I
dQ
(2)Equation 2 can be re-written as follows for constant current levels.
t
I
Q
(3)Although most electrolyzers work under steady DC conditions, in some industrial power controlling methods, the practice is to apply pulsating or chopped voltage forms to the cell [7-9]. Therefore, we believe analyzing the frequency response of water electrolysis baths might provide an insight to predict the behavior of such cells in different frequencies.
2. METHODOLOGY
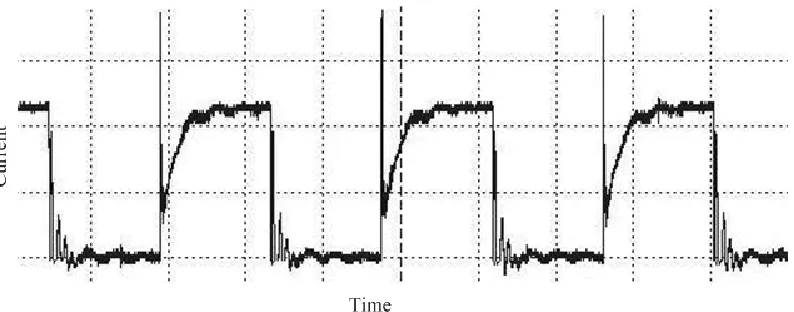
When an electrolysis cell is running under the influence of a steady DC voltage source, its internal resistance of the cell allows a DC current to pass through the electrolyte. However, in some voltage, current or power regulation methods such as Pulse Width Modulation (PWM), the system faces more complex current waveforms such as the one depicted in figure 1.
Figure 1. Sample PWM electrolyzer current waveform
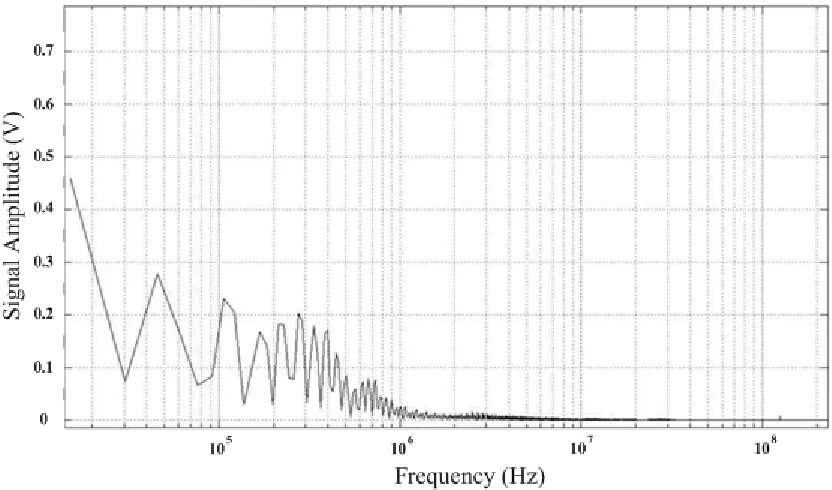
[image:2.596.105.502.455.611.2]
Figure 2. Fast Fourier Transform of the current waveform of figure 1
Similar results can be seen for other asymmetrical or non-steady voltage application methods. Therefore, performing an experimental frequency analysis on an electrolysis cell helps us to have a clearer image of the frequency response of an electrolysis cell and to be able to predict such behaviors in these cases.
For analyzing the frequency response of an electrolysis cell, we need to draw the Bode plot which consists of the magnitude and phase graphs of impedance or conductance. In this experimental work, by applying a DC sinusoidal voltage V (a sinusoidal voltage with a DC offset equal to its peak value) to the cell, the relative passing current I waveform is recorded simultaneously at different frequencies. Since our goal was to draw the conductance (G) Bode plot of the cell, we used the following equations [11].
|
|
|
|
|
|
1
V
I
G
V
G
(4)V
I
G
(5)3. EXPERIMENTAL
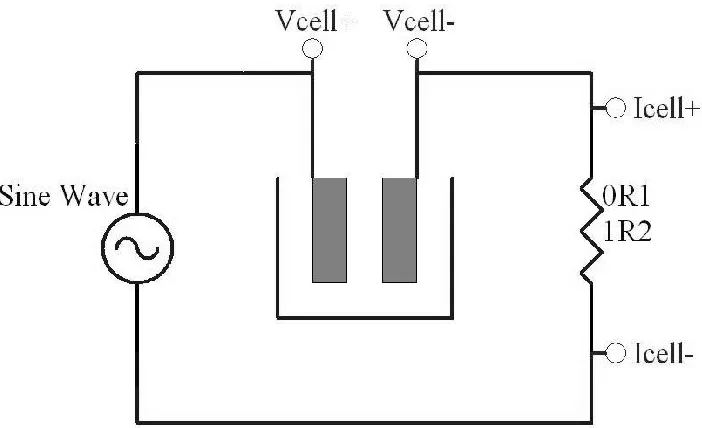
[image:3.596.92.508.77.322.2]Int. J. Electrochem. Sci., Vol. 8, 2013
3734 input sine wave in a frequency range of up to 25 MHz. Cell voltage has been recorded directly from an oscilloscope channel while the other channel was used to read the voltage drop over a series high frequency linear resistor. The utilized series resistance values were either 0.1 Ω or 1.2 Ω for accurate higher and lower current level readings (part numbers: Melf, SMD, T/R, MMA, 0204, 0.25W, 50ppm/°C, 1%, 0R1 and Melf, SMD, T/R, MMA, 0204, 0.25W, 50ppm/°C, 1%, 1R2) [12]. This voltage drop represents the current passing through the cell. According to the technical specifications of the resistors, their resistance value accuracy of the resistors is 99%. Therefore, the same accuracy is assumed for the current value readings.
Figure 3. Electrical schematic of the experimental setup
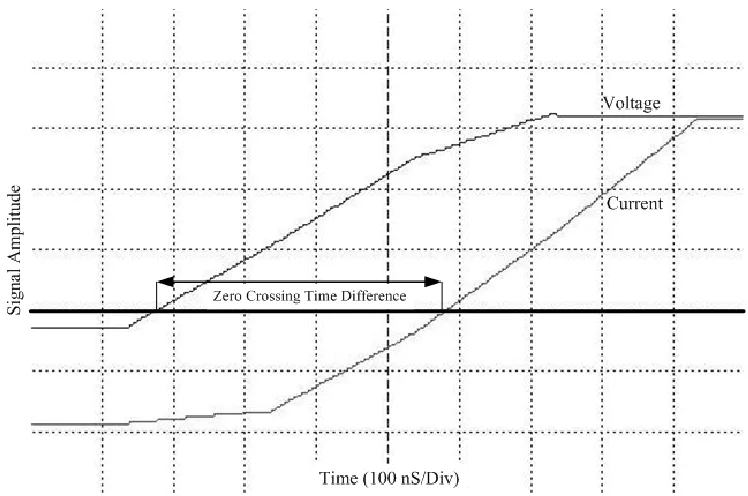
Each experiment was repeated 10 times for a cell setup in order to examine the repeatability and the reliability of the tests. Simultaneous voltage and current waveform display was used to read the precise phase difference based on the magnitude average level crossing time difference between both voltage and current waveforms. A sample recorded waveform pair is illustrated as figure 4. While we were able to read the magnitude of each waveform manually, the peak-to-peak voltages of both waveforms were reported by the oscilloscope. At each frequency f, by knowing the period T and the time difference between the magnitude average level crossings τ, we can calculate the phase difference
between the signals by equation 7.
f
T
1
(6)T
G
[image:4.596.124.475.232.446.2]
Figure 4. Sample voltage and current waveform pair
[image:5.596.107.495.68.324.2]We should mention that since the applied voltage is assumed as the reference for phase angle readings, the phase angle of a lead current waveform (preceding the voltage) is assumed as a positive value and a lag current waveform (proceeding the voltage) as a negative one. Figure 5 illustrates a sample magnitude average level crossings section from the oscilloscope. As it can be seen in this figure, a higher reading resolution was achieved by magnifying the waveforms in the time domain.
[image:5.596.112.486.488.736.2]Int. J. Electrochem. Sci., Vol. 8, 2013
3736 4. RESULTS AND DISCUSSION
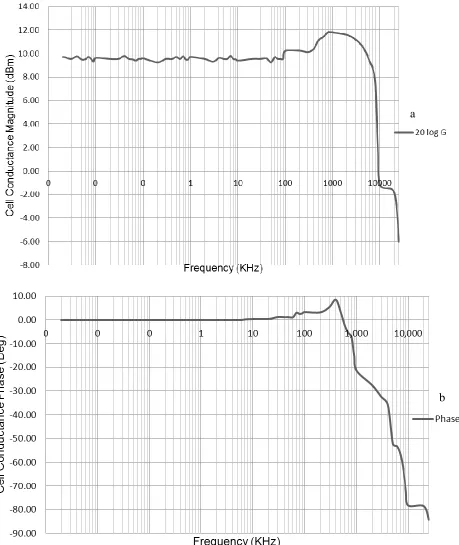
Figure 6. Bode plot. a: Magnitude. b: Phase
After the data recording procedure, the Bode plot was drawn for each case. As an instance, figure 6 shows the results for a case using a pair of
20
40
0
.
5
mm
electrodes placed 100 mm apart in a 0.1 M potassium hydroxide solution. The peak-to-peak amplitude of the applied sine wave was 0a
[image:6.596.73.532.100.645.2][image:7.596.80.520.253.459.2]
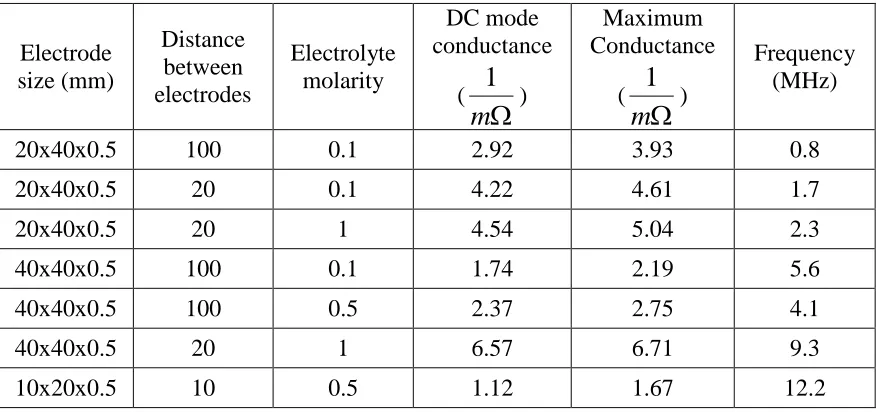
to 10 volts while a maximum current level of 39 mA passed through the cell at 0.8 MHz frequency. As we have repeated the experiment for different cell configurations, we observed the illustrated pattern of figure 6 to be consistent. However, changing the electrodes’ dimensions, the distance between them and the molarity of the solution caused a frequency drift of the maximum conductance point. This point was observed to vary at frequencies between 0.8 MHz and 12.2 MHz. The same spectral behavior was recorded for different experimental cells. As the tests were conducted for different setups, cell conductance at DC voltage, its maximum conductance and the respective frequency were stored. The stored data is used to build Table 1.
Table 1. Conductance for DC and pulsating voltage application for different experimental cell setups
Electrode size (mm) Distance between electrodes Electrolyte molarity DC mode conductance (
m
1
) Maximum Conductance (
m
1
) Frequency (MHz)20x40x0.5 100 0.1 2.92 3.93 0.8
20x40x0.5 20 0.1 4.22 4.61 1.7
20x40x0.5 20 1 4.54 5.04 2.3
40x40x0.5 100 0.1 1.74 2.19 5.6
40x40x0.5 100 0.5 2.37 2.75 4.1
40x40x0.5 20 1 6.57 6.71 9.3
10x20x0.5 10 0.5 1.12 1.67 12.2
Int. J. Electrochem. Sci., Vol. 8, 2013
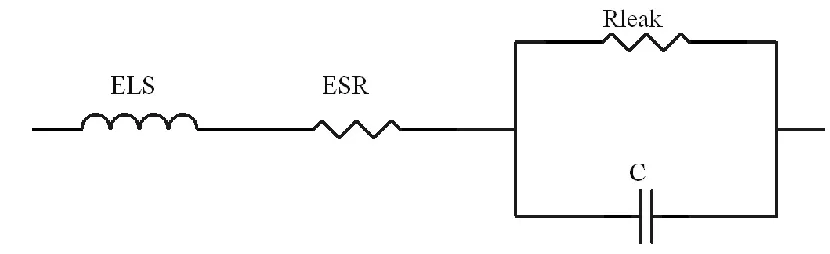
[image:8.596.84.499.184.311.2]3738 Resistance (ESR) and the Equivalent Series Inductance (ESL) are mainly formed by the frequency characteristics of system cabling and external connections of the electrolysis bath [14]. Discussions on the influencing factors of these variables are available where they have been analyzed and introduced earlier [15]. The frequency at which the system shows maximum conductance value can be stated as natural or resonance frequency of the equivalent electrical circuit.
Figure 7. Simplified second order electrical equivalent circuit
5. CONCLUSION
This study provides solid evidence on the frequency response of a water electrolysis cell. As it was shown in the experimental work, a water electrolysis bath shows a nominal second order behavior. The cell reaches its minimum impedance (maximum conductance) at a certain frequency which can be expressed to be the resonance frequency of its electrical equivalent circuit. A second-order RLC equivalent circuit is introduced as a result of this experimental work. The resonance frequency of the experimental cells varied from about 0.8 MHz to around 12.2 MHz as a function of electrodes’ sizes, the distance between electrodes and the molarity of the electrolyte.
References
1. J. W. Richards, J. Franklin. Inst, 160 (1905) 377
2. K. Zeng and D. Zhang, Prog. Energy Combust. Sci, 36 (2010) 307
3. V. Kolivoska, M. Gál, S. Lachmanová, M. Valásek, M. Hromadová and L. Pospísil, Anal. Chim. Acta, 697 (2011) 23
4. K. Mazloomi, N. B. Sulaiman and H. Moayedi, Int. J. Electrochem. Sci, 7 (2012) 3466 5. F. C. Strong, J. Chem. Educ., 38 (1961) 98
6. J. Koryta and L. Kavan, Principles of Electrochemistry. Wiley, Chichester (1993) 7. M. H. Rashid, Power Electronics Handbook. Academic Pr, San Diego (2001) 8. N. Shimizu, S. Hotta, T. Sekiya and O. Oda, J. Appl. Electrochem, 36 (2006) 419
9. A. Ursúa, L. Marroyo, E. Gubía, L. M. Gandía, P. M. Diéguez and P. Sanchis, Int. J. Hydrogen. Energy, 34 (2009) 3221
14. T. H. Glisson, Introduction to Circuit Analysis and Design, Holt, Rinehart and Winston inc, New York (2011)
15. S. Mazloomi and N. Sulaiman, Renew. Sust. Energ. Rev, 16 (2012) 4257