White Rose Research Online URL for this paper:
http://eprints.whiterose.ac.uk/132902/
Version: Published Version
Monograph:
Bojke, Chris, Castelli, Adriana orcid.org/0000-0002-2546-419X, Grasic, Katja et al. (2 more
authors) (2018) Accounting for the quality of NHS output. Discussion Paper. CHE
Research Paper . Centre for Health Economics, University of York , York, UK.
eprints@whiterose.ac.uk https://eprints.whiterose.ac.uk/
Reuse
Items deposited in White Rose Research Online are protected by copyright, with all rights reserved unless indicated otherwise. They may be downloaded and/or printed for private study, or other acts as permitted by national copyright laws. The publisher or other rights holders may allow further reproduction and re-use of the full text version. This is indicated by the licence information on the White Rose Research Online record for the item.
Takedown
If you consider content in White Rose Research Online to be in breach of UK law, please notify us by
CHE Research Paper 153
NHS Output
Accounting for the quality of NHS output
2
Chris Bojke
1
Adriana Castelli
1
K
G
1Anne Mason
3
Andrew Street
1
Centre for Health Economics, University of York, York, UK
2Leeds Institute of Health Sciences, University of Leeds, UK
3
Department of Health Policy, The London School of Economics and Political Science, UK
Background to series
CHE Discussion Papers (DPs) began publication in 1983 as a means of making current
research material more widely available to health economists and other potential users. So
as to speed up the dissemination process, papers were originally published by CHE and
distributed by post to a worldwide readership.
The CHE Research Paper series takes over that function and provides access to current
research output via web-based publication, although hard copy will continue to be available
(but subject to charge).
Acknowledgements
We thank John Bates, Keith Derbyshire, Caroline Lee, James Lewis, Marta Soares and
workshop participants for their assistance. The report is based on independent research
commissioned and funded by the NIHR Policy Research Programme (070/0081 Productivity;
103/0001 ESHCRU). The views expressed in the publication are those of the author(s) and
not necessarily th
NH“
NIH‘
D
H
“
C
length bodies or other government departments. All rights reserved.
No Ethical approval was needed as we use Secondary data.
Further copies
Only the latest electronic copy of our reports should be cited. Copies of this paper are freely
available to download from the CHE website www.york.ac.uk/che/publications/ Access to
downloaded material is provided on the understanding that it is intended for personal use.
Copies of downloaded papers may be distributed to third-parties subject to the proviso that
the CHE publication source is properly acknowledged and that such distribution is not
subject to any payment.
Printed copies are available on request at a charge of £5.00 per copy. Please contact the
CHE Publications Office, email che-pub@york.ac.uk, telephone 01904 321405 for further
details.
Centre for Health Economics
Alcuin College
University of York
York, UK
www.york.ac.uk/che
Abstract
Output measures used in the national accounts aspire to capture as comprehensively and accurately as possible the value that society places on everything produced by the economy. Given that
economies produce heterogeneous products, some means of defining and valuing these is required so that a single aggregate measure of output can be constructed.
For products traded in the market economy this is conceptually quite straightforward, but it requires the assumption that prices reflect marginal social values and equate to the marginal costs of
F
on-sectors such as defence, education and health systems, among others, the above assumption does not hold. People access and use the services provided by these sectors but rarely pay for them at point of use or, if they have to pay something out-of-pocket, it is usually subsidised.
“ -
measure: (1) to substitute information about the price of the output with its cost of production, making the assumption that marginal costs equate to marginal social values and (2) to describe and capture the characteristics of each product, recognising that products with more desirable
characteristics are of greater value. In common parlance, this bundle of characteristics reflects the
A combination of these two general approaches has been adopted to assess the contribution of the English National Health Service (NHS) in the national accounts. Current practice in accounting for the quality of healthcare services makes use of routinely available information in order to capture the QALYs associated with treating patients, by combining information on survival rates, life expectancy and a measure of change in health status before and after treatment. The process of care delivery is captured by measures of treatment waiting times.
Contents
1. Introduction ... 1
2. Accounting for the quality of healthcare output... 3
2.1 Measuring health outcomes: the QALY approach ... 3
2.2 The current approach to quality adjustment ... 5
2.3 An alternative source of QALYs ... 7
3. Review of existing criteria for indicator selection ... 11
3.1 AHRQ criteria used to evaluate potential quality indicators ... 11
3.2 NCHOD Criteria (matrix) for Evaluating the Quality of Indicators ... 12
3.3 HSCIC (Indicator Assurance Service) ... 14
3.4 Expert Workshop ... 16
4. Criteria for quality indicators in output measures ... 18
5. Do published indicators satisfy the criteria? ... 24
5.1 Introduction ... 24
5.2 Published indicators ... 24
NHS Outcomes Framework Indicators ... 24
NHS Thermometer Indicators ... 25
5.3 Results of the review ... 26
NHS Outcomes Framework Indicators ... 26
NHS Thermometer Indicators ... 32
5.4 Which indicators met most criteria? ... 36
6. Conclusions ... 38
References ... 40
1. Introduction
Output measures used in the national accounts aspire to capture as comprehensively and accurately as possible the value that society places on everything produced by the economy. Given that
economies produce heterogeneous products, some means of defining and valuing these is required so that a single aggregate measure of output can be constructed.
For products traded in the market economy (Mkt) this is conceptually quite straightforward, but it requires the assumption that prices reflect marginal social values and equate to the marginal costs of production. If this is accepted, output measurement reduces to a collection of information about the volume and price of each traded product . We can combine these to form the following aggregate measure of output for the sector in question:
(1.1)
To measure growth in output, the volumes of each product are compared across consecutive periods, holding prices constant. We can use either prices from the current or the base period. If using prices from the base period the Laspeyres index (L) of output growth is specified as:
(1.2)
If current prices are used, the Paasche index (P) is specified as:
(1.3)
There is a slight difference in the interpretation between the two indices. In the case of Laspeyres index, the individual can afford the same basket of products in the current period as in the base period. Conversely, with the Paasche index the assumption is that the individual could have afforded the same goods in the previous period as she can now.
While these indices capture well the output in the market economy, there are many things produced by the economy for which consumers do not have to pay the full price. The
-(NMkt) encompasses those sectors which are funded, wholly or partially, through taxation. In most countries these typically include government, and the justice, police, defence, education and health systems, among others [1]. People access and use the services provided by these sectors but rarely pay for these services at point of use or, if they have to pay something out-of-pocket, it is usually subsidised.
This means that the assumption we made about products traded in the market economy - that prices reflect marginal social values and equate to the marginal costs of production does not hold. While it may be possible to collect information about the volume of services provided, information on prices is unavailable. As a consequence, output measurement for non-market sectors is less straightforward than for market sectors.
(1.4)
However, if marginal costs diverge from marginal social values, this index reflects producer rather than consumer valuations of output [2].
The second way requires a means of assessing the value of non-traded products. A common means of doing this is by describing the characteristics of each product, recognising that products with more desirable characteristics are of greater value. The approach requires quantification of the various characteristics of each product and assessing the marginal social value of each characteristic. This makes it possible to construct an alternative output measure, whereby prices are
[3], such that:
(1.5)
In common parlance, this bundl
Hence, construction of this measure requires assessment of the quality characteristics of each product.
A combination of these two general approaches has been adopted to assess the contribution of the English National Health Service (NHS) in the national accounts. In section 2 we describe the current approach used to capture changes in the costs and characteristics of healthcare outputs and the data used to measure these characteristics.
There are concerns, though, that other important characteristics are not captured adequately and that NHS output should account for additional indicators of the quality of healthcare [4]. In section 3 we consider criteria for selecting potentially appropriate characteristics of healthcare outputs. We first describe existing sets of criteria, focusing on those developed by national bodies responsible for assessing healthcare system performance. We also held a workshop to gather the opinions of UK experts on quality and productivity measurement.
In section 4 we set out seven criteria that indicators of the quality of health care services ought to satisfy in order to be considered as candidates for inclusion in a measure of NHS output growth.
2. Accounting for the quality of healthcare output
There is a great deal of variation among health service users in terms of the nature of their contact with the health system and what this contact seeks to achieve. To capture output, it is necessary to define and measure completed treatments and this implies a time-limited unit of measurement. However, this is challenging particularly for patients with chronic conditions whose contact with the heath system is ongoing. Standard practice, therefore, has been to count the number of discrete activities (actions) undertaken by the various organisations that comprise the health sector [5].
Quality adjustment of these activities is difficult mainly because people do not demand healthcare for its own sake, but because of the contribution it makes to their health status. This requires some means of measuring the health outcome associated with treatment. People also value the process by which healthcare is delivered, such as whether they are treated with dignity and respect, and how quickly they can access services. Therefore, a measure of health care output should seek to capture aspects of both process and outcome of healthcare activities.
An obvious way of capturing the impacts of NHS treatment on health outcomes is to measure Quality Adjusted Life Years (QALYs). Therefore, this section first sets out how QALYs could be used in an ideal world, and considers the operational challenges of implementation in the real world
(subsection 2.1). Given the absence of routinely available data on QALYs, the next subsection describes how quality adjustment is currently implemented using available data (2.2). Finally, we discuss a potential source of QALY data and consider its relevance and applicability for an alternative approach to the capturing the quality of NHS output.
2.1 Measuring health outcomes: the QALY approach
Ideally, measures of health outcome should indicate the value added to health as a result of contact with the health system. In the UK, a common metric to describe health outcome is the QALY, which captures information about both the length and quality of life. This can be used to assess the contribution of treatment to health outcomes, and is the metric recommended by the National Institute for Health and Care Excellence (NICE) in health technology assessment [6].
Figure 1: QALY gain
The QALY gain is the health produced by the healthcare system or NHS. If we could observe the health gains from all patients treated by the NHS over time, we could use this information to
measure the performance of the NHS health system, using the total amount of QALYs to capture the total amount of health output produced by the health system.
So, if the without and with treatment number of QALYs is known for all patients receiving treatment of type j we can construct an output growth measure that measures the growth in total QALYs between years t-1 and t aggregated across each activity j for the whole healthcare system:
(2.1)
where is the difference in QALYs without and with treatment (ie the number of QALYs gained) for patient i in year t and is the total number of patients treated in year t.
There are three key challenges with operationalising this approach. First, there is the problem of attribution. Some improvements in health status may be due not to the activities of the health system, but reflect the influence of other types of care (e.g. social care) or of wider social
determinants of health [7]. The challenge is to isolate the specific contribution of health services to health outcome.
Second, the without treatment counterfactual what health status would have been in the absence of intervention is rarely observed. Instead, health status measurement tends to rely on
comparisons of health states before and sometime after intervention. For the purposes of
measuring output growth in the national accounts, before and after measures can supply sufficient information on which to make temporal comparisons [7]. This would be the case if the
counterfactual without-treatment profile can be assumed not to change from one year to the next. If so, before-and-after measures can be used to assess whether the with-treatment health profile changes over time, thus providing enough information with which to judge whether health outcomes have improved.
Third, data are not routinely collected about the health consequences of contact with the health system. This makes it difficult to assess the impact of treatment on their quality of life. This lack of information is the reason why current practice in England has been to try to piece together measures of QALYs indirectly from other information. We describe this practice next.
Quality of Life
Life expectancy [in years] 0.6
2.2 The current approach to quality adjustment
In the absence of comprehensive and routinely collected data on QALYs, the current quality adjustment of NHS output makes use of routinely available information in order to capture the quality of life and extensions to length of life associated with treatments [3]. For patients treated in hospital, the adjustment takes the form:
(2.2)
Given that direct QALY estimates for each type of hospital activity (defined using Healthcare Resource Groups (HRGs)) are unavailable, an equivalent of a QALY profile for patients allocated to each healthcare output is constructed [8]. A survival measure captures the probability of survival following hospital treatment for people in each relevant HRG. We multiply this probability by life expectancy and a measure of change in health status following treatment to arrive at an estimate of the total amount of QALYs experienced by this group of survivors over their remaining lifetime. Those who do not survive hospital treatment are afforded a zero QALY gain.
There is also recognition that the process of care delivery matters. Waiting for treatment yields disutility, and this disutility is expressed in terms of QALYs by valuing days spent waiting in the same metric as the valuation of remaining life expectancy. This allows one to subtract the disutility associated with waiting from the QALY gains associated with treatment in order to arrive at an estimate of net QALY gains for each HRG.
Survival is measured as the 30-day post admission survival rates for each output in each hospital. The change in health status is measured as the ratio of average health status
before and after treatment, such that . In the absence of HRG-specific information,
this ratio is assumed to be 0.8 for electives and 0.4 for non-electives and both remain constant over time [3].
For a handful of conditions, HRG-specific information about before and after treatment health status data is available via the Patient Reported Outcome Measure (PROM), which is a patient level survey asking about health status [9]. This survey is currently administered only to patients having hip replacement, knee replacement, hernia repair and varicose vein removal, representing less than 2% of all hospital patients. For patients having these treatments the change in health status, , is taken from their pre- and post-treatment survey responses.
Life expectancy associated with each HRG is calculated by considering the age and gender profiles (in 5-year bands) of patients allocated to each HRG, based on life tables published by the Office of National Statistics (ONS) [10]. The inverse exponential function reflects decreasing life expectancy over time and is the discount rate applied to future life years.
The way that each type of hospital output is weighted to take account of its quality can be seen as a function of three ratios:
A survival and health effect ratio
A life expectancy ratio
A waiting time ratio
Not all ratios are applied to each type of hospital activity. For example, patients treated as
emergencies (non-elective patients) do not wait for treatment, so the waiting time ratio is assumed to be equal to 1. For outpatient activity, no survival and life expectancy data are available, and thus only the waiting time ratio is applied.
There is a different way of accounting for the quality of primary care [11]. The approach utilises data captured as part of the Quality and Outcomes Framework (QOF), under which GPs are rewarded for achieving a range of diverse targets. If disease management in primary care is improving over time, the supposition is that this will be reflected in reduced blood pressure for an increasing proportion of patients with coronary artery disease (CHD), stroke and hypertension. Hence, primary care consultations are deemed to be 30% more valuable if a blood pressure reading equal or below the target of 150/90 is recorded.
To incorporate these aspects of quality into an output index for primary care, information is required about the prevalence rate for each of these three conditions, the QOF success rate, and the value of a consultation where a successful (below target) blood pressure reading is taken relative to other consultations. So, the volume of primary care consultations is weighted upwards if any feature successful blood pressure management, with the measure of primary care output being formulated as:
(2.3)
Where indexes the three conditions , is the prevalence rate for condition and is the QOF success rate for condition .
Table 1: Quality adjustments for cost-weighted output
Setting NON-ELECTIVE ELECTIVE / DAY CASE
INPATIENT 30-day survival (by HRGs)
Remaining life expectancy (by HRGs)
30-day survival (by HRGs) Remaining life expectancy (by HRGs)
80th percentile of waiting times (by HRGs)
OUTPATIENT 80th percentile of waiting times1
PRIMARY CARE QOF Blood Pressure indicators:
Chronic Heart Disease Stroke
Hypertension
Key: HRG: Healthcare Resource Groups; QOF: quality and outcomes framework. Sources: [12, 13]
2.3 An alternative source of QALYs
Whilst there are no routine national datasets of QALYs for NHS patients, there is an alternative source that should be considered for its potential relevance, namely data from a project that sought to develop methods for estimating the NICE cost-effectiveness threshold [14]. The project aimed to estimate the relationship between changes in overall NHS expenditure and changes in mortality and to translate these estimates into broader effects in terms of QALYs. To support this aim, one of the
objectives of the Q L
Q L In theory, estimates from this project could replace some of the arguments in equation 2.2 above.
There were two key elements to the QALY estimates constructed as part of the project. The first element consists of estimated effects of changes in NHS expenditure on mortality, described in terms of years of life gained (YLG). These gains reflect how changes in health expenditure impact on
population [in a particular expenditure category] lity risks as the general population [14]. The second element adjusts the YLG estimates to reflect how QoL differs by age and gender. There are two forms of QoL adjustment, differing according to the source of the data.
The first form, , uses data from the Health Outcome Data Repository (HODaR) [15] which
EQ-5D2 measures of quality of life by ICD103 code and the age
supplemented with information from the Medical
Expenditure Panel Survey (MEPS) F
quality of life associated with each ICD code at the average age of respondents in the pooled [14]. The data are available online.4
This form of the adjustment can be written:
(2.4)
1 See Dawson 2005, CHE RP6, p96 (section 4.10.5; Table 4.7) 2 EuroQol five dimensions questionnaire https://euroqol.org/
3 International Statistical Classification of Diseases and Related Health Problems 10th Revision
Where indicates the first form of the QALY adjustment, d denotes diagnostic (ICD10) groups and
g 5-year age and gender groups. indicates the years of life gained, by diagnostic and
age/gender band. In this formulation, the estimates of YLG are weighted according to the quality of life HODaR/MEPS survey responses by diagnostic group (but not by age and gender, because the pooled sample was too small).
The second form, , Q L
an analysis of data from the Health Survey E H“E T QALY
written as:
(2.5)
The estimates of YLG are weighted using the HSE health-related quality of life norms for the general population by age and gender (but not by diagnosis).
It may be that the data used to construct these two calculations of QALYs could be used in the quality adjustment measure for calculation productivity growth. We consider the estimation of mortality effects and of quality of life effects in turn.
Mortality effects
We could substitute the estimates for the life expectancy estimates (which also take account of the age/gender composition so, comparably, can be written ).
There are two potential advantages to using estimates. First, as estimates are available by ICD10 codes, these estimates could be applied to match the diagnostic composition of patients within each HRG, to arrive at estimates of . This would allow changes in the diagnostic composition of patients in each HRG to be captured, rather than changes in just the age
composition, as currently.
Second, the
T
disease areas, because comparisons must be based on the QALYs gained as a consequence of treatment, relative to what would have been experienced in the absence of treatment.
Calculation of QALY gains is less critical, though, when measuring changes over time in mortality or life expectancy, as required in measuring output growth, when it is necessary only to assess changes in the with-treatment health profile over time, under the assumption that the counterfactual what happens in the absence of treatment is constant over time for each patient group [3, 7].
Quality of life effects
We could substitute either or for in equation 2.2. Note that none of these arguments include a time dimension, with values not varying over time. This means that the choice of which argument to use boils down to a preference about the quality of the QoL measures.
In our current practice, for only a handful of HRGs are actual QoL data available, these being the four conditions for which Patient Reported Outcome Measures are collected. For all other patients treated in hospital, we assume that the ratio of average health status before and after treatment, amounts to 0.8 for elective patients and 0.4 for non-elective patients and that these ratios remain constant over time. On the face of it, relaxing these assumptions using either or would seem advantageous. But this depends on the quality of the underlying data.
The Health Outcome Data Repository (HODaR) provides over 30,000 observations of EQ-5D
measures of quality of life by ICD code T C
Vale NHS hospital from 2002 to 2004. Inpatients were surveyed 6 weeks post-discharge whilst outpatients are handed a survey package when they at
On the face of it these data could substituted for by applying the estimates to each patient according to their primary diagnosis, and aggregating these to HRGs to derive estimates at HRG level, . In our original work [3] we considered this possibility, and examined the quality of the HODaR data. We found that the data do not constitute before and after measures of health status, with multiple observations only available for a fairly small proportion of patients. Moreover, for those with multiple observations, the time intervals varied considerably and the ICD10 codes often changed from one survey to the next, suggesting that they are receiving treatment for different underlying conditions. We concluded that the data were not fit for purpose because it was not clear what the HODaR data were actually capturing:
We have analysed the HODaR set of observational data to ascertain whether the information can be utilised in the construction of outcome weights for a productivity index. We have concluded that the HODaR data are unsuitable for this purpose. The surveys have not been administered with the express intention of collecting before and after information. Although multiple surveys exist for a subset of patients, it is unlikely that many of these constitute before-and-after measurements. (Page 64, Technical appendices to [3])
For the NICE cost-effectiveness threshold project, the HoDAR/MEPS data were interpreted as providing a measure of QoL associated with the disease under current care arrangements but not as providing a measure of the changes in QoL as a consequence of treatment. The use of in the NHS output measure, therefore, does not seem worth pursuing.
Estimates of are derived from the Health Survey for England (HSE), which is designed to be representative of the English population. These estimates were derived after pooling data from six surveys (1996, 2003-2006 and 2008).
which they are based date from 2008. Moreover, as with HoDAR/MEPS data, the estimates of do not provide a measure of the changes in QoL as a consequence of treatment.
3. Review of existing criteria for indicator selection
In the absence of off-the-shelf and regularly updated measures of the change in QALYs associated with NHS treatment, and having ruled out the NICE cost-effectiveness threshold project as a viable alternative, we then considered whether and how other routine indicators of the quality of care could be incorporated into the measure of NHS output growth. This involved establishing a set of criteria that potential indicators ought to satisfy if they are to be considered for inclusion. We set about establishing these criteria in two stages.
First, we searched for criteria that had been developed by national bodies responsible for collating and publishing measures of patient safety and quality. These criteria are not about the type of quality (i.e. the content of the indicators) but rather relate to the properties of indicators that make them suitable for measuring quality. We undertook a detailed review of three of these criteria sets:
AHRQ 2008 (Agency for Healthcare Research and Quality (US))
NCHOD 2005 (National Centre for Health Outcomes Development)
HSCIC 2014 (Health and Social Care Information Centre)
Second we presented our findings from this review at a workshop attended by UK experts in healthcare quality and/or in the measurement of healthcare output and productivity indices. We asked participants to suggest the criteria that indicators should satisfy if they are to be included in an NHS output index.
3.1 AHRQ criteria used to evaluate potential quality indicators
The Agency for Healthcare Research and Quality (AHRQ) is a US government agency responsible for
A I
-based quality indicators to assess performance, and to identify variations in care quality. AHRQ quality indicators are updated annually and are frequently used in research projects as well as for comparative reporting and performance assessment within the US healthcare system [16]. In 1998, researchers at University of California, San Francisco (UCSF) and the Stanford University
Evidence-B P C EPC AH‘Q
Table 2: AHRQ criteria
Face validity An adequate quality indicator must have sound clinical or empirical rationale for its use. It should measure an important aspect of quality that is subject to provider or healthcare system control.
Precision An adequate quality indicator should have relatively large variation among providers or areas that is not due to random variation or patient characteristics. This criterion measures the impact of chance on apparent provider or community health system performance.
Minimum bias The indicator should not be affected by systematic differences in patient case mix, including disease severity and comorbidity. In cases where such systematic differences exist, an adequate risk-adjustment system should be possible using available data.
Construct validity The indicator should be related to other indicators or measures intended to measure the same or related aspects of quality. For example, improved performance on measures of inpatient care (such as adherence to specific evidence-based treatment guidelines) ought to be associated with reduced patient complication rates. Fosters real
quality improvement
The indicator should be robust to possible provider manipulation of the system. In other words, the indicator should be insulated from perverse incentives for providers to improve their reported performance by avoiding difficult or complex cases, or by other responses that do not improve quality of care.
Application The indicator should have been used in the past or have high potential for working well with other indicators. Sometimes looking at groups of indicators together is likely to provide a more complete picture of quality.
Source: AHRQ. Refinement of the HCUP Quality Indicators, p. 30.
3.2 NCHOD Criteria (matrix) for evaluating the quality of indicators
In 2005, the National Centre for Health Outcomes Development (NCHOD) published a new set of
[18]. Reviewing 18
independent sources on criteria and methods, NCHOD organised the resulting indicators into four groups: scientific criteria; policy criteria; methodological criteria; and statistical criteria. A summary of these criteria is presented in Table3.
T
Development (scientific criteria; policy criteria)
Measurement (methodological criteria)
Interpretation (statistical criteria)
T
T
I
Table 3: NCHOD Criteria
Scientific criteria (SC) Code
Explicit definition Is the indicator explicitly defined by appropriate statistical units of measurement and clinical terminology?
SC1
Indicator validity Will the indicator measure the phenomenon it purports to measure i.e. does it makes sense both logically and clinically?
SC2
Scientific soundness How scientific is the evidence / selection process (systematic / non-systematic) to support the validity of the indicator?
SC3
Policy criteria
Policy-relevance Does the phenomenon under measurement represent significant public interest, disease burden or cost?
P1
Actionability Can the factors which influence the phenomenon be positively influenced to induce a future health / cost benefit?
P2
Perverse incentives Will the measurement process encourage undesired behaviours by those under measurement?
P3
Methodological criteria (M)
Explicit methodology
Are measurement tools / procedures explicitly defined, understood and monitored?
M1
Attributability Are the factors which influence (+/-ve) the phenomenon likely to be identified e.g. patient risk factors, practitioner procedure etc?
M2
Timeliness What is the average time (months) between measurement and results? M3
Frequency What is the average time (months) between reporting of results? M4 Sensitivity to
change
Do the measurement tools and timing of results allow changes to be observed over time?
M5
Confounding What is the risk that variations between organisations and changes over time may be influenced by confounding factors?
M6
Acceptability What % stakeholders accept the process of measurement and the reasons for it?
M7
Measurability Is the measurement process possible within the available budget and resources?
M8
Cost-effectiveness Does the likely output represent a cost-effective use of budget/resources? M9
Statistical criteria (SP)
Specificity Does the measurement appropriately capture the level of detail required e.g. sub-group analyses, accurate diagnosis?
SP1
Comparability Is the measure comparable between relevant sub-groups e.g. are age/sex/geography-specific data standardised and consistent?
SP2
Representativeness Are sample sizes representative across all required sub-groups SP3 Data quality % of the information missing from the records? SP4
Data reliability % agreement (kappa coefficient) between measured records and those collected by an independent source?
SP5
Uncertainty Have appropriate techniques been selected to demonstrate the effects of variation, dispersion and uncertainty (Shewhert, funnel plots etc.)?
SP6
Interpretability Can understandable, meaningful and communicable conclusions be drawn from the results?
SP7
3.3 HSCIC (Indicator Assurance Service)
The Health and Social Care Information Centre5 (HSCIC) is the national provider of information, data and IT systems for health and social care In England. HSCIC has an assurance process for determining the suitability of quality indicators for use in the National Library of Quality Assured Indicators.6 The HSCIC criteria are [19] 7
Clarity: Is it clear what the indicator will measure?
Rationale: What are the reasons and evidence for measuring this?
Data: Is the data in the measure fit (enough) to support the purpose?
Construction: Will the methods used support the stated purpose? Is it clear what methods are used and how they have been tested and justified?
Interpretation: Is the presentation of the indicator suitable and are all potential users able to interpret the values? Can the indicator be used for quality improvements?
Risks: Are any limitations, risks or perverse incentives associated with the indicator explicitly stated?
[image:20.595.46.558.364.738.2]Each of these headline criteria is accompanied by further explanatory statements. These are reproduced in Table 4.
Table 4: HSCIC List of Criteria (2014)
1. Clarity: Is it clear what the indicator will measure?
a) A unique name for the measure which is sufficiently descriptive to convey meaning when referenced or quoted without supporting meta-data and differentiates it from, or specifically associates it with, other indicators.
b) A clear and unambiguous description of the measure, which is expressed both in plain English and the relevant clinical and/or statistical terminology of the particular subject in question, and which is suitable for a diverse audience. c) A clear statement about the measurement units, and reasons why that unit has been chosen as relevant.
d) A clear statement about the scope of the indicator, which will typically include aspects such as detailed patient, population, disease group, geographical and geographical granularity coverage.
e) All other major inclusions and exclusions should be stated in the indicator definition.
2. Rationale: Are the reasons and evidence for measuring this clear?
a) The sponsor for the measure should be clearly stated.
b) A clear statement about the purpose of the measure. c) A clear identified gap or need for the indicator.
d) Justification as to why this is a sufficiently important question/service that requires measurement.
e) A clear statement about the evidence base for the measure such as clinical evidence or professional consensus, and if relevant it should be acceptable to those whose behaviour and practices this may be applied.
f) A clear statement of the policy objective and/or critical business question that the measure is seeking to capture. The rationale must be clearly set out, be plausible, and capable of being understood by a diverse audience including the public.
g) If the indicator fits into a framework, the rationale for the framework as a whole and an outline of how the indicator is included.
h) Previous decision-making documents are included for reference.
3. Data: Is the data in the measure fit to support the purpose?
a) The source of the data is clearly identified with justification, including the extent of any intermediate processing steps which might predispose the data to errors or bias. How data will be extracted or collected is included, with justification if required.
5 The Health and Social Care Information Centre changed name to NHS Digital in April 2016. 6 http://content.digital.nhs.uk/article/5173/Appraisal-end-to-end-process
b) Whether the indicator data source is re-using a collection/extraction or is primarily being collected / extracted for the indicator is discussed.
c) Alternative data sources have been considered with justification as to why they were not used.
d) Data availability is discussed, including the form in which it is available, who has access to the data and evidence that it is available with sufficient frequency and timeliness to enable desired improvement actions to be visible. The
availability of data long-term has been considered.
e) The data used is robust enough to support the measure and its derivations. The quality of the data is above the threshold of acceptability, and this threshold is explicitly defined in the method, and accepted by all stakeholders. The effect of data quality issues upon the measure are explicitly known and declared.
f) An explicit definition of any exclusions from the scope, (which might include specific instances, or be based on calculated or derived rules) along with justification as to why these have been excluded.
4. Construction: Will the methods used support the stated purpose? Is it clear what methods are used and how they have been tested and justified?
a) The measure construction, and/or relevant derivations from it are explicitly defined and justified, to the extent that it is possible to reconstruct the measure and/or derivations using the same base data.
b) The construction of the indicator is fit for purpose and supports the stated rationale.
c) The element of chance has been appropriately considered in the design of the measure, and in any associated derivations or statistical models.
d) Indicator is sensitive to changes in true events.
e) An assessment has been made of the relevance and significance of case-mix, risk, age and sex adjustments in the context of the business question / improvement objective, or any other adjustments relevant to the indicator. An explanation as to what extent these have been carried out and any testing used to inform choice of standardisation method used (if relevant) should be summarised.
f) The use of confidence intervals or control limits has been stated, with the relevant methodology and justification.
5. Presentation and Interpretation: Is the presentation of the indicator suitable and are all potential users able to interpret the values? Can the indicator be used for quality improvements?
a) Consideration of whether any contextual information is required to accurately interpret the indicator. Construction of appropriate contextual information is presented.
b) An explanation is provided as to whether targets or target ranges will be used with supporting evidence of how these are derived. Where targets are not used, how direction of travel should be interpreted by the user is provided. c) The indicator is capable of detecting variability that is important enough to warrant further investigation.
d) Clear statement regarding how the indicator should be used and how it can be used for comparison. Clear explanation of when the indicator cannot be used, with justification.
e) A list of caveats to be presented with the indicator has been included. A thorough investigation into limitations has been carried out and has been addressed as successfully as possible.
f) Any biases resulting from scope, sample size or data collection/extraction factors have been clearly identified.
g) Consideration has been given to the forms of presentation of the indicator for the intended stakeholder audience. These are appropriate and have been tested or verified in some way.
h) Any common industry standard conventions for presentation have been adopted e.g. standard error bars, labelling, scale, limitations, exclusions etc.
i) T learly stated, and
what steps can be taken to improve the measurement. Providers and commissioners are able to improve the results of the measurement
6. Risks: Are any limitations, risks or perverse incentives associated with the indicator explicitly stated?
a) A purpose and description of any similar existing indicators are presented alongside justification as to why an additional indicator is needed. Differences in purpose and construct are clear and appropriate.
b) Methodology is consistent with other existing indicators or indicators within the same set, or justification is provided as to why this is not appropriate.
c) Consideration as to whether results of the measurement would contradict other existing indicators and any resulting impacts of this.
e) T capable of being manipulated in some way to influence the outcome without the intended improvement actions taking place.
f) Issues around disclosure control have been considered.
“ H“CIC C I A “
(2014).
3.4 Expert Workshop
In June 2016, the research team held a one day workshop with key experts in the area of health system productivity measurement including representatives from the Department of Health, the Office for National Statistics, The Health Foundation, the Nuffield Trust, Health Education England and the Care Quality Commission.
The primary objective of the workshop was to seek expert views on the criteria that a quality
indicator ought to satisfy in order to be incorporated in the measure of NHS output and productivity. Workshop participants were tasked to come up with their own list of key criteria that an indicator of quality should have, and to discuss these as a group exercise. Three groups were formed, each attended by a member of the research team. In particular, participants were posed the following question:
W CRITERIA
After this exercise, each group was asked to list the criteria/properties they had identified and to provide a short explanation as to why they were chosen and their relevance. These were related to all workshop participants by a spokesperson for each group and moderated by a member of the research team. Summaries of discussions were taken by each member of the research team
overseeing the three group discussions. The full list of criteria proposed by workshop participants is reported in Box 1.
Box 1 - Criteria suggested by workshop participants
1. Clarity
2. Not ambiguous 3. Uni-directional
4. Appropriately defined area of activity 5. Value to patient / Relevant for the patient 6. Value to clinicians
7. Inform patient safety/improvement
8. Coverage/comprehensiveness at national level 9. Granularity
10. Adjustable for different types of populations 11. Adjustable to specific use and sector
12. Consistency over time 13. Timeliness
14. Ability to capture meaningful change 15. Specificity
The two main take-home messages of the workshop were that all criteria discussed at the workshop should be considered as equally important and that at least one indicator of the quality of
healthcare delivered in each NHS settings (starting from those settings for which no quality
dimension is currently captured) should be included in the measure of NHS output and productivity, provided that it is available and that it satisfies the criteria set. A warning was also provided to be
c
4. Criteria for quality indicators in output measures
Following the workshop, we finalised our set of criteria, drawing together commonalities across the reviewed criteria sets and moderated by the opinion expressed by and discussions held by workshop participants. This generated a set of seven criteria that indicators should satisfy if they are to be included in a measure of output growth.
After reviewing the three published criteria sets and sharing these at the workshop, we derived a set of criteria that measures of patient safety and quality ought to satisfy if they are to be considered for inclusion in a measure of NHS output. Our list of seven criteria is:
Clarity
Added value
Benefit / measure of value
Attribution / granularity
Consistency over time
Measurability / timeliness
Validity
Table 5: List of seven criteria, and cross mapping with existing quality indicator criteria sets
Criterion Wording AHRQ 2008 NCHOD 2005 HSCIC 2014 Workshop criteria
Clarity An indicator should be specific, stating clearly what is being measured, how it is measured and its
interpretation.
SC1 M1 SP1, SP7
1. Clarity
4. Construction (a) 5. Interpretation
Clarity
Appropriately defined area of activity
Not ambiguous Unidirectional
Added value The indicator should capture elements of quality not captured elsewhere.
Construct validity Application
2. Rationale (e, g) 6. Risks (a, c)
Benefit / Measure of value
The indicator should capture aspects of quality proven to be valued by users of health services.
Face validity P1 M7
2. Rationale (a, e, f) Value / relevant to patient Value to clinicians
Inform patient safety/improvement
Attribution / Granularity
The indicator should measure aspects of quality that can be attributed to healthcare settings and that are subject to health system control.
Face validity Fosters real quality improvement
P2
M2, M8, M9
4. Construction (b, c, d) 5. Interpretation (i)
Coverage and
comprehensiveness at national level
Granularity - adjustable to different target
populations, settings and to specific use
Consistency over time
The indicator should measure quality aspects
consistently over time, at least annually, and in a timely manner.
M4, M5, M6 3.Data (d) Consistency over time
Measurability / Timeliness
The quality aspect should be measurable / quantifiable. Precision M3 3.Data (e) Timeliness
Validity The indicator measures what it intends to measure, i.e. it is a discriminates between good and bad quality, is not subject to large variation due to random changes in small numbers of events, and minimises potential bias.
Precision Minimum bias Construct validity
SC2, SC3 P3
SP2, SP3, SP4, SP5, SP6
4. Construction (a reproducibility; (e, f risk adjustment; uncertainty) 5. Interpretation (d, sensitivity; e, caveats) 6. Risks
4.1 Clarity
Clarity
An indicator should be specific, stating clearly what is being measured, how it is measured and its interpretation.
The need for an indicator to be clearly defined is a logical necessity, and two published criteria sets include this property. The HSCIC set focuses on the clarity of what is measured, covering the
and
interpretation (5). The NCHOD matrix requires indicators to have an explicit definition, using appropriate statistical units and clinical terminology (SC1), an explicit methodology (M1), the
appropriate unit of analysis (SP1) and a clear interpretation (SP7). The AHRQ set does not specify the need for clarity.
Workshop participants stressed that indicators should clearly state the purpose for which the indicators are to be used. Further, workshop participants stated that indicators should satisfy specific statistical properties, such as being unidirectional and able to deal with volatility of the data.
4.2. Added value
Added value
The indicator should capture elements of quality not captured elsewhere.
T NCHOD H“CIC
AH‘Q T
together they provide a fuller picture of quality.
T utput measurement than it might be
for construction and reporting of quality indicators for assessing performance. This is because the
characteristics but needs to mi
-possible.
4.3 Benefit / Measure of value
Benefit / Measure of value
The indicator should capture aspects of quality proven to be valued by society.
All three published T H“CIC
rationale should refer to the sponsor (2a), providers (2e) and policy makers (2f). The NCHOD matrix
P M ‘
stakeholders include users (patients), commissioners, providers and policy makers the public
T AH‘Q F
a sound clinical or empirical rationale.
Workshop participants agreed on the importance of this criterion, stressing that indicators should capture aspects of quality that are valued by and relevant to patients (or by clinicians and other patient representatives, in recognition of the agency relationship in healthcare).
Here again, there is divergence between the published criteria and those required for national accounting purposes. The national accounting measure of health output is supposed to capture the social value of what the health service produces. This means that output should reflect the value that society places on the activities of the health system. Hence, the scope of this criterion is perhaps more focused than that expressed in other criteria sets.
4.4 Attribution / granularity
Attribution / granularity
The indicator should measure aspects of quality that can be attributed to healthcare settings and that are subject to health system control.
An indicator is unsuitable as a measure of the quality of health care output if it represents a phenomenon outside the control or influence of the health system. All three criteria sets
AH‘Q F
specifying that an indicator should be subject to provider or healthcare system control. Also in the
AH‘Q F genuine engagement and the need to minimise incentives for gaming behaviours.
I H“CIC
account of chance (4c) and be sensitive to changes in true events (4d). Another relevant HSCIC criterion is the ability of healthcare providers to improve their performance (5i); HSCIC also suggests that there should be some guidance alongside the indicator that specifies the steps that
commissioners and providers need to take.
T NCHOD
the indicator P A
methodological criteria (M2) as are measurability (M8) and cost-effectiveness (M9). These last two concepts underscore the need for provider engagement in designing the indicator, to ensure that the measurement process is feasible and affordable.
settings and for different target populations. For instance, indicators should be capable of disaggregation to different units of analysis, eg national versus Trust level productivity measurement. These sentiments imply the need for a common set of process and outcome indicators, to be collected in relevant healthcare settings.
Also, it was suggested that attribution is much more problematic when considering outcome measures than process measures of the quality of healthcare. This is because health outcomes are often determined by wider social factors and not only (or, often, even primarily) by healthcare utilisation. Ideally the contributions of these wider determinants would be captured in other parts of the national accounts. For example, the beneficial influences on health of improvements in the
housing GDP
In summary, for national accounting purposes, it is important that the output measure captures the valuable characteristics and consequences of healthcare activities, not of other sectors of the economy.
4.5 Consistency over time
Consistency over time
The indicator should measure quality aspects consistently over time.
Usually quality measures are constructed so as to monitor progress over time, and this is more easily accomplished if the indicators are measured in a consistent fashion from one period to the next. Similarly in national accounting, the objective is not merely to measure the level of output at any particular point in time but to measure changes in output over time.
The ARHQ criteria do not explicitly include the need for an indicator to measure quality consistently over time. In contrast, the HSCIC criteria specify the importance of both the frequency and
timeliness of data available to calculate the indicator (3d). The NCHOD matrix differentiates three aspects of timeliness: the reporting frequency (M4), whether the indicator captures longitudinal changes in quality (M5) and whether other time-varying factors can be recognised and adjusted for (M6).
Workshop participants also said it was important that indicators should be measured on a timely and consistent basis.
The requirement for consistency over time is less demanding for national accounting purposes than it is for reporting of quality measures, where consistent definitions are required in order to construct
B
The links in the chain only require that outputs are measured in a consistent fashion across two successive periods. If there are definitional changes, the chain index requires that outputs are measured using both old and new definitions in the period that the change occurs, so that a link to both the past and the future can be constructed.
Timeliness of a quality indicator is also very important for the purposes of NHS output and
4.6 Measurability / Timeliness
Measurability / Timeliness
The quality aspect should be measurable / quantifiable, at least annually, and in a timely manner.
Whilst accepting the adage that what matters and what can be measured are not necessarily the same, any quality indicator has to be based on the measurable. All three criteria sets incorporate this
H“CIC
enough to support the measure T
purposes.
Workshop participants also suggested that indicators of healthcare quality should be comprehensive at the national level and available on a timely basis.
4.7 Validity
Validity
The indicator measures what it intends to measure.
For the purposes of constructing a national measure of healthcare output, the quality measure needs to be valid. More fully, it needs to be able to discriminate between good and bad quality, is not subject to large variation due to random changes in small numbers of events, and minimises potential bias. All three of the published criteria sets reviewed in Section 4 stated that indicators needed to satisfy one or other conceptualisation of validity.
Workshop participants also stressed the importance of both specificity and sensitivity and the ability
If the output measure is to be employed sub-nationally, perhaps to understand and manage
5. Do published indicators satisfy the criteria?
5.1 Introduction
The final objective of this work was to assess the extent to which published indicators of the quality of healthcare satisfy the seven criteria, with the aim of finding indicators for potential use in the NHS output measure. We focussed on the NHS Outcome Framework (OF) indicators and the NHS Safety Thermometer indicators, which are summarised in the section 5.2. A full summary of each of the NHS Outcomes Framework and the NHS Thermometer indicators is provided in Appendix B.
The review of the indicators against the seven criteria was performed as an individual task by members of the research team, and also by two experts, one from the DH and one from ONS.
Each reviewer was provided with an excel spreadsheet set up as a matrix listing all NHS Outcome Framework (OF) indicators / NHS Safety Thermometer indicators against the seven criteria on which to record. Reviewers were asked to indicate whether or not they thought the indicator satisfied each criterion, whether an indicator should be included in the NHS output index and to select an
appropriate NHS setting (Main and secondary) to which they thought the indicator related to. A blank box was also added for reviewers to record any comments they might have.
The excel spreadsheet also contained an instructions sheet and a Criteria & definition sheet. To ease the reviewing process, each reviewer was sent a document including a brief summary of the criteria selection process, a summary of the published criteria set and a summary of the seven criteria identified by the research team. Reviewers were also sent a summary of all NHS OF indicators and NHS Safety Thermometer indicators, providing information about the definition, purpose and data availability for each indicator. Reviewers were asked to complete the exercise as an individual task. Completed spreadsheets were collected and collated, and summary tables produced, these being summarised in section 5.3.
5.2 Published indicators
NHS Outcomes Framework Indicators
The NHS Outcomes Framework (OF) Indicators were developed in December 2010 with the aim of providing national accountability for the outcomes delivered by the NHS. Its objective is threefold: to be a driver of transparency, of improvement in the quality of care and of measurement of the outcomes produced by the NHS. The focus is on improving health and reducing health inequalities. The NHS OF delineates national outcomes goals, which are then used to monitor the progress of the NHS in England. 8
NHS OF indicators are grouped -level national outcomes that the
NH“ .9 Each domain has a number of overarching indicators and a number of improvement areas.
The five domains are:
Domain 1 - Preventing people from dying prematurely
This domain captures how successful the NHS is in reducing the number of avoidable deaths.
Domain 2 - Enhancing quality of life for people with long-term conditions
This domain captures how successfully the NHS is supporting people with long-term conditions to live as normal a life as possible.
Domain 3 - Helping people to recover from episodes of ill health or following injury
This domain captures how people recover from ill health or injury and wherever possible how these can be prevented.
Domain 4 - Ensuring that people have a positive experience of care
This domain looks at the importance of providing a positive experience of care for patients, service users and carers.
Domain 5 - Treating and caring for people in a safe environment and protecting them from avoidable harm
This domain explores patient safety and its importance in terms of quality of care to deliver better health outcomes.
All indicators are calculated separately and where possible by local authority (both lower tier and upper tier), region, age, gender, sexual orientation, ethnicity, religion, deprivation decile and condition.
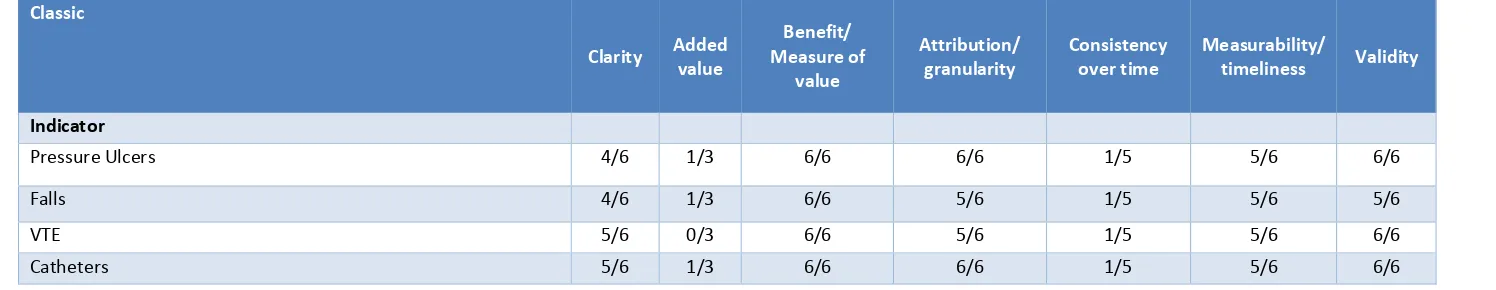
NHS Thermometer Indicators
The NHS Safety Thermometer is the measurement tool for a programme of work to improve patient safety. Indicators were collected and reported by NHS Digital from 2012/13 until April 2017. Since then, the NHS South, Central and West Commissioning Support Unit (SCW) has been managing the collection and publication of NHS Thermometer indicators on behalf of NHS Improvement.
The NHS Thermometer indicators are used to record patient harms at the frontline, and to provide immediate information and analyses for frontline teams to monitor their performance in delivering harm free care, thereby leading to the reduction and, hopefully, elimination of, harm. Patients are assessed in the setting in which they receive care.
The first indicators were introduced in 2012/13 and covered four areas, which were specifically relevant to older people who, experiencing more healthcare intervention, were more at risk of multiple harms. The four areas are:
Pressure ulcers
Falls
Urinary tract infections (UTIs) in patients with a catheter
New venous thromboembolisms (VTEs)
T NH“ thermometer. These four harms
D H Q I P
H F C
experience.
Subsequently patient safety indicators were developed for other areas of health care, namely:
Maternity care10
Medication11
Mental Health services12
C Y P
The box below reports the types of potential harms about which indicators are collected under these four broad areas.
Maternity Care
Maternal Infection
Perineal Trauma
Post-Partum Haemorrhage
Term babies Apgar score
Term baby treatment [no data presented]
W
Medication
Medication Reconciliation (MR)
Allergy status
Medication omission
Omissions of Critical Medication
Identifying harm from high risk medicines
Mental Health services
Self-harm
Psychological safety
Whether a victim of violence or aggression
Omissions of medication
Restraint (inpatients only)
C Y P
Deterioration
Extravasation
Pain
Skin Integrity
Data for all five NHS Safety Thermometer indicators are collected on a single day each month. They enable wards, teams and organisations to understand the burden of harm to patients (the elderly, women and babies, the mentally ill, children and young people) and of medication error. Data can be used as a baseline to direct improvement efforts and then to measure improvement over time.
5.3 Results of the review
NHS Outcomes Framework Indicators
Tables 6 to 15 summarise the results of the reviewing process. For each indicator-criterion
combination, we report the total number of reviewers who answered that the particular indicator satisfies a criterion over the total number of reviewers who have provided an answer. For example,
10 The Maternity Safety Thermometer was first piloted between June 2013 and October 2014 and is now fully released. 11 The Medication Safety Thermometer was designed to identify harm from medication error in line with the Domain 5 of
the NHS Outcomes Framework.
12 The Mental Health Safety Thermometer was tested in a pilot phase from Nov 2012 until May 2013, and a number of
in Table 6 only 2 out of 5 reviewers thought that NH“ OF Life expectancy at 75
Males A
To facilitate the visual identification of indicators that satisfy a certain criterion, indicator-criterion combinations have been colour-coded, with darker blue shades indicating a higher agreement amongst reviewers on whether or not an indicator satisfies a criterion.
NHS OF indicators pertaining to Domain 1 (Table 6) refer to the prevention of premature (avoidable)
deaths. Reviewers thought that these did not usually A ed and that
there were problems with Attribution to the health care system. The former was found to be the
L M
Females and disease specific under 75 mortality rates and excess under 75 mortality rate.
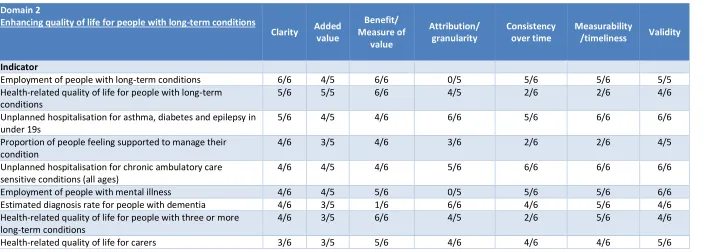
For NHS OF indicators designed to capture the quality of life of individuals with long-term conditions (Domain 2) (Table 7), reviewers agreed that most indicators satisfied all or almost all seven criteria. For five indicator-criterion combinations, a number of exceptions were found as follows: the
indicator E was found not to meet the criterion
B M ; the indicators E - and
E did not satisfy the criterion A ; the indicator
H -related quality of life for people with long- did not satisfy the criteria
C Measurability/timeliness P people feeling
did not meet the criteria C and
Measurability/timeliness H -related quality of life for people with
three or more long- did not satisfy the criterion C .
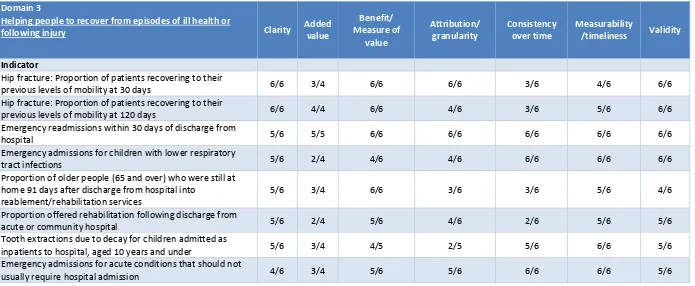
For Domain 3 NHS OF indicators (Table 8), most reviewers agreed that almost all indicators met all seven criteria. However, for four indicators for which issues were raised on either their ability to add value, their Consistency over time, or the possibility to attribute the performance measured to the
T E readmissions within 30 days of
P
from hospital into reablement/rehabilitation services T
children admitted as inpatien
NHS OF indicators designed to assess whether patients, service users and carers have a positive experience of care (Domain 4, Table 9) were also found to be either failing to add value or lacking consistency over time. Note that not all reviewers provided an answer as to whether or not the
A , of those who did, about 50% thought that it did
so.
Scores for the NHS OF indicators relating to the safe treatment and care of patients (Domain 5) are shown in Table 10. Reviewers felt that these indicators met most criteria, though some questioned whether they Added value .
Overall, reviewers found for the NHS OF indicators that if these did not meet a criterion, this was
most likely due to a failure to satisfy e A C
Table 6: NHS OF Domain 1: Review of selected criteria set
Domain 1
Preventing people from dying prematurely
Clarity Added value
Benefit/Measure of value
Attribution/ granularity
Consistency over time
Measurability
/timeliness Validity
Indicator
Potential Years of Life Lost (PYLL) from causes considered amenable to healthcare Adults
6/6 2/4 6/6 4/6 6/6 6/6 6/6
Potential Years of Life Lost (PYLL) from causes considered amenable to healthcare - Children and Young People
6/6 2/4 6/6 4/6 6/6 6/6 6/6
Life expectancy at 75 Males 6/6 2/5 5/6 1/6 6/6 6/6 4/5
Life expectancy at 75 Females 6/6 2/5 5/6 1/6 6/6 6/6 4/5
Neonatal mortality and stillbirths 6/6 1/4 6/6 5/6 6/6 6/6 6/6
Under 75 mortality rate from cardiovascular disease 6/6 2/5 6/6 2/5 5/6 6/6 6/6
Under 75 mortality rate from respiratory disease 6/6 2/5 6/6 3/5 5/6 6/6 6/6
Under 75 mortality rate from liver disease 6/6 2/5 6/6 2/5 5/6 6/6 6/6
Under 75 mortality rate from cancer 6/6 1/4 6/6 2/5 5/6 6/6 6/6
One-year survival from all cancers 6/6 0/5 6/6 6/6 5/6 6/6 6/6
Five-year survival from all cancers 6/6 0/4 6/6 6/6 4/5 6/6 6/6
One-year survival from breast, lung and colorectal cancer 6/6 1/5 6/6 6/6 5/6 6/6 6/6
Five-year survival from breast, lung and colorectal cancer 6/6 1/5 6/6 6/6 4/5 6/6 6/6
Excess under 75 mortality rate in adults with serious mental illness
6/6 1/4 6/6 2/5 5/6 5/6 5/6
Infant mortality 6/6 2/5 6/6 4/5 6/6 6/6 6/6