RIT Scholar Works
Theses
Thesis/Dissertation Collections
2000
Project Iris: Image reconstruction of the iris
spectrally
Joseph Unander
Follow this and additional works at:
http://scholarworks.rit.edu/theses
This Thesis is brought to you for free and open access by the Thesis/Dissertation Collections at RIT Scholar Works. It has been accepted for inclusion in Theses by an authorized administrator of RIT Scholar Works. For more information, please contactritscholarworks@rit.edu.
Recommended Citation
Simg-503
Senior Research
Project Iris: Image Reconstruction
of the Iris Spectrally
Final Report
Joseph W. Unander
Center for Imaging Science
Rochester Institute of Technology
May 2000
Project Iris: Image Reconstruction of the Iris Spectrally
Joseph Unander
Table of Contents
Abstract
Copyright
Acknowledgements
Introduction
Background
Introduction
Anterior Eye
Meet the Iris
Interior Structure of the Iris
Visual Appearance of the Iris
Iris Color
The Individuality of the Iris
Iris Functionality
Background: Applying Project Iris
Introduction
Biometrics
Color Contacts
Color Blindness Research
Theory
Introduction
Background on Multispectral Imaging
Human Problems in a Human World
Methods
Introduction
Equipment
Data Acquisition
Analyzing the Data
Background Accumulation
Raw Data
Data From CropIris.pro
Data From PCA.m
Spectral Reflectance Estimatations
Presence of Optical Abberation Check
Discussion
Conclusion
References
Appendix
List of Web Sites Referenced
Project Iris: Image Reconstruction of the Iris Spectrally
Joseph Unander
Abstract
The basic motivation behind this project is a highly accurate representation of the human iris, to be injected
into a virtual model of the human eyeball. A highly accurate brightness level recording can be easily obtained with
a high quality digital camera. Color, however, is an entirely different matter. Photography in the traditional sense
entertains all sorts of color inaccuracies, mostly related to the chemical process of development. Digital
photography presents gamma and metameric problems, since the exact conditions of the capturing event cannot
easily be duplicated. However, the spectral radiance of an object can be captured, utilizing a spectrophotometer
and reliable light source. In this research, a priori measurements and analysis of the human iris spectral
reflectances are performed. Using a spectroradiometer spectral reflectance samples from human iris are taken and
this sample set is analyzed using principal component analysis to give a number of basis functions to reconstruct
the original reflectance with sufficient accuracy. A color transformation can be built between the signals from a
photometric linear digital camera and the weight coefficients of the eigenvectors. Finally, the spectral reflectance
can be derived from the digital counts of the camera giving us a highly accurate representation of a human iris.
Copyright
Copyright © 2000
Center for Imaging Science
Rochester Institute of Technology
Rochester, NY 14623-5604
This work is copyrighted and may not be reproduced in whole or part without permission of the
Center for Imaging Science at the Rochester Institute of Technology.
This report is accepted in partial fulfillment of the requirements of the course SIMG-503 Senior
Research.
Title: Image Reconstruction of the Iris Spectrally (Project IRIS).
Author: Joseph W. Unander
Project Advisors: Ethan Montag and Francisco Hideki Imai
SIMG 503 Instructor: Joseph P. Hornak
Project Iris: Image Reconstruction of the Iris Spectrally
Joseph Unander
Acknowledgements
For putting up with me, I’d like to thank the following:
Ethan Montag Advisor
Francisco Hideki Imai Advisor
For supplying us access and assistance with Bio-Medical Photography's Facilities:
Bill Fischer
Project Iris: Image Reconstruction of the Iris Spectrally
Joseph Unander
Introduction
The following is a summary of the senior research project I participated in during the Fall, Winter, and Spring quarters of the 1999-2000 school year. This thesis covers the major elements of background, theory, methods, and results of this project. The project itself, as explained in the abstract, involved examining the idea of re-creating a highly accurate image of a human iris using a high level brigthness image combined with spectral radiances obtained from the iris. There, obviously, several problems to be addressed in developing such a method, and these problems are further examined in the theory section. Some of the possible motivations behind such a project are thoroughly illustrated in the background section. The methods section looks at the method that was tested in this project. And the results section covers results that I was able to obtain.
Back to Table of Contents
Background
Background: Introduction
There is a limited resource of information on spectral imaging of the anterior eye, so limited that I have yet to encounter a similar
experience performed elsewhere. Although this provides a fantastic opportunity to uncover potentially fascinating new information, it does place a damper on precisely identifying the background to this experiment. For this section I will dive into some of the current fields of research
involving eye imaging, and demonstrate a potential connection with the future results from my research.
Background: Anterior Eye
First, however, I would like to take a quick look at the anterior eye. The very front of the eye is essentially made up of two parts: the sclera, or “white” of the eye, and cornea. The sclera consists of closely interwoven fibres, and covers over the entire surface of the eye, except for a small section in the back, where the optic nerve leaves the eye, and a small section directly front and center, known as the cornea. The cornea consists of fibres arranged in regular fashion. Conveniently this makes the cornea transparent, allowing light to filter in. Behind the cornea is the anterior chamber, filled with a fluid known as the aqueous humor. This fluid is primarily responsible for carrying oxygen and nutrients to the organs submerged in it, as well as carrying away their waste. Normally, this job would fall under the jurisdiction of blood vessels. However, blood vessels happen to be opaque, and would thus block the transmission of light. A spongy tissue, the ciliary bodies, arranged around the edge of the cornea, constantly produces the aqueous humor. Immersed in the aqueous humor is a ring of muscles commonly referred to as the iris.
Background: Introduction to the Iris
The word iris is most likely derived from the Latin word for rainbow. It appears the term was first applied in the sixteenth century, making reference to this multicolored portion of the eye (1). The iris itself extends out over in front of the lens, forming a circular array, with a variable opening in the center, otherwise known as the pupil (2). Actually, the pupil is not located exactly in the center of the iris, but rather slightly nasally and inferiorly (below the center)(3). The iris, which is made up of two bands of muscles, controls the pupil: the dilator, who contracts to enlarge the pupil, and the sphincter, who contracts to reduce the size of the pupil. A neurotransmitter, acetylcholine, is primarily responsible for initiating sphincter response (2). Norepinephrine has also been identified as a neurotransmitter present in the iris (4). The contractions of these muscles are controlled by responses of vision detection mechanisms on the retina, and are an integral part of the vision system. The pupillary light reflex can than be ascertained to result from stimulus of receptors in the retina (3).
Background: Interior Structure of the Iris
The iris is made of five basic sections: the anterior border layer, the iris stromal layer, the sphincter, the dilator, and the posterior pigment epithelium (1)(5). The anterior border layer lies, as it implies, on the anterior surface of the iris. It is similar to the stromal layer in structure, but more densely packed. The individual pigment cells that make up both the anterior border layer and the iris stroma are called chromataphores. The stromal layer consists of the pigment cells and a collagenous connective tissue that is arranged in arch-like processes. Throughout the iris stroma are radially arranged corkscrew-like blood vessels (1). Both of the iris muscles lie in the iris stroma. The first set of muscles is the sphincter. The sphincter pupillae is a typically smooth muscle, lying directly in front of the neuroectodermal pigment epithelium. The dilator muscles are part of the pigmented myoepithelium, which lies directly in front of the posterior iris epithelium. The myoid elongations of the dilator cells extend in front of the pigmented cell bodies. All of the first three parts, stroma, sphincter, and dilator, and intimately connected both physiologically, and in movement. The final layer of the iris is the posterior iris epithelium, a heavily pigmented layer, containing the pigment melanin (3). The main purpose of this heavy layer is to make the iris “light tight”, or, in other words, impenetrable to light (much like the sclera)(1).
Background: Visual Appearance of the Iris
the other hand, tends to be relatively flat. It will occasionally feature radiating spoke-like processes and a pigment frill where the posterior layer’s heavily pigmented tissue shows at the pupil boundary (1).
Background: Iris Color
The color of the iris, a readily identifiable trait, is the result of a process known as the “scattering-selective absorption combination” (6). The very back of the iris contains a very heavily pigmented epithelial layer (the pigment is melanin), designed to prevent light from entering the eye outside the pupil, light that could potentially cause flare problems in the lens. Although this pigment should ideally absorb all the light, it does not, and some scattering occurs. The color of the iris comes from the amount of pigment in the layers lying in front of this pigmented epithelial layer, due to the effect of these layers on the reflected light. For example, if these anterior layers have little pigment, the iris appears blue in color. This effect arises from Rayleigh scattering from the fine ultra-thin stromal fibers in the anterior layers (much like a similar Rayleigh scattering on a clear sunny day). However, if these layers have a greater amount of pigment, the pigment tends to contribute a yellow component. Combine this yellow component with the scattered blue, and the result is a green coloration to the iris. If the anterior layers have even further levels of pigment, the scattered light is darkened to a brown color. In persons with no pigment, the pinkish iris color emerges from the reddish light reflected from the iris capillaries, combined with the bluish Rayleigh scattering (6). The pigment, melanin, is the same pigment found in skin, and it is often thought that the concentrations in the eye are roughly similar to those in the skin; thus people with darker skin tend to have brown eye, and people with lighter skin tend to have bluish eyes.
Background: The Individuality of the Iris
The iris has been found to be incredibly unique from person to person, in both color and structure. In fact, it has been discovered by both opthalmologists and anatomists, examining large numbers of eyes, that even the left and right eye of and individual exhibit differences in their iris pattern. Also, the patterns appear to vary little after childhood. Developmental biology further suggests that, while the general structure of the iris is genetically determined, the particular aspects of its details are dependent upon circumstance, like the conditions in the embryonic precursor to the iris. Developmental biology also supports the lack of variance through life idea, noting that the iris is most fully developed and grows little have childhood. The only marked exceptions are the pigmentation, which does not fully mature until adolescence, and the size of the pupil, which is also not fully determined until puberty. However, once out of the teenage years, it is likely a persons iris variations will likely remain the same for the rest of their life (thus the enormous interest in utilizing iris variation in a biometric system).
Background: Iris Functionality
The actual physical functionality of the iris is quite remarkable. It is often compared to the diaphragm of a camera, as it shares some characteristics. A typical iris has an f-number around f/2 or f/3, ideal for maximum exposure to light. The iris can change the amount of light coming into the eye in about a fifth of a second, but the reduction amount is miniscule – less than a factor of 20 (about another f-stop). This obviously points out that the iris is not responsible for control light intensity, for this is primarily the job of the rods and cones in the back of the retina. However, much like changing the f-stop on a camera, the iris can seriously reduce aberrations, especially in bright conditions, and increase depth of field. In bright light situations, much one would do on a manual camera, the iris stops down, or decreases in size. This smaller
aperture/pupil allows less light in, and makes it easier to identify incoming images. When focusing in on close objects, such as a book, sewing needle, or watch, the iris stops down to increase depth of field. This is also the case in photography, as the smaller the pinhole letting in the light, the sharper the resulting image. During low light levels, however, the iris serves the opposite purpose. Much like one would do for night
photography, increasing the f-stop to let in more light, the iris opens as much as possible to allow the faintest light to enter the eye. Once the rods have adjusted to current light levels, a small amount of light is all they need to perform basic image detection (7).
Background: Applying Project IRIS: Introduction
Although my task in this research only involved scrutinizing the initial step, the eventual king’s end of the research will be a marriage of the spectral radiance data obtained from the iris with a high resolution lightness to produce a highly colorimetric reproduction of the iris color. The spectral information, once obtained, may also serve other useful purposes. For example, several individual colors of eyes will be imaged, allowing qualitative comparisons between irises of different color. This information can provide examination into the individuality of spectral
characteristics of the eye, which may prove useful in other fields of study.
Background: Applying Project IRIS: Biometrics
Biometrics, the study of using parts of the body as a personal identification system, is rapidly become a large field of research. Biometrics includes using human features such as faces, fingerprints, palms and eyes (8). Iris recognition technology is one of the most favored fields, for a few reasons. It presents a much less intrusive method, as opposed to more invasive methods, such as digital fingerprinting or retinal scans (9). Also, the iris is a very individualistic trait in terms of textual variation, a variation that not only remains unchanged throughout life, but is also different for both the right and left eyes (10). A majority of the modern studies involve identifying the texture of the iris, particularly the small crypts and freckles (11). However, one of the earliest detection systems known, back in the Parisian penal system, used the patterns of color in the iris to identify prisoners. In my research, data will be collected on an individual basis, each data set being from a different person. It may come to light the spectral characteristics of the iris are also highly individualistic. If this is the case, it may be possible to add this feature onto current recognition technology as sort of a back up. Of course, one of the problems that can arise is the ease at which this is done. If spectral imaging of the iris proves tedious and individual traits difficult to distinguish, it may not prove a favorable ally of iris recognition technology. However, if the opposite is true, and the spectral information from a person’s iris is highly variant, then it may be practical to pursue a method of spectral identification.
Background: Applying Project IRIS: Color Contacts
types of color contacts – tinted contacts, and opaque, color contacts. According to the Express Contacts? web site (A.1), tinted contacts are merely just that – tinted, towards a certain color like hazel or brown. When placed over lighter color eyes, tinted lenses can produce fairly noticeable effects, even change the color of the iris. However, for darker eyes, tinted contacts don’t work as well. Instead, the site recommends color contacts, which have an opaque color pattern printed into the lens. This entirely disguises the original eye color, and completely changes the color of the iris. There is a small clear opening in the center for the pupil. Several companies are involved in the selling of color and/or tinted contacts, including CIBA Vision? (A.2), Express Contacts?, Bausch and Lomb (A.3), and CooperVision? (A.4). There has been some deep experimentation into colored contacts, such as “Tinted soft contact lenses: an up-to-date review” (12), “Validation of a method for measuring small color differences in pigmented contact lenses” (13), “Transmittance of tinted and UV-blocking disposable contact lenses” (14), and “Visual field loss with colored hydrogel lenses” (15). In the last article mentioned, the authors found significant (> 10 degrees) of field loss in vision due to opaque colored lenses, somewhat depending on the size of the clear pupil opening. This, of course, highlights one of the main disadvantages of opaque color contacts – while the size of your pupil does change, the size of the opening in the lens does not. The reason one would want these type of lenses, however, stems from either having two dark a natural iris color or wanting a complete color change, not just a hint from a tint. I propose that spectral imaging of the iris may enhance knowledge on the composition of the color of the iris, as it relates to the world around us. In other words, we can take apart the iris and find out what components combine to create this natural marvel, but the resulting color is much more an aspect of reflected light than inner design. Spectral imaging of the iris can probe into this reflected phenomenon, and possibly help contact designers to improve upon old methods. It may be possible to forge a tint that actually modifies the inherent spectral properties of one’s iris, easily transfiguring it’s color to the perception of his fellow man, while not blocking his vision.
Background: Applying Project IRIS: Color Blindness Research
There has a commercial and scientific push to utilize colored contacts to correct color blindess problems. Two companies in specific are marketing these correctional contacts:Ultralease and the ChromaGen System(A.5), and Color Max&Trade (A.6). There has also been qualitative research into the subject: “Influence of X-chrom contact lenses on the chromatic discrimination of subjects with defective color vision” (16), and “ The JLS lens: an aid for patients with color vision problems” (17). The spectral information on the iris may provide valuable insight in the creation of these adaptive contacts, and further aid in the study of the problem at hand.
Back to Table of Contents
Theory
Theory: Introduction
Basically this section will outline why I’m doing what I’m doing. The underlying gist of my research is to examine a method of reproducing human iris color, and identify any major obstructions to accurate reproduction. Of course, the big problem here is how exactly to go about accurately reproducing the color of the iris.
The combination of spectral information with a digital image is necessary, as the anterior eye cannot simply be imaged in the traditional sense, i.e. via photography, whether chemical or digital. Inherent problems arise, either through the chemical properties of film, or the loss of information in digital conversion, that prevent highly precise colorimetric (color) reproduction. Also, changes in illumination between recording and viewing of the images can compromise colorimetric equality, in an effect known as metamarism (18). Metamarism is the effect where two objects may appear the same color under one illumination, but have different spectral properties, thus appearing to be two different colors under a different illumination. To prevent this, and to achieve a proper color match for all observers under different illuminations, a spectral match of original and reproduction must be achieved, which is essentially the main challenge. However, when the imaged object is a human eye, it presents a new, and somewhat more challenging parameter.
Theory: Background on Multispectral Imaging
There has been research into multi-spectral imaging of artwork, extensively documented in two articles: “High-resolution multi-spectral image archives: A Hybrid Approach” (19) and “Multi-spectral-based color reproduction research at the Munsell Color Science Laboratory” (18). However this research principally emphasizes imaging of artwork, which does not breath, does not move, and never gets tired. However, the techniques used in that research may be applicable to spectral imaging of the eye, with a few modifications. This speculation is further considered in the second method of the Experimental Design and Methods section.
Theory: Human Problems in a Human World
One of the key difficulties in this experiment that separates it from many other object imaging techniques, is the use of human subjects.
When one images an object, they have no need to ask them if they want to be imaged, require them to sit still, or have to deal with involuntary actions. With humans, however, this is not only a reality, but a consistency. First off, it will be necessary to construct or obtain some sort of head/chin rest to keep the head still during the imaging process. Secondly, a picture of some sort may come in handy as a point of visual interest, to keep the volunteer’s eyes in one general direction. Unfortunately there is no comfortable or relatively viable way to prevent involuntary eye movements, such as saccades, tremors, and blinking. The best way to prevent compromised data from these movements is to repeat the experiment, and exclude suspect highly varying data. Both the iris and the sclera will be imaged, so I can use that information to my advantage. For example, if I have three sets of data for a location reading on the iris, and I have a suspect value, I can compare the value to the data for the sclera. If that iris data value shares striking similarities to the sclera values, then it is likely the eye moved during this reading, and the sclera was imaged, not the iris. I may also image the eyelid closed, and keep that data as a comparison check for error.
Methods: Introduction
During the course of research, the methods used changed dramatically from what was suggested in the proposal. The following section dives into how the research to date was carried out.
Methods: Equipment
The first piece of equipment essential to our experimentation was the Topcon Slit Lamp SL 7E. Originally we were going to utilize the Zeiss Inc ZVS 1470, but the Topcon provided brighter illumination which was key for decreasing the integration time of the spectrophotometer (which I’ll discuss in a minute). The lamp was oriented at 45 degrees in relation to the optical system, with two optical diffuser papers to give a more uniform illumination.
The following are the specs for the Topcon:
Microscope Type: Galileo magnification changer with converging binocular tubes Magnifications: 6x, 10x, 16x, 25x, 40x
Corresponding FOV’s: 35.1mm, 22.5mm, 14.1mm, 8.8mm,5.6mm Eyepiece: 12.5x
Interpupillary distance adjustment: 55mm to 75mm Interpupillary Diopter adjustment: -5D to 3D Light magnification: 2/3x
Light slit width: continuous from 9mm to 0mm (at 9mm slit become a circle)
Light slit length: continuous from 8mm to 1mm, or aperture settings at 9, 8, 5, 3, 2, 1 and 0.2mm diameter. Light slit angle: 00 to 1800 with horizontal scanning capability
Light slit inclination: 50, 100, 150, and 200 steps Light filters: blue, red-free, 13%ND, and heat-absorbing Lamp: 6V, 20W Halogen lamp
Base longitudinal movement: 90mm Base lateral movement: 100mm Base fine movement: 15mm Base vertical movement: 30mm Chin rest vertical movement: 80mm
Fixation target: Luminous target, 6v, 0.2A bulb Power consumption: 26A
Model Dimensions: 550mm x 370mm Weight: 21kg
Beam Splitter: 50:50
The blue filter was utilized in some of the preliminary measurements to create three additional channels (in addition to the RGB channels under just the halogen). The images were all taken under just the illumination and with no additional assistance from a flash (which would require additional calibration).
The second apparatus tied into this research was the Kodak/Nikon Professional DCS 620 digital camera. This is basically a Kodak imaging system encased in a metal framed Nikon F5 frame body.
The following are the DCS 620 specs:
Imaging system developed by Kodak Metal-frame NIKON F5 Camera body Full image viewfinder WYSIWYG Dual PCMCIA slots, Type II, III Removable NiCD battery (not included) Dual-slot battery charger
Color LCD for image analysis IEEE 1394 high-speed serial interface 12-bit dynamic range
Internal microphone for voice recording Anti-aliasing filter and auto white balance ISO Range: 200 to 1600
Battery life of up to 300 shots or unlimited number with AC adapter Bit depth: 36-bit color (12 bits per color) original capture
Burst rate: 3.5 f/sec, min. 12 frames buffered before PC Card write CCD size: 1728 x 1152 pixels – approximately 2 megapixels
Size: 7.6 in. (194 mm) tall, 6.2 in. (158 mm) wide, 3.4 in. (88 mm) deep Weight: 3.49 lbs. (1.58 kg) without lens
Class B Declaration, VCCI Class 2 Certified 6 MB image files
From the beam splitter was attached two optical tubes, one extending right, the other left. On the one we placed the DCS 620 and on the left we placed the next piece of equipment I’m going to mention, the PR 650.
The third, and final piece of equipment was the Photo Research SpectraScan PR 650 spectrophotometer. The PR 650 specs:
A fast scanning spectroradiometer acquiring light in the range of wavelengths from 380nm to 780nm. Spectral Bandwidth of 5nm.
Spectral Accuracy: +/- 2nm.
Digital Resolution: one part in 4,096 maximum (12-bit A-D converter). Integration time from 13ms to 60s.
Can report a variety of parameters about an imaged object, including: luminance, radiance, color temperature, tristimulus values, chromaticity coordinates, and spectral distribution.
Accounts for dark current of detector through dark measurement.
Has accompanying software for data analysis on IBM or compatible computer.
The PR 650 is designed well, and relatively easy to use. A small black dot appears in the viewing piece, indicating the aperture. Whatever this black dot is placed over will be imaged. The actual recording operation takes place in two parts. First, a light measurement is committed, in which the reflected light from the object is captured. A second reading, called the dark measurement, is then performed with the shutter closed. This measurement extracts the value of the detector’s dark current (a form of detector noise, essentially) which is then subtracted from the light measurement. Both light and dark measurements last the exact same time. A patented feature of the PR 650, the Automatic Adaptive Sensitivity function, determines the time it takes to measure the object. Basically the Automatic Adaptive Sensitivity adjusts the integration time (the time it takes to complete the measurement) based on the available signal, in other words – the stronger the signal, the shorter the integration time. The PR 650 will allow an integration time of anywhere from 13 milliseconds to 60,000 milliseconds (60 seconds). However, it a certain threshold is not attained in 32,000 ms, a low light warning is displayed, and if a certain threshold is not attained in 60,000 ms, a weak signal error appears, and the measurement terminated. This is why it is key to have a fairly bright illumination for the slit lamp, lending the PR 650 to a shorter integration time, which promotes accuracy, especially when using human subjects.
After the light passes through the aperture in the light measurement, it is passed through a polychromator (diffraction grating) that divides the light into separate wavelengths from 380nm to 780nm, with a spectral bandwidth of 5nm. The dark measurement is then subtracted from this data and the spectral intensity if corrected for instrument response. The final, corrected data is then stored for later calculation.
Methods: Data Acquisition
The first leg of my research was kicked off by compiling information on the anterior eye, especially the iris. Using several sources, the paper covered the cornea, aqueous humor, and iris, discussing their structure, functionality, appearance, and location.
Part two of the research commenced with the actual development of a method to image the iris. As I mentioned in the theory section, experiments involving human subjects presents several difficult challenges, not to mention the size consideration of the iris. The solution to these problems arrived in the formed of the Bio-Medical Photo department here at RIT, and, more specifically, the Topcon Slit Lamp SL 7E. Originally we were going to utilize the Carl Zeiss Inc ZVS 1470, but, as I mentioned, the Topcon provided brighter illumination, ideal for minimizing the spectrophotometer integration time. As I outlined in the equipment section, we had both the DCS 620 and PR 650 hooked up simultaneously to the Topcon.
At the initial data acquisition, we obtained several measurements utilizing this arrangement. For each measurement, we took (a) a high resolution digital image using the DCS 620 (f/16, ISO 640), and (b) obtained the spectral radiance for the object being measured using the PR 650. First, a mini color checker was imaged. There are a couple of reasons for this. First off, each block on the color checker gave us a consistent known color to analyze preliminary data. Secondly, by comparing the spectral radiance of the color checker through the optical system with the spectral radiance taken directly, we could assess any major distortions introduced by the Topcon. Also, a reconstructed color image of one of the color checkers could much more easily be compared to the original, to assess colorimetric linearity of the system. For each block on the color checker, a two images were taken – one with and one without a flash. For each color check, a single radiance measurement was taken. In addition to the uses mentioned above, the mini checker also supplies a white mini checker, which can be used the gauge the spectral radiance of the halogen light source. The spectral radiance of the halogen can then in turn correct the raw spectral radiances from the PR 650 measurements. However, to promote accuracy, a second white object was added, a halon target. The halon target was imaged in the same method as the color checker, and the data utilized in the same way as the white color checker. Possibly, one white source would prove more accurate than the other, and would then become the norm for calibration in future data acquisition. Both white sources were also measured under a green light, to create a preliminary set of six channels.
A fake eyeball was then imaged, to serve as both a test run and comparison to the actual human iris data. Then, we imaged human irises. Generally speaking, each iris was measured four times, at positions corresponding to approximately 9, 3, 6, and 12 o’clock. For each of these locations, the DCS 620 grabbed an image, and the PR 650 tallied the spectral radiance of that particular location.
Francisco Imai then supplied me with two other data sets. The first data set consisted of the spectral reflectances of the mini color checker, taken with the Gretag Macbeth Spectro Eye Part 36.64.00. This data set also included the spectral reflectance of the halon target obtained from the Macbeth ColorEye 7000 (specular excluded, UV excluded). This intention of this data set was to provide a comparison to the corrected spectral radiances, corrected for the spectral radiance of the halogen. Ideally, these two radiances would be very similar.
going through the optical system. The mini color checker, halon target, and two sets of human irises were measured. This data could then be compared with the data taken through the optical system to see if any major alteration are introduced via the microscope.
Methods: Analyzing the Data
Francisco Imai graciously supplied me with two programs that were of immense assistance in analyzing the data. The first was actually an amalgamation of a couple of IDL (Interactive Data Language) functions, which became named “CropIris.pro”. The input for this functions in this program was a high resolution image from the DCS 620. The key outputs from these functions were: (a) images for each channel (R, G, B) of the image, (b) histograms for each of these channels, (c)mean data for each of the channels. This data can be used to examine the channels or the images, seeing if any noticeable irregularities show up. Also, by running the program a few times for a single image, and comparing mean values, it can deduced whether any substantial color disparity issues arise.
The second program was a Matlab program called “PCA.m”. This program took as an input an array of the spectral radiances. The rows were lined up by wavelength, the columns by different reflectances. This program took a little adjustment to get it working properly, but once it was up and running, it provided an excellent alternative to trying to compute PCA by other more tedious methods. The program itself had several alterable variables, including increments between wavelength, number of wavelengths measured, and number of eigenvectors to be calculated in the PCA. The essential output of the program was a file that included: (a) total percent variance, (b) average color difference: mean, standard deviation, maximum, and minimum, (c) root mean square (RMS) error, and (d) metameric index using Fairman metameric black method, between measured and predicted under illumination A by chosen ink set: mean, standard deviation, maximum, and minimum. The two key results were the total percent variance and RMS error. The number of eigenvectors would indicated to us the number of channels needed to reconstruct the image. To decide how many eigenvectors, and thusly channels, were needed, we were looking for a very low RMS (<0.0001) and a percent variance above 99%.
A number of tasks were required of the spectral radiance data. First of, the data was plotted and examined for any obvious patterns, inconsistencies, or errors. Then the spectral radiance of the white mini checker and halon target were plotted and utilized to estimate the spectral radiance of the halogen lamp. This was done for both the measurements taken through the microscope and for those taken directly. Both the initial spectral radiances of the white mini checker and halon target, as well as the estimated spectral reflectance of the halogen, were compared, i.e. the optical system values and the direct values, to check for large errors indicating optical alteration.
Back to Table of Contents
Results
Results: Background Accumulation
As I mentioned before, the first part of my data consisted as a background document on the structure, makeup, and functionality of the anterior eye, especially the iris. A html version of that document is here: In Depth Examination of the Human Anterior Eye - Cornea to Iris.
Results: Raw Data
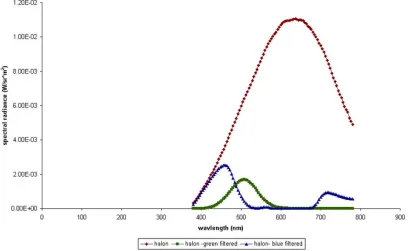
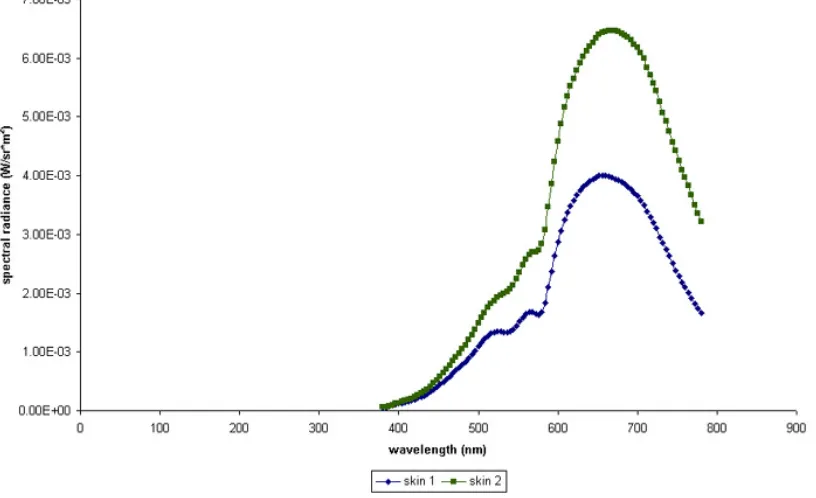
The first part of any data set is the raw, untouched data obtained directly from the experiment. In our case, the raw data was the spectral radiance of our experimental objects (provided by the PR 650) and the complimenting high resolution images (complements of the DCS 620). The set of spectral radiance data can be divided into two distinct sections: those taken through the optical system (Topcon SL 7E), and those taken directly. Each of these sections can be further broken down in to subsections, relating to what type of object was imaged. The following are graphs for various subsections of data taken through the Topcon:
Figure 2: Raw Spectral Radiance of Halon - Under Halogen and Under Green Filtered Halogen
[image:14.612.49.467.362.611.2]Figure 4: Raw Spectral Radiances for Kelly's Iris - A Blue Iris
[image:15.612.53.457.341.606.2]Figure 6: Raw Spectral Radiances for Joe Unander's Iris - Medium Brown Iris
[image:16.612.50.455.353.607.2]Figure 8: Raw Spectral Radiances for Bill Fisher's Iris
[image:17.612.53.452.346.608.2]The following are the various subsections of raw data taken directly:
Figure 10: Raw Spectral Radiances for Color Mini Checker - Taken Directly
[image:18.612.52.458.372.626.2]Figure 12: Raw Spectral Radiances For Halon Taken Directly - Regular, Green Filtered, and Blue Filtered
[image:19.612.49.461.357.608.2]Figure 14: Raw Spectral Radiances For Bill's Iris - Taken Directly
The next set of data is actually the images acquired using the DCS 620. Obviously, there are a lot of images, so it's only necessary for the purposes of this document to show a few examples. For both the mini checker and the irises, I've included eight examples:
Figure 16: Thumbnail link to DCS 620 Example Images of Color Mini Checker
Figure 17: Thumbnail link to DCS 620 Example Images of Human Irises
Results: Data From CropIris.pro
The images featured in the previous section where then processed through the IDL program CropIris.pro, which produced a set of three images for each DCS image: one in the Red Channel, one in the Green Channel, and one in the Blue Channel. The program also generated a histogram and a mean for each channel.
Results: Data From PCA.m
[image:21.612.52.460.61.311.2]The next step in that data process was the PCA analysis, using the Matlab program, PCA.m. The following is an example of one of the raw outputs from the program, this one at six eigenvectors:
Additional Raw data given in text format, for the example six eigenvectors:
The total percent variance described by 6 eigenvectors in reflectance space is 99.900560
The total percent variance described by 6 eigenvectors in reflectance space is 99.900560
illum =
3 1
The average color difference between measured and predicted by 6 eigenvectors is Mean 0.000565
Standard Deviation 0.000317 Maximum 0.001418 Minimum 0.000061
The root mean square error by 6 eigenvectors in reflectance space is 0.000082
The metameric index using Fairman metameric black method, between measured and predicted under illum A by choosed ink-set is
Mean 0.000024 Standard Deviation 0.000013 Maximum 0.000058 Minimum 0.000002
As mentioned earlier, the key values from each of these results are the RMS, root mean square error, and the variance. The number of eigenvectors, which translates to number of channels needed to reconstruct the image, would be determined by the number of eigenvectors that, ideally, has an RMS < 0.0001, and a variance > 99%. The following two plots, generated in Microsoft Excel, plot number of eigenvectors versus variance, RMS, and both variance and RMS. The desired threshold values are indicated by a line across the plot. In the plot that features both variance and RMS (normalized, of course), the threshold for each is indicated by the color of the data (e.g., the maroon threshold matches the maroon data of the RMS).
Results: Spectral Reflectance Estimations
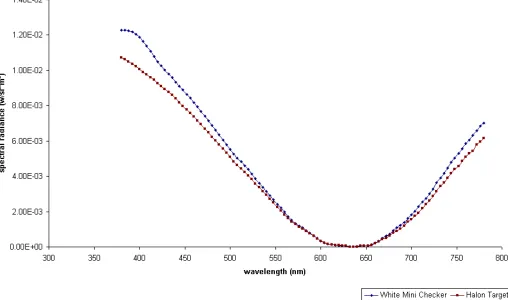
One of the tasks that needed to be accomplished was the estimation of the spectral reflectance of the halogen lamp, to use as a correction on the actual spectral values. The following are plots of the spectral reflectances of the halon target and white mini checker coupled with a plot of the estimated spectral reflectance of the halon target, using this raw spectral data. It should be noted that there is a possibility that these estimated spectral reflectances were calculated incorrectly, but I thought I would include them, nevertheless:
Results: Presence of Optical Abberation Check
One of the methods designed to identify optical error was a comparison of the spectral reflectance taken through the optical system and directly. Of course there should be some small discrepancies, as in any real experiment, but if the differences are substantial, that sets off a red flag that something is wrong. Applying this method to a couple different spectral reflectances can help to support whatever direction the evidence may point. The following are difference plots between the values taken directly and those taken through the optical system for the halon target and white mini checker, both the spectral reflectances of the target and the estimated spectral reflectances of the halogen light:
[image:30.612.55.563.81.381.2]Back to Table of Contents
Discussion
The first main result to look at is the data plots developed utilizing the data output from PCA.m. The first plot illustrates the variance values for each number of eigenvectors. The desired threshold value, a 99% variance, is highlighted by a threshold line across the plot. The ideal eigenvector value would have a percent variance above this. As you may observe, four eigenvectors falls above this threshold level, and would appear to be the obvious choice, prompting the indication of need for four channels to reconstruct the image. However, the second plot, the RMS (root mean square error) of each eigenvector, where the desired value should fall below the threshold of 0.0001 RMS, four eigenvectors lies above the threshold. In this plot, six eigenvectors is placed well below the threshold. Personally, I recommend five eigenvectors, because, as you can see in the second plot, it very nearly falls on the RMS threshold, and easily lies above the percent variance threshold. Barring a need to resolutely have an RMS below 0.0001 for whatever reason, five eigenvectors meets the qualifications. Thus, five channels will be required to reconstruct the image of the iris. The third plot, where I have normalized both the RMS and variance values so as to compare them in the same graph, backs up the choosing of five eigenvectors.
The second result to note here is the optical aberration check. There are two plots to look at here, one from the spectral radiances of the halon target and white mini checker, and the other from the estimated spectral radiance of the halogen lamp. The basic idea here was to subtract the measured spectral reflectances taken directly with the PR650, from those taken through the optical system. Both graphs seems to have sporadic values, maybe indicating that there is some type of optical error. However, a closer examination of the plots reveals the interval of values for the first plot to be of size 0.0012, and 0.0016 for the second plot. These are pretty small values, and should be of small enough size to be considered negligible. Therefore, it can be concluded that there is not substantial optical aberration, at least for white sources.
This same method can also be done for several of the mini checker colors. By checking other colors, one can assure that the optical system is not introducing any type of distortion, including chromatic (if only the white source values are compared, any serious chromatic aberration may be missed, a definite consideration in a color reproduction scheme). Eventually, this same operation can be committed to iris spectral radiances, except only for those with both direct and optical system values.
Back to Table of Contents
Conclusion
(5), and the lack of any serious optical aberration, at least with white sources. I hope that the large amount of data provided in this thesis may serve to supply additional conclusions to a person of higher research capabilities than myself. Additionally, hopefully the extensive background and theory will provide further leads to future insight on projects of a similar nature.
Project Iris: Image Reconstruction of the Iris Spectrally
Joseph Unander
References
1. Wildes, Richard P. "Iris Recognition: An Emerging Biometric Technology".
Proceedings of the IEEE
. Vol. 85, No. 9:
pp.1348-1363 (September, 1999).
2. Tovee, Martin J. An Introduction to the Visual System. Cambridge University Press, Cambridge: 1996.
3. Moses, Robert A., M.D.; Hart, William M., Jr., Ph.D., M.D. (editors ). Adler’s Physiology of the Eye- Clinical
Application. The C.V. Mosby Company, St. Louis: 1987.
4. Berman, Elaine R. Biochemistry of the Eye. Plenum Press, New York: 1991.
5. Weale, R.A. Focus on Vision. Harvard University Press, Cambridge: 1982.
6. Keating, Michael P., Ph.D. Geometric, Physical, and Visual Optics. Butterworths, Boston: 1988.
7. Falk, David S.; Brill, Dieter R.; Stork, David G. Seeing the Light- Optics in Nature, Photography, Color, Vision, and
Holography. John Wiley & Sons, New York: 1986.
8. Bolew, V.W.; Boashash, B. "A human identification technique using images of the iris and wavelet transform".
IEE
Transactions on Signal Processing
. Vol. 46, No. 4: pp. 1185-1188 (1998).
9. Wildes, Richard P.; Asmuth, Jane C.; Green, Gilber L.; Hsu, Steven C.; Kolczynski, Raymond J.; Matey, James R.;
McBride, Sterling E. "A machine-vision system for iris recognition".
Machine Vision and Applications
. Vol. 9: pp.1-8
(1996).
10. Webb, Warren. "High-tech security: the eyes have it".
EDN
. Vol. 42, No. 26: pp. 75-76, 78 (1997).
11. Wildes, Richard P. "Iris Recognition: An Emerging Biometric Technology".
Proceedings of the IEEE
. Vol. 85, No.
9: pp. 1348-1363 (1997).
12. Lupelli, L; Pescosolido, N. "Tinted soft contact lenses: an up-to-date review".
Attidella Fondazione Giorgio Ronchi
.
Vol. 51, No.3: pp. 449-68 (1996).
13. Siebel, E.J. "Validation of a method for measuring small color differences in pigmented contact lenses".
Optometry
and Vision Science
. Vol. 66, No. 2: pp. 48-55 (1989).
14. Harris, M.G.; Haririfar, M.; Hirano, K.Y. "Transmittance of tinted and UV-blocking disposable contact lenses".
Optometry and Vision Science
. Vol. 76, No. 3: pp. 177-80 (1999).
15. Josephson, J.E.; Caffery, B.E. "Visual field loss with colored hydrogel lenses".
American Journal of Optometry and
Physiological Optics
. Vol. 64, No. 1: pp. 38-40 (1987).
16. Garcia-Monello, R.; Rubino, M.; Hirano, K.Y.; "Influence of X-chrom contact lenses on the chormatic
discrimination of subjects with defective color vision".
Atti della Fondazione Giorgio Ronchi
. Vol. 52, No. 5: pp.
657-67 (1997).
17. Schlanger, J.L. "The JLS lens: An aid for patients with color vision problems".
American Journal of Optometry and
Physiological Optics
. Vol. 62, No.2: pp. 149-51 (1985).
19. Imai, Fransico H.; Berns, Roy S. "High-Resolution Multi-Spectral Image Archives - A Hybrid Approach".
Sixth
Color Imaging Conference
. Scottsdale, Az.: Novemeber, 1998.
Back to Table of Contents
Project Iris: Image Reconstruction of the Iris Spectrally
Joseph Unander
Appendix
List of Web Sites Referenced
1.
http://www.expresscontacts.com/text/Faq.htm
2.
http://www.cvworld.com/index.html
3.
http://www.bausch.com/index.html
4.
http://www.coopervision.com/cv/natural
5.
http://www.ultralase.co.uk/chromg.htm
6.
http://www.colormaxtech.com
Back to Table of Contents
Back to Thesis