Int. J. Electrochem. Sci., 8 (2013) 5479 - 5486
International Journal of
ELECTROCHEMICAL
SCIENCE
www.electrochemsci.orgSoil Near Infrared Composition Detection Apparatus Design
Xiaoyu Yu *, Yunbo Shi, Yitong Wang
The Higher Educational Key Laboratory for Measuring & Control Technology and Instrumentation of Heilongjiang Province, Harbin University of Science and Technology, Harbin 150080, China
*
E-mail: woshiyuxiaoyu@yahoo.com.cn
Received: 26 February 2013 / Accepted: 19 March 2013 / Published: 1 April 2013
In this paper, we focus on the needs for realizing fast and nondestructive measurement of total nitrogen and organic matter content in the soil, designed a near infrared soil component content detection apparatus. The reflected light intensity, which carried the sample internal characteristic information, was measured the total nitrogen and organic matter content indirectly. The structure of the paper is as follows: First of all, designed the system hardware part with the Czerny-Terner grating splitting optical path. The apparatus hardware consisted of mainly light path and electrocircuit. The light path included light source, spectral element and photoelectric conversion element. The electrocircuit part included amplifies, filters and A/D converts. The diffuse light was converted to electrical signal by the photoelectric conversion element, and then the digital signal was displayed, stored. Secondly, using the partial least square method to establish soil component content near infrared application model. Finally, the performance of the apparatus was verified with soil samples test. The experimental results showed that: near infrared reflectance and the soil total nitrogen and organic matter content had significant correlation, the determination coefficient, which was obtained by the partial least squares of the total nitrogen and organic matter, was 91.84% and 81.06%. Thought the experiments proved that the apparatus can basic meets for soil component content detection requirements in agricultural production.
Keywords: Near infrared spectrum instrument; Diffuse reflection technology; Soil component content
detection; Partial least squares method
1. INTRODUCTION
nitrogen and organic matter content can generally understand soil fertility conditions [1]. But the traditional measurement method is getting soil samples back to analyse in the lab. This method, which not only requires that the experimenters should have higher skill level but also needs high cost, seriously restrict a wide range to popularize the soil fertility testing [2-3]. In recent years, with the development of optics, computer technology and chemical measurement technology, the stability, practicability and accuracy of near infrared spectrum instrument have been improved. And the advantages of NIRS such as: rapid, simple and nondestructive testing are being known. Because of the huge advantages, which near infrared spectrum instrument has, this paper focused on that near infrared spectrum instrument can be introduced into the soil parameters measurement [4-6].
Bowers and Hanks Al-Abbas[7] of the United States found that in near infrared region the characteristics grain trace of soil organic matter had relationship with organic compound several functional group. B. Wangner[8] made use of NIRS (wave number 3850~10000cm-1) to predict the soil organic matter content, The correlation of NIRS prediction and chemical measurements were very good (R2=0.91). M. Chodak[9] made use of NIRS to predict nitrogen content of woodland organic layer and the results showed that NIRS could well predict the nitrogen of soil organic layer contained with the chemical measured value and the value predicted by NIRS regression coefficient between 0.9 and 1.0, the correlation coefficient R2≥0.9. Reeves and Mccarty[10] used NIRS method to forecast the soil total nitrogen content, scaling and the predicted results indicated that if the soil types changed a lot, the was a bit poor, if soil types changed less, forecast effect was more accurate. Cheng-Wen Chang[11] predicted soil total nitrogen content by NIRS, the correlation coefficient R2≥0.85. They predicted soil total nitrogen according to an independent spectral response to the NIRS, not according to the prediction relationship previous between the total organic carbon and total nitrogen. K. W. Daniel[12] collected 41 soil samples in Thailand tropical to predict organic matter content with the regression modeling, analysis showed that organic matter had strong absorbance in the 520 nm, 960 nm and 1100 nm. From these scholars' research, the detection of soil total nitrogen and organic matter content based on near infrared technology has proven to be possibility and feasibility[13-15]. Recently, more and more scientific research workers paid attention to develop spectral instrument, and had successfully studied and developed many types near infrared spectrum instrument applied in different areas, we had made great progress in instrument and application software development.
Therefore, this research devoted to develop a near infrared soil composition detection apparatus to meet the on the field condition, and tested performance of the apparatus through experiments.
2. EXPERIMENTAL DETAILS
depends on the light absorption caused by the physical condition of the samples. Diffuse reflection abides the Kubelka-Munk equation:
2 1
log log 1 K K 2 K
A
R S S S
(1)
Including: A- reflection absorbance of diffuse reflector. R- diffuse reflector’s diffuse rate. K- diffuse reflector’s absorption coefficient. S- scattering coefficient of diffuse reflector.
WhenK S/ is in a certain range, Aand K S/ can use the linear relationship to replace the curve relationship.
( / )
A a b K S (2)
TheK S/ function of diffuse reflection spectrum:
( ) /
F R K Sbc (3)
bis constant which has relationship with sample mole absorption coefficient and optical path parameters; c- sample component concentration. That is, they were direct proportion relationship between a function and sample concentration. Therefore, as long as the sample absorbance is measured, we can know the content of samples.
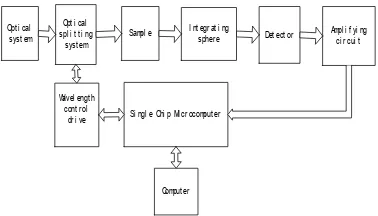
Fig. 1 shows the principle block diagram of the soil composition detection apparatus. Apparatus mainly was divided into light path and circuit part. The light path part included: light source system, beam-splitting system, integrating sphere and PbS detector. Circuit part included: amplifying circuit, phase sensitive detection circuit, single-chip and wavelength control drive and so on.
Opt i cal syst em
Wavel engt h cont r ol
dr i ve
Comput er Si ngl e Chi p Mi cr ocomput er
Ampl i f yi ng ci r cui t Det ect or Sampl e
Opt i cal spl i t t i ng syst em
[image:3.596.203.392.518.626.2]I nt egr at i ng spher e
Figure 1. Block diagram of the system
light passed through the integrating sphere and irradiated sample pool. The reflected light from the sample was received by the detector, which converted optical signal to electrical signal. The electrical signal was magnified, filtered, then the data of sample component content was displayed, transmitted and stored by upper computer. The spectrogram of absorbance was shown on the PC after receiving transmitting data from the serial port.
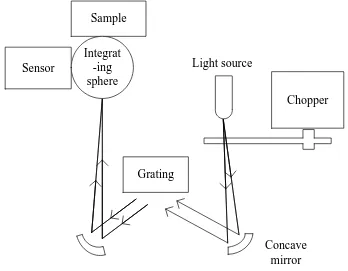
Czerny - Terner grating spectral optical path was utilized to design light path, the light path structure principle block diagram was shown in Fig. 2.
Grating Sample
Sensor
Integrat -ing sphere
Concave mirror
[image:4.596.121.469.208.479.2]Chopper Light source
Figure 2. Block diagram of the optical structure
Detector Preamplifier
Bandpass filtering
Lock-in amplifier
A/D conversion Display
Data transmission Diffuse light signal
Single Chip Microcomputer
[image:5.596.118.464.75.322.2]Grating drive
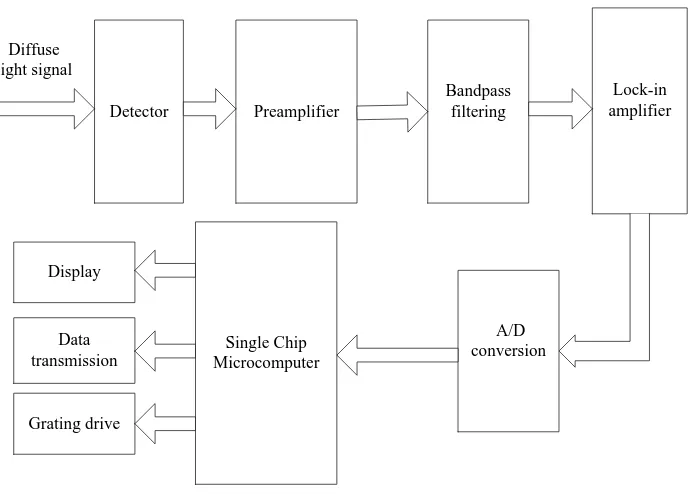
Figure 3. Block diagram of the electronic circuits
Then monochromatic light that we needed focused on the sample by the focus objective, sample pool window was designed on the other side of integrating sphere incident window. Diffuse light reflected by the sample accumulated and stacked in the integrating sphere, then the diffuse light was received by detector which was placed on 90° direction of integrating sphere side for photoelectric conversion, the circuit part analysed electrical signal that was converted from optical signal which carried the information of the sample. PbS detector was selected as photoelectric converting device because of its sufficient response range.
converted by A/D conversion, then was processed by the single chip microcomputer, finally the data obtained was transmitted to the PC to draw the diffuse reflection spectra.
3. RESULTS & DISCUSSION
We used the northeast black earth as test samples which acquired from field environment. Acquisition depth was 20cm below the surface of earth and the weight of the sample was 2 kg. The sample was spread out for natural air drying in the indoor, grinding into powder after it was dry. Then used 1 mm sieve to filter, each group sample was divided into two seals to save after filtering. One of the seals was for a chemical method being a reference to measure organic matter and the exact value of total nitrogen content, another seal as the establishment of the forecasting model.
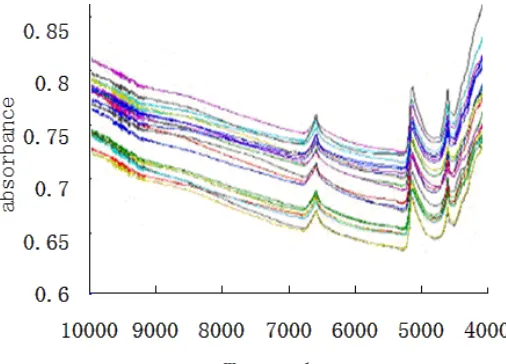
[image:6.596.171.424.498.680.2]Before beginning the experiment, the apparatus should be on 30 minutes to warm up, after the apparatus stability, a standard white board was used to instead of samples, the signal of apparatus output was recorded. Then the soil samples to be measured were put in the sample pool, the output signal was obtained to calculate the soil sample absorbance. Fig. 4 was a near infrared spectral curve got with all soil samples obtained multiple spectral scanning. The chart clearly showed that in the vicinity of wavenumbers of 7150 cm-1, 5300 cm-1 and 4750 cm-1 (wavelength of 1400 nm, 1900 nm and 2100 nm ), each group of spectral curve of samples in certain wavelength had obvious change, and the change rule and trend of each group of measured sample spectrum curve were basically the same, the absorption peak number and position were also the same. Because of the characteristic absorption peak, the soil samples were measured in the corresponding wavelength. Each group of samples of absorbance were different because of different factors influenced it which the sample particle’s size or dry degree of each group of samples.
[image:7.596.191.404.305.467.2]
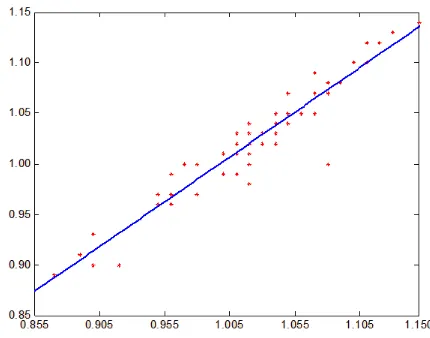
Figure 5. The prediction model of TN in the samples
Figure 6. The prediction model of OM in the samples
Fig. 5 was established through the test of the soil total nitrogen content partial least squares forecast model, decision coefficient was 91.84%, calibration standard deviation was 0.1805.
Fig. 6 was established through the test of soil organic matter content partial least squares forecast model, decision coefficient was 81.06%, calibration standard deviation was 0.3656.
4. CONCLUSION
A soil composition detection apparatus based on near infrared diffuse reflection technology was designed using the Czerny-Terner grating spectral optical path structure, designing the signal processing circuit of back end signal amplification, phase sensitive detection and serial interface communication. The single chip microcomputer controlled the drive of underlying and displayed the value of soil total nitrogen and organic matter content measured value, the upper computer stored the spectral data and displayed spectrum diagram. The apparatus performance test results showed that the apparatus performance basically met the design requirements. The soil total nitrogen content and organic matter content all have the very high correlation with the near infrared absorbance, prediction model decision coefficient were 91.84% and 81.06% respectively, the apparatus can completely satisfy the measurement demands of the agriculture, the near infrared spectrum apparatus in special field application had certain promote significance and practical value.
References
1. Y. Huang, D. Wang and J. Duan, Mod. Instruments, 5 (2011) 13. 2. W. Z. Lu, H. F. Yuan and G. T. Xu, Chin Petrochemical Press, 2007. 3. J. Zhang, X. D. Chen and Z. G. Piao, Optics Precision Eng, 16 (2008) 986. 4. M. M. Shi, M. Z. Huang, ACTC Photonics Sin. , 40 (2011) 591.
5. L. Zhang, Optics Precision Eng. , 8 (2000) 238.
6. F. R. Huang, T. Pan and G. L. Zhang, Optics Precision Eng. , 18 (2010) 586. 7. S. A. Bowers, Soil Sci. , 10 (1965) 130.
8. B. Wagner, R. Gutser and U. Schmidhalter, Soil Sci. , 20 (2001) 752.
9. M. Chodak, B. Ludwig, P. Khanna and F. Beese, Plant Nutr. Soil Sci. , 165 (2002) 27. 10.J. Reeves, G. Mccarty, Near Infrared Spec. , 13 (1999) 153.
11.C. Chang, Soil Sci. , 17 (2002) 110.
12.K. W. Daniel, N. K. Ripathi and E. Apisit, Int. J. Remote Sens. , 3 (2004) 643. 13.L. Maric-france, P. Raquin and J. Arg. Food Chem. , 47 (1999) 2600.
14.X. ZHAN, J. LIN and Z. H. ZHOU, Chin. J. Sci. Inst. , 23 (2002) 29.
15.I. Schnieder and G. Nau, T. V. V. King, IEEE Photonics Tech. L. , 7 (1995) 87.
