Int. J. Electrochem. Sci., 10 (2015) 10321 - 10335
International Journal of
ELECTROCHEMICAL
SCIENCE
www.electrochemsci.org
Short Communication
Effect of Nitro Groups on Electrochemical and Photovoltaic
Behavior of Tris-thiophenes used in Organic Solar Cells.
P.P Zamora1,*, K. Bieger1,D.Vasquez2, M. Merino1, R. Maurelia1
1 Universidad de Atacama, Departamento de Química y Biología, Facultad de ciencias naturales, Copayapu 485, Copiapó, Chile
2 Universidad de Chile, Facultad de ciencias químicas y farmacéuticas, Sergio Livigstone 1007, Santiago, Chile.
*E-mail: pedro.zamora@uda.cl
Received: 31 July 2015 / Accepted: 6 October 2015 / Published: 4 November 2015
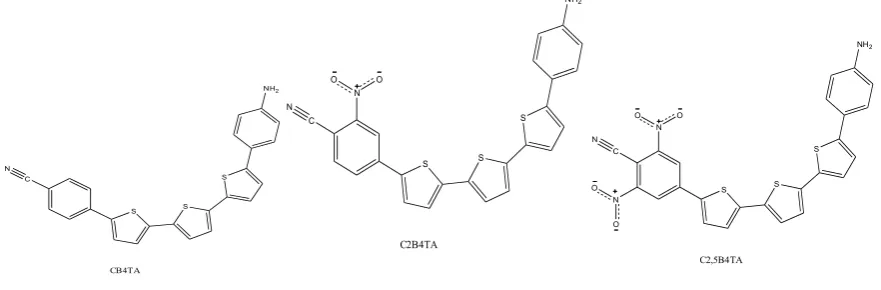
4-[35-(4-aminophenyl)[12,22:25,32-terthiophen]-15-yl]benzonitrile (CB4TA), 4-[35 -(4-aminophenyl)[12,22:25,32-terthiophen]-15-yl]-2-nitrobenzonitrile (C2B4TA) and 4-[35 -(4-aminophenyl)[12,22:25,32-terthiophen]-15-yl]-2,6-dinitrobenzonitrile (C2,5B4TA), the first molecule without nitrogroups and the others with electron withdrawing nitro-groups, were successfully synthesized. This family of compounds has acceptor and donor moieties in the same molecule. The acceptor and donor functions are separated by a “molecular bridge”. All molecules were studied to evaluate the effect of nitro groups on the photovoltaic yield in an organic solar cell (OPVC). CB4TA and the related molecules were characterized via NMR-spectroscopy, optical and electrochemical methods and then deposited by high vacuum sublimation over ITO treated with MoO3 and CuI as buffer layers. Subsequently the morphology of deposits was characterized using atomic force microscopy (AFM) and X-ray diffraction (XRD). The photovoltaic devices were built under the same conditions, observing differences in the photovoltaic yield. Results show that the nitro groups have important effects over frontier orbitals and photovoltaic yield.
Keywords: Electron withdrawing effect, nitro-groups, morphology, XRD, electrochemistry, photovoltaic yield.
1. INTRODUCTION
Donor acceptor molecules have attracted particular attention, due to outstanding environmental stability, low band gap value, good conductivity, charge transfer and reasonable photovoltaic yield.[5-9] For this reason, donor--bridge-acceptor molecules are materials with photoelectrical properties that could be used in OPVC. To increase efficiency in technological development and succeed in the design of new and improved materials it is important to find out the relationship between photoelectrical properties, electronic structure morphology and the electron-withdrawing (in our case nitro groups) effect of functional groups on these devices. With respect to the morphology it is very important to establish a good contact between the donor-acceptor molecule and fullerene which is used as standard molecule to accept electrons in multi heterojunction photovoltaic devices. [10]
The energy gap (Eg) between the highest occupied molecular orbital (HOMO) and the energy of the lowest unoccupied molecular orbital (LUMO) is an important parameter to decide if a molecule can be used in a photovoltaic device as well as to understand and to tune the optical, electrical and chemical properties of these molecules by chemical modifications. This parameter can be estimated from electrochemical and optical (by UV-vis spectroscopy) measurements [11]
In this work we report how the introduction of nitro-groups in the molecules (CB4TA), (C2B4TA), (C2,5B4TA) can change their behavior in OPVCs. It causes higher light absorption, promotes both better inter- and intra-molecular charge transfer (determined by J/V curves and photovoltaic yield) and produces better stacking/aggregation (by XRD) leading to a small energy band gap [12].
2. EXPERIMENTAL DETAILS
All chemicals and solvents were purchased from Aldrich, and were used as received. All products obtained were characterized using NMR and UV-vis spectroscopy. Structures were confirmed by NMR spectra recorded on a Bruker 400 MHz spectrophotometer using DMSO d6 as solvent.
Molecular structures are shown in figure 1
[image:2.595.76.517.534.679.2]C N S S S NH2 CB4TA C N S S S NH2 C2B4TA N O O C N S S S NH2 C2,5B4TA N O O N O O
Figure 1. Structures of molecules used as electron donors in OPVC
Synthetic Procedure:
Synthesis of 4-methyl-2-(2-thienyl)benzene 1
2.5g of p-bromotoluene and 3.5g of 2-thienylboronic acid were heated in 200 mL of anhidrous THF in presence of 10% Pd/C as catalyst for 48 h in a sealed tube under argon atmosphere in a sealed high pressure tube. Once cooled down to room temperature the reaction mixture was transferred to a separation funnel equipped with 30mL of saturated aqueous NaCl-solution and extracted 4 times with 50mL ethyl acetate EtOAc each. The organic phase was dried over MgSO4, filtered and concentrated on a rotary evaporator. The residue was re-dissolved in 50mL of EtOAc and purified via column chromatography on silica gel using EtOAc/petrol ether 10:1 as eluent.
Purity of the fractions was monitored by TLC. Pure fractions were united and evaporated under reduced pressure yielding 2g (77%) of 1. The resulting product characterized by 1H NMR spectroscopy.
Synthesis of 2
2g of 1 and 500mg of NBS were dissolved in 200mL of THF and stirred for 3 h at 10°C. Than the reaction mixture was transferred to a separation funnel equipped with 30mL of saturated aqueous NaCl-solution and extracted 4 times with 50mL ethyl acetate EtOAc each. The organic phase was dried over MgSO4 and evaporated under reduced pressure. The residue was redissolved in 50mL of EtOAc and the product was purified by column chromatography on silica gel using EtOAc/n-hexane 5:1 as eluent.
Purity of the fractions was monitored by TLC. Pure fractions were united and evaporated under reduced pressure yielding 1.5g (75%) of 2. The resulting product was characterized by 1H NMR spectroscopy.
Synthesis of 3
organic phase was dried over MgSO4, filtered and concentrated on a rotary evaporator. The residue was re-dissolved in 50mL of EtOAc and purified via column chromatography on silica gel using EtOAc/n-hexane 7:1 as eluent.
Purity of the fractions was monitored by TLC. Pure fractions were united and evaporated under reduced pressure yielding 1.4g (93%) of 3. The resulting product was characterized by 1H NMR spectroscopy.
Synthesis of 4
1.4g of 3 and 467 mg of NBS were dissolved in 200 mL of THF and stirred for 3 h at 10°C. Than the reaction mixture was transferred to a separation funnel equipped with 30mL of saturated aqueous NaCl-solution and extracted 4 times with 50mL ethyl acetate EtOAc each. The organic phase was dried over MgSO4 and evaporated under reduced pressure. The residue was redissolved in 50mL of EtOAc and the product was purified by column chromatography on silica gel using EtOAc/n-hexane 5:2 as eluent.
Purity of the fractions was monitored by TLC. Pure fractions were united and evaporated under reduced pressure yielding 1.2g (88 %) of 4. The resulting product was characterized by 1H NMR spectroscopy.
Synthesis of 5
1.2g mg of 4 and 1.7g of 2-thienylboronic acid were heated in 100mL anhydrous THF for 48h in presence of 10% Pd/C as catalyst in a sealed tube under argon atmosphere. Once cooled down to room temperature the reaction mixture was transferred to a separation funnel equipped with 30mL of saturated aqueous NaCl-solution and extracted 4 times with 50mL ethyl acetate EtOAc each. The organic phase was dried over MgSO4, filtered and concentrated on a rotary evaporator. The residue was re-dissolved in 50mL of EtOAc and purified via column chromatography on silica gel using EtOAc/n-hexane 8:3 as eluent.
Purity of the fractions was monitored by TLC. Pure fractions were united and evaporated under reduced pressure yielding 1g (83 %) of 5. The resulting product was characterized by 1H NMR spectroscopy.
Synthesis of 6
1g of 5 and 400mg of NBS were dissolved in 200 mL of THF and stirred for h 3 h at 10°C. Than the reaction mixture was transferred to a separation funnel equipped with 30mL of saturated aqueous NaCl-solution and extracted 4 times with 50mL ethyl acetate EtOAc each. The organic phase was dried over MgSO4 and evaporated under reduced pressure. The residue was redissolved in 50mL of EtOAc and the product was purified by column chromatography on silica gel using EtOAc/n-hexane 5:1 as eluent.
Synthesis of 7
880 mg of 6 and 1.2g of 4-aminophenyleboronic acid were heated in 100 mL of THF in presence of 10% Pd/C as catalyst for 48h in a sealed tube under argon atmosphere. Once cooled down to room temperature the reaction mixture was transferred to a separation funnel equipped with 30mL of saturated aqueous NaCl-solution and extracted 4 times with 50mL ethyl acetate EtOAc each. The organic phase was dried over MgSO4, filtered and concentrated on a rotary evaporator. The residue was re-dissolved in 50mL of EtOAc and purified via column chromatography on silica gel using EtOAc/n-hexane 8:3 as eluent.
Purity of the fractions was monitored by TLC. Pure fractions were united and evaporated under reduced pressure yielding 1.2g (29%) of 7. The resulting product was characterized by 1H NMR spectroscopy.
Synthesis of 8
1.2g of 7 were dissolved in 200 ml of anhydrous THF and 600 mL of pentanoic acid chloride were added. The mixture was heated for 40 min to 50 ºC. Once cooled down to room temperature the reaction mixture was transferred to a separation funnel equipped with 30mL of saturated aqueous NaCl-solution and extracted 4 times with 50mL ethyl acetate EtOAc each. The organic phase was dried over MgSO4, filtered and concentrated on a rotary evaporator. The residue was re-dissolved in 50mL of EtOAc and purified via column chromatography on silica gel using EtOAc/n-hexane 9:2 as eluent. Purity of the fractions was monitored by TLC. All pure fractions were united and the solvent evaporated under reduced pressure yielding 1.1g (95%) of 8. The product was characterized by 1 H-NMR spectroscopy.
Synthesis of nitrated product 9
20 mg of 8 were dissolved in 100 mL of CHCl3. 5 mL of conc. HNO3 and 15 mL of conc. H2SO4 were added and the mixture was heated in a sealed tube under argon atmosphere for 24 h to 50 ºC. Once cooled down to room temperature the reaction mixture was transferred to a separation funnel equipped with 30mL of saturated aqueous NaCl-solution and extracted 4 times with 50mL ethyl acetate EtOAc each. The organic phase was dried over MgSO4, filtered and concentrated on a rotary evaporator. The residue was re-dissolved in 50mL of EtOAc and purified by column chromatography on silica gel with EtOAC/n-hexane 10:1 as eluent. Purity of the fractions was monitored by TLC and the desired pure fractions evaporated together yielding 22 mg (78 %) of 9. The product was characterized by NMR spectroscopy.
Synthesis of double nitrated product 10
on silica gel with EtOAc/n-hexane 10:1 as eluent. Purity of the fractions was monitored by TLC and the desired pure fractions evaporated together yielding 5 mg (29 %) of 10. The product was characterized by NMR spectroscopy.
Synthesis of nitriles 11, 12 and 13
28 mg of 8 respectively 12 mg of 9 or 5 mg of 10 were dissolved in 100 mL of anhydrous ethanol. 10% Pd/C were added, and the mixture heated with NH3 and O2 (NH3 and O2 anhydrous were purchased from sigma-aldrich) in the high pression tube for 24h to 200 ºC. Than the solvents and the excess of O2 and NH3 were evaporated. Once cooled down to room temperature the reaction mixture was transferred to a separation funnel equipped with 30mL of saturated aqueous NaCl-solution and extracted 4 times with 50mL ethyl acetate EtOAc each. The organic phase was dried over MgSO4, filtered and concentrated on a rotary evaporator. The residue was re-dissolved in 50mL of EtOAc, and the products purified by column chromatography on silica gel using as eluent CHCl3/n-hexane 5:1 for 11, EtOAc/n-hexane 4:1 for 12 and EtOAc/n-hexane 10:3 for 13. The resulting pure fractions containing 11, 12 and 13 respectively were evaporated and the resulting products yiendeling 15mg (54%) for 11, 5mg (42%) for 12, 2mg (40%) for 13. The products were characterized by 1H-NMR spectroscopy.
Synthesis of the unprotected nitriles 14, 15 and 16
15mg of 11 or 5mg of 12 or 2mg mg of 13 respectively were dissolved in 50 mL of EtOH and 0.5 mL of concentrated sulphuric acid were added. The mixture was heated in a sealed tube for 2 h to 100 ºC. Once cooled down to room temperature the reaction mixture was transferred to a separation funnel equipped with 30mL of saturated aqueous NaCl-solution and extracted 4 times with 50mL ethyl acetate EtOAc each. The organic phase was dried over MgSO4, filtered and concentrated on a rotary evaporator. The pure fractions containing the desired products were evaporated yielding 12mg (80%) of 14, 3.8mg (75%) of 15 and 1.8 mg (90%) of 16 respectively.
UV-Vis measurements were carried out on a CARY 5G spectrophotometer in solution and solid state. The donor acceptor films of (CB4TA), (C2B4TA), (C2,5B4TA) were prepared by thermal evaporation (high vacuum sublimation) at 1x10⁻⁷ atm of pressure at the same time as the photovoltaic devices. The deposit rate of each molecule was 0.5 Å·s-1 and the film thickness was 100 Å for donor acceptor molecules CB4TA, C2B4TA, C2,5B4TA while for the fullerenes the film thickness was 400 Å for the development of multilayer OPVCs [13,14]
The optical energy gap (Eg) for all molecules was obtained from the UV-vis spectra using the Tauc approximation [15-18]:
(1) Eg = 1242/ λonset
The electrochemical work was performed on a Voltamaster model CV 50W potenciostat/galvanostat, using a conventional three-compartment, three-electrode cell, and a polycrystalline platinum disk (0.07 cm2 geometric area) as working electrode. The counter electrode was a coiled Pt wire of large area, separated from the electrolytic solution by a sintered glass. The reference electrode was an Ag/AgCl electrode that matches the potential of the saturated calomelane electrode (SCE). Then all potentials quoted in the electrochemical section, are referred to the SCE. HOMO and LUMO measurements of each molecule (0.01 mol·L-1) were carried out in anhydrous acetonitrile using tetrabutylammonium hexafluorophosphate (TBAPF6, 0.1 mol·L-1) as supporting electrolyte. The system was kept under argon atmosphere and all measurements were performed at room temperature [19]
The photovoltaic devices were assembled in a multi heterojunction structure as follows: indium tin oxide (ITO)/ anode buffer layer / donor acceptor molecule / fullerene (C60) / bathocuproine (BCP) / Al [20]. All molecules were used in undoped state. The device was prepared by sublimation at 1x10⁻⁷ atm. The thin film deposition rates and thickness were estimated in situ through a quartz monitor. Electrical characterizations were performed with an automated I-V tester, in dark and then emulating solar conditions with a global AM 1.5 simulator. Performances of photovoltaic cells were measured using a calibrated solar simulator (Oriel 300W) at 100 mW/cm2 light intensity [11,19]
The morphology of the ITO surfaces was characterized by AFM with a Bio AFM JPK in the tappig mode. Measurements were achieved at room temperature, using the same pyramidal Si3N4 tip. The surface roughness Rrms (root mean square roughness) of each molecular surface was evaluated with the AFM software. [11,19]
The crystalline structure of the films was analyzed by X-ray diffraction (XRD) by a Siemens D 5000 diffractometer using K radiation from Cu (=0.15406 nm)
3. RESULTS AND DISCUSSION 3.1. Molecular synthesis
The molecules were synthesized via Suzuki-Miyaura cross-coupling reaction [21] according to the procedure described by Bryce et al. [22].
3.2. Molecules characterization
During synthesis optimization thin layer chromatography was used for monitoring the reaction progress. However, after purification of the compounds at those times, the yields found where 70% for CB4TA, 50% for C2B4TA and 30% for C2,5B4TA.
3.3. CB4TA 1H NMR characterization
3.4. C2B4TA 1H NMR characterization
1H NMR (400 MHz, CDCl3): δ 7,32 (m), 7.20 (s, 2H), 7.15 (td, J = 7.9, 7.7 and 1.5 Hz, 2H), 6.81 (td, J = 7.6, 7.5 and 1.2 Hz, 2H), 6.78 (dd, J = 8.0 and 0.9 Hz, 2H), 3.99 (s, 4H).
3.5. C2,5B4TA 1H NMR characterization
1H-NMR (400 MHz, CDCl3): δ 7.20 (m) 7,55 (s. 2H); 6.72 (d, J= 7.5 Hz, 2H); 7.07 (dd, J=7.0 and 1.5Hz, 1H); 7.20 (d, J= 3.5, 1H); 7.22 (d, J= 4.5 Hz, 1H); 7.47 (d, J=7.5Hz, 2H)
3.6. Electrochemical Properties (HOMO LUMO and Eg)
The electrochemical HOMO, LUMO and Eg were determined from solutions of each molecule with concentrations of 0.01 mol·L-1 and TBAPF6 0.1 mol·L-1 supporting electrolyte.
The measurement was done by cyclic voltammetry (CV) (potentials between -2.0 and 1.5 V, 50 mV·s-1 scan rate). Electronic molecule responses were assessed applying a perturbation to the modified electrode (previously to cyclic voltammetry the electrode was coated by the molecules) in anhydrous acetonitrile with TBAPF6 0.1 mol·L-1 free of molecules finding in all cases p-type doping and n-type doping. Figure 2 displays the CV of all molecules.
To estimate the HOMO and LUMO energy, the slope change of the anodic and catodic current were determined. Figure 2. These values correspond to the onset oxidation potential (Eox), and onset reduction potential (Ered), and they correlate linearly with the HOMO and LUMO energy, with a correction factor of 4.4 eV [23-30].
EHOMO = -((Eox)on + 4.4)eV (2) ELUMO= -((Ered)on + 4.4)eV (3)
The electrochemical band gap was calculated using the difference between the electrochemical HOMO and LUMO obtained [31]. The optical Eg is in agreement with the electrochemical band gap but with the difference that charge transport in CV is coupled to mass transfer while in optical measurements only electron movement is necessary. Results are shown in table 1 [32-33].
Geometry of the molecules deposited on the platinum electrode is similar to that in solution but, when the Eg is determined by UV-vis in solid state, after deposal by high vacuum sublimation over ITO modified with the buffer layers geometry changes and a red shift is observed Figure 3. Results will be discussed in the UV-vis section. Molecular geometry is very important to obtain desired values for Eg because it plays a decisive role for the conjugation of the π-system on the molecule backbone [19]. Thus changes of the geometry will affect also the conjugation and in consequence the Eg energy.
a) CV CB4TA b) CV C2B4TA c) CV C2,5B4TA
[image:10.595.78.520.69.186.2]Figure 2. Electrochemical calculation of HOMO LUMO: a) CB4TA b) C2NB4TA c) C2,5NB4TA
Table 1. Electrochemical and optical band gap of molecules
Molecule HOMO (eV)
LUMO (eV)
Eg (eV)
Egopt (eV) in solution
Egopt (eV) in solid state
CB4TA -5.1 -2.6 2.5 2.1 2.3
C2B4TA -5.2 -3.3 1.9 1.8 1.4
C2,5B4TA -5.7 -3.7 2.0 2.1 1.4
3.7. UV vis spectroscopy
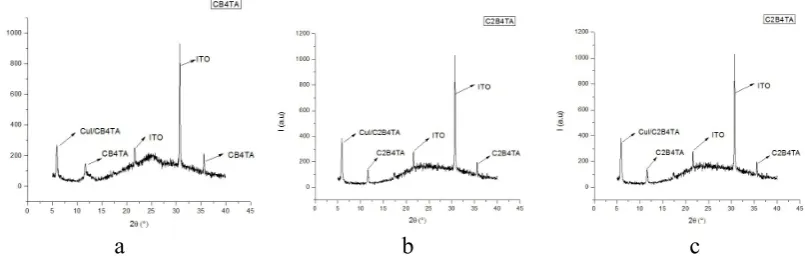
Figure 3 shows UV vis spectra of all molecules in solution (DMSO) and in solid state. It is possible to observe how the electron withdrawing groups produces a red shift and an Eg reduction in both solution and solid state. In solid state is possible to observe a red shift for all materials. This means that conjugation has increased probably due to interactions with buffer layers. In early works we have observed [11,19,34], as well other researchers [35-37] that the CuI buffer layer can interact with molecules with nitrogen in the structure resulting in an ordered first layers of molecules that increases conjugation and decreases the band gap. The affinity of trivalent nitrogen to copper leads to Cu-N interactions and forces the geometry of the molecule. [11,19,34-37].
[image:10.595.74.524.270.397.2]
a b
Figure 3. a) UV-vis spectrum in solultion b) UV-vis spectrum in solid state
Figure 3b shows that the molecule CB4TA in solid state has a large Eg which can reduce the photovoltaic yield because there are fewer electrons available for excitation to LUMO levels. In this sense the nitro groups help the OPVC to work with low energy photons.
The UV vis spectra show how a large Eg in a molecule with can be reduced by the introduction of nitro groups. This shows that the nitro groups allow to manipulate certain properties in the molecules as well as in OPVC to increase the photovoltaic yield.
3.8. XRD spectroscopy
[image:11.595.64.547.71.321.2][image:12.595.94.497.73.204.2]
a b c
Figure 4. XRD of all molecules deposited over ITO by high vacuum technique (thermal evaporation) a) CB4TA b) C2B4TA c) C2,5B4TA.
3.9. AFM microscopy
Figure 5 shows the interface of donor acceptor molecules deposited on ITO MoO3 and CuI. The findings are in agreement with XRD results. As explained in the XRD section there exist crystalline zones in the internal layers and AFM microscopy confirms that crystallinity tends to decrease with the distance to the buffer layers. The high roughness of all deposits indicates the absence of crystalline zones in the last layers. This result is very important as high roughness allows more contact surface and improves the exiton dissociation. As shown in Figure 5 the roughness variation of the molecular films influences its optical properties, which will influence the final electrical characteristics of the solar cell. In this sense the increase of the Jsc respect to the roughness figure 5 and 6, could be related to a better exciton collection at the p-n junction (interface of electron donor molecules and fullerene) when the molecular surface is smoother producing enhancement of reflectivity of the polymeric film [37].
a b c
Figure 5. a) AFM of CB4TA rms: 9.5 nm b) AFM of C2B4TA rms: 13.4 nm c) AFM C2,5B4TA rms: 12.5 nm
[image:12.595.138.466.524.642.2]
decrease the contact surface with fullerene. Therefore it is desirable that the last layers have no crystalline zones, allowing high roughness and herewith a large contact area [19].
[image:13.595.132.491.164.439.2]3.10. Photovoltaic devices
Figure 6. Photoelectrical behavior of OPVCs and cell parameters
Figure 6 shows the behavior of OPVC under solar simulation. The curves for current density (Jsc) and potential (V) confirm that the OPVC using CB4TA has a poor photovoltaic yield and is not useful as solar cell. However in presence of nitro-groups in C2B4TA and C2,5B4TA the photovoltaic yield increases to 2%. The energy level of LUMO decreases which allows the exited electrons (exitons) to pass from HOMO to LUMO more easily and the OPVC can use lower energy photons.
Polarization of the molecule by nitro groups increases molilitiy of the exitions and also intermolecular charge transfer. Transition speed and hole-charge separation are important to prevent exciton quenching [40]. We have shown that use of MoO3 as buffer layer produces band matching between the HOMO of the first layers of deposits and the HOMO of anode (ITO) [11,19]. In other words MoO3 approximates the HOMO energy of both, anode and the first molecular layers and this facilitates charge movement to the anode.
the organic films. Therefore a decrease of this resistance (Rs and Rsh) induces higher short circuit current density and therefore better photovoltaic yield.
4. CONCLUSIONS
The molecules studied in this manuscript have donor and acceptor moieties, separated by a bridge of three of thiophene subunits. This structure produces polarization in the molecule due to charge diference between electron donating and electron withdrawing functional groups. The introduction of nitro groups increases the polarization atracting negative charges and facilitating the movement of excitons. Accordingly, molecules bearing nitro groups show a photovoltaic yield close to 2% while the same structure without nitro groups shows a photovoltaic yield not suitable for use as OPVC. This fact shows how nitro groups and possibly other electron withdrawing groups can facilitate the movement of excitons decreasing the probability of quenching in OPVC. Thus chemical modifications with electron acceptor groups of molecules with poor photovoltaic behavior tends to decreases the LUMO energy level. Thus the molecules can act as electron donors in OPVCs.
On the other hand thin of electron donor films can interact with CuI as shown XRD data, forming areas of crystallinity, which facilitate the movement of excitons and charges. Using AFM one can observe the high roughness at the interface between the thin layer of electron donor molecules and the fullerene as electron acceptor.
The introduction of nitro groups and other electron acceptors should produce similar effects on other families of molecules. Thus electron withdrawing groups should be taken into account when looking for strategies to improve photovoltaic yields for different substrates in their application in OPVCs.
ACKNOWLEDGEMENTS
The authors wish to thank Fondecyt-Chile through Grant 24110046, and metallurgy department of University of Atacama for XRD measurements.
References
1. S. Bhadra, N. Singha, D. Khastgir, Eur. Polym. J, 44 (2008) 1763. 2. Z. Liu, W. Guo, D. Fu, W. Chen, Synth. Met, 156 (2006) 414. 3. J. Gao, J. M. Sansinena, H. L. Wang, Synth. Met, 135 (2003) 809. 4. A. Bishop, P. Gouma, Rev. Adv. Mater. Sci, 10 (2005) 209.
5. G. R. Hutchison, M.A. Ratner and T.J. Marks, J. Am. Chem. Soc, 127 (2005) 16866.
6. M. Granström, K. Petrisch, A. C. Arias, A. Lux, M. R. Andersson, R. H. Friend, Nature, 395 (1998) 257.
7. H. Hoppe, N. S. Sariciftci, J. Mater. Res, 19 (2004) 1924.
8. T. Otsubo, Y. Aso, K. Takimiya, Bull. Chem. Soc. Jpn., 74 (2001) 1789.
9. A. Salomon, D. Cahen, S. Lindsay, J. Tomfohr, V. B. Engelkes, C. D. Frisbie, Adv. Mater, 2 (2003) 1881.
11. L. Cattin, J.C. Bernede, Y. Lare. S. Dabos-Seignon, N. Stephant, M. Morsli, P.P Zamora, F.R. Diaz, M. A del Valle, Phys. Status. Solidi, (2013) 1.
12. R. Noriega, J. Rivnay, K. Vandewal, F.Koch, N. Stingelin, P. Smith, M.Toney and A. Salleo, Nature Materials, 12 (2013) 1038.
13. J. Garnier, A. Bouteville, J. Hamilton, M. E. Pemble, and I. M. Povey, Thin Solid Films, 518, (2009) 1129.
14. F. Dahou, L. Cattin, J. Garnier, J. Ouerfelli, G. Louarn, A. Bouteville, A. Khelil, and J. C. Bernede, Thin Solid Films 518, (2010) 6117.
15. V. Bavastrello, S. Carrara, Langmuir, 20 (2004) 969. 16. K. Colladeta, M. Nicolasa, Thin Solid Films, 7 (2004) 451. 17. W. Feng, Z. Qi, Y. Sun, J. Appl. Pol. Sci, 104 (2007) 1169.
18. J. Kong, E. Lim, K. Lee, Sol. Energ. Mater. Sol. C, 94 (2010) 2057.
19. P.P. Zamora, M.B. Camarada, I.A. Jessop, Int. J. Electrochem. Sci., 7 (2012) 8276. 20. Y. Berredjem, N. Karst, L. Cattin, Dyes Pigments, 7 (2006) 351.
21. N. Miyaura, T. Ishiyama, H. Sasaki, M. Ishikawa, M. Satoh, A. Suzuki, J. Am. Chem. Soc., 111 (1989), 314.
22. A. E. Thompson, G. Hughes, A. S. Batsanov, M. R. Bryce, P. R. Parry, B. Tarbit, J. Org. Chem., 70 (2005), 388.
23. A. Charasa, J. Morgado, Polymer, 44 (2003) 1843. 24. J. Pei, W. Yu, Macromolecules, 34 (2001) 7241.
25. P. K. Hegde, A. D. V. Adhikari, Synth. Met, 159 (2009) 1099. 26. Q. Zhang, Y. Li, M. Yang, J. Mater. Sci, 39 (2004) 6089.
27. A. Charas, J. Morgado, J. Martinho, L. Alcácer, S. Lim, R. Friend, F. Cacialli, Polymer, 44 (2003) 1843.
28. S. Admassie, O. Inganas, W. Mammo, E. Perzon, M. Andersson, Synth. Met, 156 (2006) 614. 29. P. K. Hegde, A. V. Adhikari, M. G. Manjunatha, C. S. Suchand, R. Philip, Synth. Met, 159 (2009)
1099.
30. E. Zhou, M. Nakamura, T. Nishizawa, Y. Zhang, Q. Wei, K. Tajima, C. Yang, K. Hashimato. Macromolecules, 41 (2008) 8302.
31. M. JuCho, J. Seo, Sol. Energ. Mater, 98 (2012) 71.
32. C. Gaupp, K. Zong, P. Schottland, B. Thompson, C. A. Thomas, and J. Reynolds, Macromol., 33 (2000) 1132.
33. H.J. Ahonen, J. Lukkari, and J. Kankare, Macromolecules, 33 (2000) 6787.
34. P.P. Zamora, M.B. Camarada, I.A. Jessop, F. R. Díaz, M.A. del Valle, L. Cattin, G. Louarn and J.C Bernede, Natural Resources, 4 (2013) 123.
35. S. Lonana, S. Khanna, A. Castineiras, G. Hundal, Z. Arong, Allgemiene Chemie, 636 (2010) 454. 36. A.Gallego, O. Castillo, C.J. Gomez-García, F. Zamora, S. Delgado, Inorganic Chemistry, 51
(2012) 718
37. T. S. Lobana, S. Khanna, A. Castineiras, G. Hundal and Z. Anorg, Allgemeine Chemie, 636, (2010) 454.
38. S. Hayashi, N. Nishioka, H. Nishiyama, T. Koizumi, Synthetic Metals, 162 (2012) 1485. 39. H. Detert, E. Sugionon, Synthteic Metals,115 (2000) 89.
40. L. G. C. Rego, B. C. Hames, K. T. Mazon and Jan-Ole Joswig, The journal of physical chemistry C, 118 (2014) 126