This is a repository copy of Haptoglobin expression in human colorectal cancer. White Rose Research Online URL for this paper:
http://eprints.whiterose.ac.uk/143999/ Version: Accepted Version
Article:
Mariño-Crespo, Ó., Cuevas-Álvarez, E., Harding, A.L. et al. (3 more authors) (2019) Haptoglobin expression in human colorectal cancer. Histology and Histopathology. ISSN 0213-3911
10.14670/HH-18-100
© Servicio de Publicaciones, Universidad de Murcia, 2019. This is an author produced version of a paper subsequently published in Histology and Histopathology. Uploaded in accordance with the publisher's self-archiving policy. Article available under the terms of the CC-BY-NC-ND licence (https://creativecommons.org/licenses/by-nc-nd/4.0/).
[email protected] https://eprints.whiterose.ac.uk/
Reuse
This article is distributed under the terms of the Creative Commons Attribution-NonCommercial-NoDerivs (CC BY-NC-ND) licence. This licence only allows you to download this work and share it with others as long as you credit the authors, but you can’t change the article in any way or use it commercially. More
information and the full terms of the licence here: https://creativecommons.org/licenses/
Takedown
If you consider content in White Rose Research Online to be in breach of UK law, please notify us by
H
IST
O
LO
G
Y
AN
D
H
IST
O
PAT
H
O
LO
G
Y
(n
on
-e
di
te
d
ma
nu
scri
pt
)
ONLINE FIRST
This is a provisional PDF only. Copyedited and fully formatted versión will be made available at final publication
This article has been peer reviewed and published immdediately upon acceptance. Articles in “Histology and Histopathology” are listed in Pubmed.
ISSN: 0213-3911 e-ISSN: 1699-5848
Submit your article to this Journal (http://www.hh.um.es/Instructions.htm)
Upregulation of glucose and amino acid transporters in micropapillary carcinoma
Authors: Kanae Nosaka, Karen Makishima, Tomohiko Sakabe, Yohei Yurugi, Makoto Wakahara, Yasuaki Kubouchi, Yasushi Horie and Yoshihisa Umekita
DOI: 10.14670/HH-18-099 Article type: ORIGINAL ARTICLE Accepted: 2019-03-11
H
IST
O
LO
G
Y
AN
D
H
IST
O
PAT
H
O
LO
G
Y
(n
on
-e
di
te
d
ma
nu
scri
pt
)
Upregulation of glucose and amino acid transporters
in micropapillary carcinoma
Kanae Nosaka1,2,*, Karen Makishima2, Tomohiko Sakabe1, Yohei Yurugi3, Makoto
Wakahara3, Yasuaki Kubouchi3, Yasushi Horie2, Yoshihisa Umekita1,2
1
Division of Organ Pathology, Department of Pathology, Faculty of Medicine, Tottori
University, Tottori, Japan
2
Department of Pathology and 3Department of General Thoracic Surgery, Tottori University
Hospital, Tottori, Japan
Running title: Transporters in micropapillary carcinoma
*Corresponding author: Dr. Kanae Nosaka, Division of Organ Pathology, Department of
Pathology, Faculty of Medicine, Tottori University, 86 Nishi-cho, Yonago, Tottori 683-8503,
H
IST
O
LO
G
Y
AN
D
H
IST
O
PAT
H
O
LO
G
Y
(n
on
-e
di
te
d
ma
nu
scri
pt
)
Summary
Micropapillary carcinoma (MPC), a relatively rare histologic carcinoma observed in various
organs, is associated with vascular invasion, nodal metastasis, and poor prognosis. MPC is
different from papillary carcinoma as it has no fibrovascular core and is thus considered
essentially hypovascular. MPCs are known to upregulate glucose transporter 1 (GLUT1) via
the activation of a transcription factor, hypoxia-inducible factor (HIF)-1. Here we evaluated
the expression of nutrient transporters in MPCs to gain a better understanding of the system
used by MPCs to compensate for their intrinsic poor vascularity. We immunohistochemically
evaluated 29 MPCs including breast (n=14), lung (n=8), gastrointestinal tract (n=5), and
urinary tract cancers (n=2) and compared them with non-micropapillary control cancers
(n=32) regarding the expression of amino acid (ASCT1, ASCT2, LAT1, and SNAT1) and
glucose (GLUT1, GLUT2) transporters. Each section was scored by the staining intensity (0Ð
3) multiplied by the occupying area (0Ð10), with a possible range 0Ð30. The average scores of
the MPC and control groups were compared by Student's or Welch's t-test according to the
homoscedasticity. The MPC group showed markedly and significantly higher scores for
ASCT1 (p=0.007), ASCT2 (p=0.001), GLUT1 (p<0.001), and GLUT2 (p<0.001), whereas no
significant between-group difference was observed in the LAT1 and SNAT1 scores. In
conclusion, MPC could be associated with the upregulation of several nutrient transporters,
H
IST
O
LO
G
Y
AN
D
H
IST
O
PAT
H
O
LO
G
Y
(n
on
-e
di
te
d
ma
nu
scri
pt
)
Key words: micropapillary carcinoma, GLUT1, GLUT2, ASCT1, ASCT2, LAT1, SNAT1,
H
IST
O
LO
G
Y
AN
D
H
IST
O
PAT
H
O
LO
G
Y
(n
on
-e
di
te
d
ma
nu
scri
pt
)
Introduction
Since the first report by Luna-MorŽ et al. in 1994, micropapillary carcinoma (MPC) or
micropapillary components in several cancers have been a well-known risk factor for blood
and/or lymph vessel invasion, lymph node metastasis, and mortality (Nagano et al., 2010;
Willis et al., 2014; Lee et al., 2015; Liu et al., 2015).MPCs have been documented in the
breast, the lung, the gastrointestinal (GI) tract, and the urothelial cancers, where the presence
of MPC is nearly always a sign of poor prognosis (Guzińska-Ustymowicz et al., 2014; Zhang
et al., 2015). By definition, an MPC forms delicate papillary tufts devoid of central
fibrovascular cores, which makes these papillary tufts different from "true" papillae with
cores. Micropapillae are occasionally floating in the lacunar-like space in the fibrous stroma
with their apical surfaces outwards; this is known as the "inside-out" growth pattern (Troxell,
2014).
For cancers to progress, vascularity within or around the tumor is thought to be
important, since proliferating cancer cells need large amounts of nutrients (Carmeliet and
Jain, 2000). MPCs are suspected to be always under a condition of poor nutrition and hypoxia
due to their lack of a fibrovascular core (Nagano et al. 2010). However, MPCs are a highly
aggressive cancer, and their massive necrosis is rarely observed. We speculated that MPCs
have evolved some compensatory system(s) against the poor blood and nutrition supply, and
that such compensatory system(s) may contribute to the aggressive behavior and poor
H
IST
O
LO
G
Y
AN
D
H
IST
O
PAT
H
O
LO
G
Y
(n
on
-e
di
te
d
ma
nu
scri
pt
)
Glucose transporter 1 (GLUT1), a major glucose transporter of somatic cells, has been
shown to be upregulated in MPCs via the activation of the transcription factor
hypoxia-inducible factor (HIF)-1 (Nagano et al., 2010; Koh et al., 2017). HIF-1 controls the
angiogenesis and accommodation of various cellular activities to hypoxia (Wang and
Semenza, 1993; Carmeliet and Jain, 2000). GLUT1 is a representative HIF-1 target gene
product. An upregulation of GLUT1 can substantially improve the uptake of glucose, and it
supports energy production via accelerated glycolysis. Proliferating cancer cells also require
building blocks such as amino acids and lipids other than sugar and oxygen, and several
amino acid transporters are known to be upregulated in various cancers (Yanagida et al., 2001;
Fuchs and Bode, 2005; Kaira et al., 2009; Fan et al., 2010).
However, the differences in amino acid transporter expression among different
carcinoma histologic subtypes have not been fully examined. We hypothesized that MPCs
may compensate for their poor vascularity via upregulations of amino acid and sugar
transporters such as alanine/serine/cysteine/threonine transporter 1 (ASCT1), ASCT2, L-type
amino acid transporter 1 (LAT1), sodium-coupled neutral amino acid transporter 1 (SNAT1),
GLUT1, and GLUT2 with more significant augmentation compared to non-MPC cancers,
H
IST
O
LO
G
Y
AN
D
H
IST
O
PAT
H
O
LO
G
Y
(n
on
-e
di
te
d
ma
nu
scri
pt
)
Materials and Methods
Case selection
We retrospectively analyzed surgically resected specimens that had been histologically
diagnosed as MPCs or as carcinomas with MPC components at the Department of Pathology,
Tottori University Hospital (Yonago, Japan) during the years 2004Ð2016, regardless of the
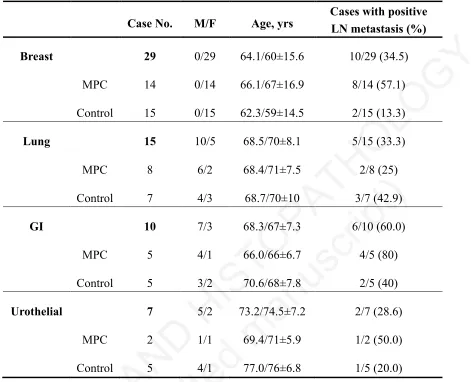
patients' age, sex or tumor stage (Table 1). Small cancers with an invasion diameter <1 cm
and mixed MPC component <10% were excluded. Cases with suspicious antigen
degeneration (e.g., insufficient staining of inner positive controls in an immunohistochemical
procedure) were also excluded. The final total of 29 MPC cases included 14 breast cancers, 8
lung cancers, 5 gastrointestinal (GI) cancers, and 2 urothelial cancers. Five of the breast
cancers were pure MPCs, and the remaining 24 MPCs were mixed cancers with conventional
histological subtypes. We also selected 32 control cases from the above-mentioned organs.
Control cases of lung adenocarcinoma were selected in order to not deviate from the specific
histological subtype.
Written informed consent for their materials to be used was obtained from each patient,
and the study was approved by the Ethics Committee of the Faculty of Medicine, Tottori
H
IST
O
LO
G
Y
AN
D
H
IST
O
PAT
H
O
LO
G
Y
(n
on
-e
di
te
d
ma
nu
scri
pt
)
Immunohistochemistry and scoring
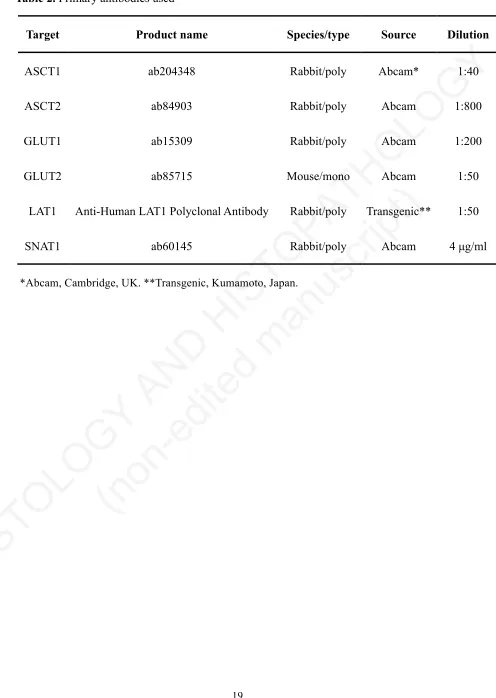
The primary antibodies used in this study are listed in Table 2. The upregulation of all
of the target transporters in cancers has been reported. Paraffin-embedded formalin-fixed
tissue of the cancers were cut into 4-µm slices and placed on silane-coated glass slides. After
being baked at 70 for 30 min, the sections were deparaffinized and hydrated in xylene and a
concentration-gradient ethanol-water system. Endogenous peroxidase activity was quenched
in 30% aqueous H2O2 with methanol (10% v/v). Sections were heated to 95 in pH 6.0 citrate
buffer for 20 min for antigen retrieval, then cooled to room temperature. After blocking with
Block Ace solution (4 g/100 ml; DS Pharma Biomedical, Osaka, Japan), the sections were
incubated with each primary antibody at 4 overnight.
After being washed with phosphate-buffered saline (PBS) containing Tween, the slides
were incubated with secondary antibody (EnVision Dual link system; Dako, Glostrup,
Denmark) for 30 min. Antigen-antibody complex was visualized by a Liquid DAB+ Substrate
Chromogen System (Dako), then counterstained with hematoxylin.
For a quantitative evaluation of the expression of each transporter, every slide was
scored based on its average staining intensity (1: weak, 2: moderate, 3: strong) multiplied by
the positive ratio per tumor area (0: 0%, 1: 1%Ð10%, 2: 11%Ð20%, 3: 21%Ð30%, 4: 31%Ð
40%, 5: 41%Ð50%, 6: 51%Ð60%, 7: 61%Ð70%, 8: 71%Ð80%, 9: 81%Ð90%, 10: 91%Ð100%),
resulting in a score from 0 to 30. For the MPC cases, only the MPC components were
H
IST
O
LO
G
Y
AN
D
H
IST
O
PAT
H
O
LO
G
Y
(n
on
-e
di
te
d
ma
nu
scri
pt
)
pathologists (KN and KM) scored the slides individually, and the similarity of the scores by
the two observers was statistically confirmed. KM was blinded to the purpose of this study
while scoring.
Statistical analyses
We first examined the homoscedasticity of the score distribution in the MPC and
control groups by using the Levine test. If the score distribution was found to be
homoscedastic, the average scores of the MPC versus control cases were compared with
Student's t-test. When the distribution was not homoscedastic, the average scores were
compared with Welch's t-test. The difference was considered significant when p<0.05. The
Statistical Package for Social Sciences ver. 24 (IBM SPSS Statistics; IBM, Armonk, NY) was
used in all statistical analyses.
Results
The staining patterns of the transporters
Representative staining patterns of the respective transporters are shown in Figure 1.
ASCT1 showed a linear staining pattern on the basolateral membrane. Weak to moderate
cytoplasmic staining was often observed. Plasma cells served as inner positive controls.
ASCT2 showed fine granular cytoplasmic staining with faint membranous staining.
H
IST
O
LO
G
Y
AN
D
H
IST
O
PAT
H
O
LO
G
Y
(n
on
-e
di
te
d
ma
nu
scri
pt
)
GLUT1 showed intense membranous staining. Erythrocytes served as inner positive
controls. GLUT2 showed only a finely granular cytoplasmic staining pattern, in contrast to
the membranous staining of hepatocytes in our examination determining the optimal
conditions for staining. LAT1 showed a linear staining pattern along the basolateral
membrane. Vascular smooth muscle cells served as inner positive controls. SNAT1 showed a
coarse granular cytoplasmic staining pattern. In the breast cancers, non-neoplastic ductal
epithelium served as inner positive controls.
The staining scores of the MPC vs. control cases in the respective organs
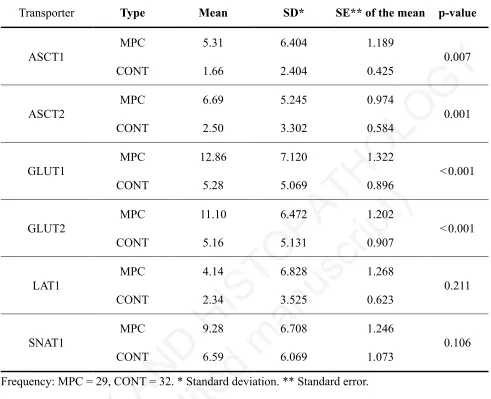
The staining scores of the MPCs and control cases are summarized in Table 3. The
ASCT1, ASCT2, GLUT1, and GLUT2 scores were significantly higher in the MPC group. No
significant difference was revealed in the LAT1 or SNAT1 scores (Fig. 2).
Discussion
GLUT1 upregulation was predictable considering MPCs' intrinsic hypoxia due to a
structural factor. Higher GLUT1 expression in MPCs was histologically confirmed in lung
adenocarcinomas (Nagano et al., 2010; Koh et al., 2017), and a facilitated uptake of
2-18
fluoro-deoxy-D-glucose (18FDG) by lung MPCs on positron emission tomography has also
been reported (Nakamura et al., 2015). Our present findings indicate that the augmented
H
IST
O
LO
G
Y
AN
D
H
IST
O
PAT
H
O
LO
G
Y
(n
on
-e
di
te
d
ma
nu
scri
pt
)
GLUT2 is a glucose and fructose transporter with high capacity and low affinity that is
thought to act as a glucose sensor molecule of hepatocytes and islet β cells of the pancreas.
GLUT2 is also thought to facilitate glucose absorption at the small intestine when the glucose
level is significantly elevated, e.g., after a meal (Mueckler and Thorens, 2013). GLUT2 is also
known to act as a glucosamine transporter (Uldry et al., 2002), but it is unclear whether this
role is beneficial to MPC.Although GLUT2 upregulation in pancreatic and liver cancers is
well known, its overexpression in cancers in extra-hepatobiliary organs has not been well
investigated (Godoy et al., 2006; Kim et al., 2017). It is intriguing that GLUT2 is usually
detected in the cancer cell cytoplasm and not as the membranous staining of normal control
cells such as human hepatocytes. It is reported that insulin internalizes membrane-bound
GLUT2 to the cytosol (Tobin et al., 2008). Whether this membrane-to-cytoplasm translocation
of GLUT2 has some relation to cancer activities remains to be solved.
Several amino acid transporters such as ASCT2 and LAT1 are often upregulated in
cancers (Yanagida et al., 2001; Fuchs and Bode, 2005; Kaira et al., 2009; Fan et al., 2010;
Wang et al., 2013). In fact, in the present study the scores for the ASC transporters (ASCT1,
ASCT2) were markedly higher in the MPC group. ASCT2, a gene product of SLC1A5, is a
member of the ASC system which transports neutral amino acids such as Ala, Ser, Cys, and
glutamine (Fuchs and Bode, 2005). This transporter is thought to be controlled by another
hypoxia-sensing factor (HIF2α) to some extent, via a transduction pathway using lactate as a
H
IST
O
LO
G
Y
AN
D
H
IST
O
PAT
H
O
LO
G
Y
(n
on
-e
di
te
d
ma
nu
scri
pt
)
hypoxic and presumably glycolysis-dependent MPCs.
LAT1 is known to be overexpressed in many cancers (Yanagida et al., 2001; Kaira et
al., 2009; Fan et al., 2010), and its overexpression correlates with worse prognosis. However,
no significant difference in the expression of LAT1 was demonstrated in the present study.
Although SNAT1 is thought to have a critical role in cancers (Wang et al., 2013),no
significant difference in the SNAT1 score was demonstrated herein. These transporters'
overexpression may be related to the cancer activity itself and have no association with MPCs'
structure or their compensatory system.
Our present findings suggest that MPCs can efficiently compensate for their hypoxia
and poor nutrition by upregulating several nutrient transporters, and the hypoxia itself can be
quite beneficial for the MPCs' utilization of nutrients from the environment. In addition, the
cell division of MPCs has been suggested to be less active compared to other histological
subtypes (Ishii et al., 2011; Zhang et al., 2015), which may make MPCs more "economic,"
enabling them to survive severe conditions until they reach a more suitable field for tumor
growth. However, an immunohistochemical analysis is merely a subjective assessment, and
we examined a relatively small number of cases in the present study. Objective evaluations
using molecular biological approaches with larger collections of MPC cases are needed.
In conclusion, this is the first study to investigate the difference in the metabolic state of
cancers, focusing on MPC, a specific histological subtype. We speculate that respective
H
IST
O
LO
G
Y
AN
D
H
IST
O
PAT
H
O
LO
G
Y
(n
on
-e
di
te
d
ma
nu
scri
pt
)
oxygenation, nutrition, and secondary compensatory systems. Our present findings also
demonstrate an example of cancer cell accommodation to the environment. Closer
investigations of the relationship between histological subtypes and metabolic states will lead
us to a better understanding of complex cancer behavior and more effective anti-cancer
strategies.
Acknowledgements
We thank Dr. Takashi Ohno, Dr. Yoshiteru Kidokoro, and Dr. Taichi Kadonaga (Tottori
University Hospital, Japan) for providing surgical and clinical knowledge. We also thank Ms.
Yuko Urakami for her excellent technical assistance with the pathological specimens'
processing.
Author contributions
KN designed the study. KM and TS conducted the validation analysis. YY and MW reviewed
the cases and provided the clinical information. YK prepared recent specimens for this study.
All pre-2014 cases were diagnosed by YH. KN and YU analyzed the data and wrote the
H
IST
O
LO
G
Y
AN
D
H
IST
O
PAT
H
O
LO
G
Y
(n
on
-e
di
te
d
ma
nu
scri
pt
)
Conflict of interest
The authors confirm that there are no conflicts of interest.
References
Carmeliet P. and Jain R.K. (2000). Angiogenesis in cancer and other diseases. Nature. 407,
249-257.
Fan X., Ross D.D., Arakawa H., Ganapathy V., Tamai I. and Nakanishi T. (2010). Impact of
system L amino acid transporter 1 (LAT1) on proliferation of human ovarian cancer
cells: A possible target for combination therapy with anti-proliferative aminopeptidase
inhibitors. Biochem. Pharmacol. 80, 811-818.
Fuchs B.C. and Bode B.P. (2005). Amino acid transporters ASCT2 and LAT1 in cancer:
Partners in crime? Semin. Cancer. Biol. 15, 254-266.
Godoy A., Ulloa V., Rodr’guez F., Reinicke K., Ya–ez A.J., Garc’a Mde L., Medina R.A.,
Carrasco M., Barberis S., Castro T., Mart’nez F., Koch X., Vera J.C., Poblete M.T.,
Figueroa C.D., Peruzzo B., PŽrez F. and Nualart F. (2006). Differential subcellular
distribution of glucose transporters GLUT1-6 and GLUT9 in human cancer:
Ultrastructural localization of GLUT1 and GLUT5 in breast tumor tissues. J. Cell.
Physiol. 207, 614-627.
Guzińska-Ustymowicz K., Niewiarowska K. and Pryczynicz A. (2014). Invasive
H
IST
O
LO
G
Y
AN
D
H
IST
O
PAT
H
O
LO
G
Y
(n
on
-e
di
te
d
ma
nu
scri
pt
)
tract. World J. Gastroenterol. 20, 4597-4606.
Ishii S., Ohbu M., Toomine Y., Nishimura Y., Hattori M., Yokoyama M., Toyonaga M.,
Kakinuma H. and Matsumoto K. (2011). Immunohistochemical, molecular, and
clinicopathological analyses of urothelial carcinoma, micropapillary variant. Pathol.
Int. 61, 723-730.
Kaira K., Oriuchi N., Imai H., Shimizu K., Yanagitani N., Sunaga N., Hisada T., Ishizuka T.,
Kanai Y., Nakajima T. and Mori M. (2009). Prognostic significance of L-type amino
acid transporter 1 (LAT1) and 4F2 heavy chain (CD98) expression in stage I
pulmonary adenocarcinoma. Lung Cancer. 66, 120-126.
Kim Y.H., Jeong D.C., Pak K., Han M.E., Kim J.Y., Liangwen L., Kim H.J., Kim T.W., Kim
T.H., Hyun D.W. and Oh S.O. (2017). SLC2A2 (GLUT2) as a novel prognostic factor
for hepatocellular carcinoma. Oncotarget. 8, 68381-68392.
Koh Y.W., Lee S.J., Park S.Y. (2017). Differential expression and prognostic significance of
GLUT1 according to histologic type of non-small-cell lung cancer and its association
with volume-dependent parameters. Lung Cancer. 104, 31-37.
Lee G., Lee H.Y., Jeong J.Y., Han J., Cha M.J., Lee K.S., Kim J. and Shim Y.M. (2015).
Clinical impact of minimal micropapillary pattern in invasive lung adenocarcinoma:
prognostic significance and survival outcomes. Am. J. Surg. Pathol. 39, 660-666.
Liu F., Yang M., Li Z., Guo X., Lin Y., Lang R., Shen B., Pringle G., Zhang X. and Fu L.
H
IST
O
LO
G
Y
AN
D
H
IST
O
PAT
H
O
LO
G
Y
(n
on
-e
di
te
d
ma
nu
scri
pt
)
poor prognosis. Breast Cancer Res. Treat. 151, 443-451.
Luna-MorŽ S., Gonzalez B., Acedo C., Rodrigo I. and Luna C. (1994). Invasive
micropapillary carcinoma of the breast. A new special type of invasive mammary
carcinoma. Pathol. Res. Pract. 190, 668-674.
Mueckler M. and Thorens B. (2013). The SLC2 (GLUT) family of membrane transporters.
Mol. Aspects Med. 34, 121-138.
Nagano T., Ishii G., Nagai K., Ito T, Kawase A., Takahashi K., Nishimura Y., Nishiwaki Y.
and Ochiai A. (2010). Structural and biological properties of a papillary component
generating a micropapillary component in lung adenocarcinoma. Lung Cancer. 67,
282-289.
Nakamura H., Saji H., Shinmyo T., Tagaya R., Kurimoto N., Koizumi H. and Takagi M.
(2015). Close association of IASLC/ATS/ERS lung adenocarcinoma subtypes with
glucose-uptake in positron emission tomography. Lung Cancer. 87, 28-33.
PŽrez-Escuredo J., Dadhich R.K., Dhup S., Cacace A., Van HŽe V.F., De Saedeleer C.J.,
Sboarina M., Rodriguez F., Fontenille M.J., Brisson L., Porporato P.E. and Sonveaux
P. (2016). Lactate promotes glutamine uptake and metabolism in oxidative cancer cells
Cell Cycle. 15, 72-83.
Tobin V., Le Gall M., Fioramonti X., Stolarczyk E., Blazquez A.G., Klein C., Prigent M.,
Serradas P., Cuif M.H., Magnan C., Leturque A. and Brot-Laroche E. (2008). Insulin
H
IST
O
LO
G
Y
AN
D
H
IST
O
PAT
H
O
LO
G
Y
(n
on
-e
di
te
d
ma
nu
scri
pt
)
Diabetes. 57, 555-562.
Troxell M.L. (2014). Reversed MUC1/EMA polarity in both mucinous and micropapillary
breast carcinoma. Hum. Pathol. 45, 432-434.
Uldry M., Ibberson M., Hosokawa M. and Thorens B. (2002). GLUT2 is a high affinity
glucosamine transporter. FEBS Lett. 524, 199-203.
Wang G.L. and Semenza G.L. (1993). General involvement of hypoxia-inducible factor 1 in
transcriptional response to hypoxia. Proc. Natl. Acad. Sci. USA. 90, 4304-4308.
Wang K., Cao F., Fang W., Hu Y., Chen Y., Ding H. and Yu G. (2013). Activation of
SNAT1/SLC38A1 in human breast cancer: Correlation with p-Akt overexpression.
BMC Cancer. 13, 343.
Willis D.L., Flaig T.W., Hansel D.E., Milowsky M.I., Grubb R.L., Al-Ahmadie H.A., Plimack
E.R., Koppie T.M., McConkey D.J., Dinney C.P., Hoffman V.A., Droller M.J.,
Messing E. and Kamat A.M. (2014). Micropapillary bladder cancer: Current treatment
patterns and review of the literature. Urol. Oncol. 32, 826-832.
Yanagida O., Kanai Y., Chairoungdua A., Kim D.K., Segawa H., Nii T, Cha S.H., Matsuo H.,
Fukushima J., Fukasawa Y., Tani Y., Taketani Y., Uchino H., Kim J.Y., Inatomi J.,
Okayasu I., Miyamoto K., Takeda E., Goya T. and Endou H. (2001). Human L-type
amino acid transporter 1 (LAT1): Characterization of function and expression in tumor
cell lines. Biochim. Biophys. Acta. 1514, 291-302.
H
IST
O
LO
G
Y
AN
D
H
IST
O
PAT
H
O
LO
G
Y
(n
on
-e
di
te
d
ma
nu
scri
pt
)
gastric adenocarcinoma: An aggressive variant associated with poor prognosis. Gastric
H
IST
O
LO
G
Y
AN
D
H
IST
O
PAT
H
O
LO
G
Y
(n
on
-e
di
te
d
ma
nu
scri
[image:20.595.75.546.100.482.2]pt
)
Table 1. Clinicopathological characteristics of the MPC and control cases
Case No. M/F Age, yrs
Cases with positive LN metastasis (%)
Breast 29 0/29 64.1/60±15.6 10/29 (34.5)
MPC 14 0/14 66.1/67±16.9 8/14 (57.1)
Control 15 0/15 62.3/59±14.5 2/15 (13.3)
Lung 15 10/5 68.5/70±8.1 5/15 (33.3)
MPC 8 6/2 68.4/71±7.5 2/8 (25)
Control 7 4/3 68.7/70±10 3/7 (42.9)
GI 10 7/3 68.3/67±7.3 6/10 (60.0)
MPC 5 4/1 66.0/66±6.7 4/5 (80)
Control 5 3/2 70.6/68±7.8 2/5 (40)
Urothelial 7 5/2 73.2/74.5±7.2 2/7 (28.6)
MPC 2 1/1 69.4/71±5.9 1/2 (50.0)
Control 5 4/1 77.0/76±6.8 1/5 (20.0)
GI, gastrointestinal; LN, lymph node; M/F, male/female; MPC, micropapillary carcinoma.
H
IST
O
LO
G
Y
AN
D
H
IST
O
PAT
H
O
LO
G
Y
(n
on
-e
di
te
d
ma
nu
scri
[image:21.595.60.556.91.789.2]pt
)
Table 2. Primary antibodies used
Target Product name Species/type Source Dilution
ASCT1 ab204348 Rabbit/poly Abcam* 1:40
ASCT2 ab84903 Rabbit/poly Abcam 1:800
GLUT1 ab15309 Rabbit/poly Abcam 1:200
GLUT2 ab85715 Mouse/mono Abcam 1:50
LAT1 Anti-Human LAT1 Polyclonal Antibody Rabbit/poly Transgenic** 1:50
SNAT1 ab60145 Rabbit/poly Abcam 4 µg/ml
H
IST
O
LO
G
Y
AN
D
H
IST
O
PAT
H
O
LO
G
Y
(n
on
-e
di
te
d
ma
nu
scri
[image:22.595.70.561.92.491.2]pt
)
Table 3. Comparison of respective transporters' scores in the MPC and control cases
Transporter Type Mean SD* SE** of the mean p-value
ASCT1
MPC 5.31 6.404 1.189
0.007 CONT 1.66 2.404 0.425
ASCT2
MPC 6.69 5.245 0.974
0.001 CONT 2.50 3.302 0.584
GLUT1
MPC 12.86 7.120 1.322
<0.001 CONT 5.28 5.069 0.896
GLUT2
MPC 11.10 6.472 1.202
<0.001 CONT 5.16 5.131 0.907
LAT1
MPC 4.14 6.828 1.268
0.211 CONT 2.34 3.525 0.623
SNAT1
MPC 9.28 6.708 1.246
0.106 CONT 6.59 6.069 1.073
H
IST
O
LO
G
Y
AN
D
H
IST
O
PAT
H
O
LO
G
Y
(n
on
-e
di
te
d
ma
nu
scri
pt
)
Figure Legends
Fig. 1. The staining patterns of the transporters. Invasive MPCs with positive staining are shown
(original magnification; 400⋅, scale bar = 40 µm). a: ASCT1: Linear staining along the basolateral
membrane and faint cytoplasmic stain. b: ASCT2: Faint granular cytoplasmic stain. c: GLUT1:
Intense membranous stain. d: GLUT2: Fine granular cytoplasmic stain. e: LAT1: Linear basolateral
membranous stain. f: SNAT1: Coarse granular cytoplasmic stain.
Fig. 2. Comparison of transporter scores of the MPCs and non-MPCs. The average transporter score
of each group was compared using Student's t-test or Welch's t-test, according to the