Int. J. Electrochem. Sci., 9 (2014) 4257 - 4267
International Journal of
ELECTROCHEMICAL
SCIENCE
www.electrochemsci.orgA Study of Transient Phase Transformation in LFS/C using
in-situ Time Resolved X-ray Absorption Spectroscopy
Onlamee Kamon-in1, Sunisa Buakeaw2, Wantana Klysubun3,Wanwisa Limphirat3, Sutham Srilomsak1,4 and Nonglak Meethong5,6,7,*
1
School of Ceramic Engineering, Suranaree University of Technology, Nakhon Ratchasima, 30000, Thailand
2
Materials Science and Nanotechnology Program, Faculty of Science, Khon Kaen University, Khon Kaen, 40002, Thailand
3
Synchrotron Light Research Institute, Nakhon Ratchasima, 30000, Thailand
4
Nanotec-SUT Center of Excellence on Advanced Functional Nanomaterials, Suranaree University of Technology, Nakhon Ratchasima, 30000, Thailand
5
Department of Physics, Faculty of Science, Khon Kaen University, Khon Kaen, 40002, Thailand
6
Nanotec-KKU Center of Excellence on Advanced Nanomaterials for Energy Production and Storage, Khon Kaen University, Khon Kaen,20004 , Thailand
7
Intregated Nanotechnology Research Center, Khon Kaen University, Khon Kaen, 40002, Thailand
*
E-mail: [email protected]
Received: 24 March 2014 / Accepted: 18 April 2014 / Published: 19 May 2014
Li2FeSiO4 (LFS) is one of the most studied materials for use as cathodes in next generation high
capacity Li-ion batteries. In this work, high purity and nanosized LFS/C material with the monoclinic crystal structure in P21 space group are studied. Structural transformations upon cycling and during relaxation of the high performance LFS/C material are investigated using in situ time resolved X-ray absorption spectroscopy (XAS). Results show that phase transformation involving the present of Fe ion in the Fe4+state when cycling above 4.43 V is responsible for high capacity characteristics in this LFS/C material. The Fe K-edge energy variations during relaxation indicate that local structural and oxidation state of Fe also change. This transient change in local structure of Fe in LFS materials is captured by this technique for the first time.
Keywords: local structure transformation; relaxation; in-situ absorption spectroscopy; Li2FeSiO4
1. INTRODUCTION
researchers around the world to search for new materials for the future batteries [1]. Lithium iron silicate (Li2FeSiO4 or LFS) is one of the materials being investigated for a potential use as a cathode in
the next generation high capacity Li-ion batteries. LFS has a theoretical specific charge capacity of 166 mAh.g-1 by transferring one Li-ion per unit formula from cathode to anode during a charging process [2-3]. However, if enough potential is applied to enable the insertion/extraction of two Li-ions per unit formula, a specific capacity of 332 mAh.g-1[4] is achievable. This material can crystallize in various crystal structures and which structure gives the best electrochemical performance is still being investigated. LFS material was first successfully synthesized by a solid-state reaction at 700ºC and had an orthorhombic crystal structure under the Pmn21 space group [2]. Synthesizing this material at 800ºC using the same method as in [2] resulted in LFS material with a monoclinic crystal structure under P21 and P21/m space groups [5]. LFS preparation by solid-state reactions under an argon atmosphere quenched from 900ºC gave LFS material with an orthorhombic crystal structure under the Pmnb space group [6,7]. Generally, specific discharge capacity prepared in the above mentioned work was around 160 mAh.g-1 indicating that only one Li-ion per formula unit was utilized. Electrode materials prepared by solid state reactions regardless of their crystal structure generally have poor electrical conductivity due to their large particle size. Carbon coating technique and using nanosize materials are two most common approaches to improve this drawback. Carbon coating in LFS material has been done by adding carbon from different sources such as sucrose or carbon black [8], citric acid [9], glucose or pith [10], carbon nanotubes [11], L-ascorbic acid [12] and starch solution [13]. Reduction of particle size or altering shape can also improve the electrochemical performance of LFS material. For example, Lv et al. [14] reported that by synthesizing 40-50 nm LFS material via a solution-polymerization approach, the initial discharge capacity of approximately 220 mAh.g-1 was achieved. Rangappa et al. [15] later reported that an ultrathin nano-sheets of LFS synthesized by a supercritical fluid method exhibited a specific capacity of approximately 340 mAh.g-1when cycled at 45ºC. Both of these work show that more than one Li-ions per formula unit can be extracted from the LFS lattice.
potential to 4.8 V and showed that Fe ion was oxidized continuously during the charging process indicating that LFS undergone two two-phase reactions when the electrode was charged above 4.1 V.
In the current study, the poly (ethylene oxide)- poly (propylene oxide)-poly (ethylene oxide) triblock copolymer (PluronicP-123 ) was used as a carbon source to synthesize nanosize LFS/C material with P21 space group. The LFS/C material is very stable and shows high reversible capacities of more than 200 mAh.g-1 at a current density of C/3 (1C = 166 mA.g-1). Rate capability of this material is also excellent. The local structures of the LFS/C with P21 space group during charging and discharging processes between 1.5-4.8 V during battery operation and during relaxation are investigated by in-situ XAS for the first time.
2. EXPERIMENTAL
2.1 Preparation of LFS/C material
LFS/C material was synthesized by a sol-gel method using lithium acetate dehydrate (98% purity, Acros), iron(III) nitrate nonahydrate (98% purity, Acros), and tetraethyl orthosilicate (TEOS, 98% purity, Acros) as raw materials. The poly (ethylene oxide)- poly (propylene oxide)-poly (ethylene oxide) triblock copolymer (PluronicP-123 ) was used as an effective source of carbon coating as proposed by Xiaozhen et al [19]. During preparation, 1g of PluronicP-123 was dissolved in 20 ml of absolute alcohol under magnetic stirring. Afterward, 0.002 mol of tetra ethyl orthosilicate was added to the solution. Then, a stoichiometric amount of lithium acetate dehydrate and iron(III) nitrate nonahydrate were added to the mixture, respectively. After mixing for 2 hours at room temperature, a clear crimson solution was obtained. The crimson solution was transformed into a wet gel after evaporating off t h e s o l v e n t for 5 hours at room temperature. The wet gel was dried in a vacuum oven at 100 ºC for 24 hours. The precursor was ground and calcined in a quartz tube at 650 ºC for 12 hours under an Ar atmosphere (Grade 5, 99.999% purity).The resulting black powder of LFS/C material was kept in a dry glove box for future use.
2.2 Characterizations of the material
The phase purity and crystal structure of the LFS/C material were determined by X-ray diffraction (XRD) using a Bruker D-2 diffractometer with a Cu-K radiation. Structural parameters
2.3 Electrode preparation and in-situ battery cell
For cathode preparation, the LFS/C material, conductive carbon (superP) and binder (Kynar2801) with a weight ratio of 78:11:11 were thoroughly mixed in a speed mill for 2 hours using N-methyl-2-pyrolidene (NMP) as the solvent. The slurry was casted on aluminum foil, which was used as current collector, with active material loadings of 3-5 mg.cm-2. Finally, the in-situ cell was assembled in a dry and inert Ar filled glovebox using the prepared cathode, micro-porous polymer (Celgard2400) as a separator, lithium ribbons as anode and a liquid solution of LiPF6 electrolyte
containing ethylene carbonate: dimethyl carbonate: diethyl carbonate (EC:DMC:DEC), in a volume ratio of 1:1:1. The electrochemical performance was measured using galvanostatic cycling method, in which various current densities were applied over the voltage range of 1.5-4.8 V at 30 °C.
3. RESULTS AND DISCUSSION
3.1. Crystal structure and morphology of the LFS/C material
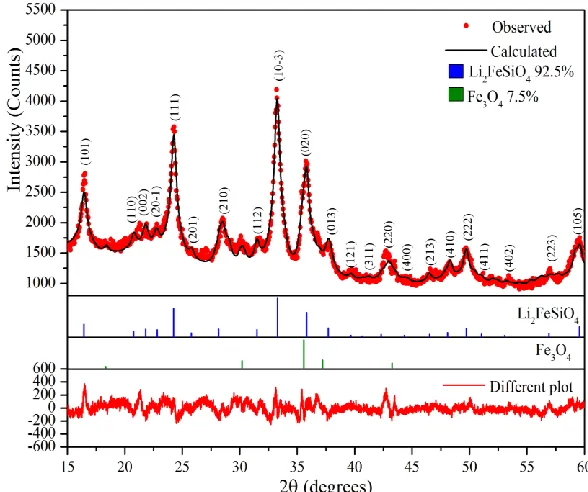
Figure 1. XRD pattern and refinement of the LFS/Cmaterial indexed in the space group P21 which corresponds to the monoclinic structure with a = 8.2504(1) Å, b = 5.0029(5) Å, c = 8.2131(6) Å, beta angle () = 98.56(1), Rwp = 4.57%, Rp = 3.66% and Rexp = 2.75%.
X-ray diffraction pattern of the LFS/C material in Fig. 1 shows that the LFS/C synthesized at 650°C can be indexed on the basis of a monoclinic unit cell in space group P21. This is consistent with a similar product reported by Xiaozhen et al. [19]. Nevertheless, at this temperature, a small amount of Fe3O4 (magnetite) impurity is also present. The lattice parameters of the LFS/C determined from the
[image:4.596.147.441.358.604.2][image:5.596.134.463.199.396.2]
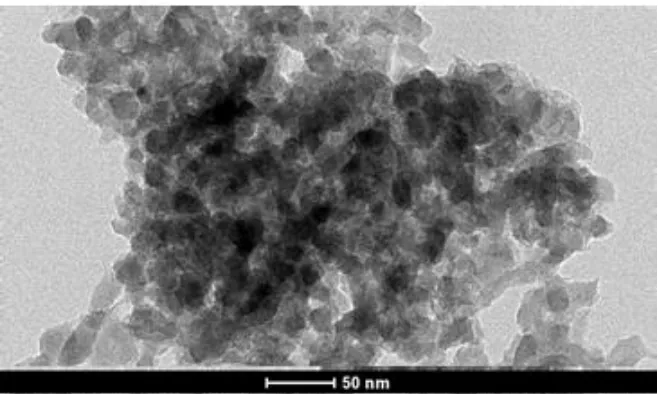
= 5.0029(5) Å, c = 8.2131(6) Å, and beta angle () = 98.56(1). The XRD peaks are quite broad due to the nano-crystalline nature of the material. The crystallite size of the LFS/C powder was calculated using the Scherrer’s equation to be approximately 16 nm. Transmission electron microscopy image as shown in Fig. 2 indicates that the nanoparticles have a round shape with quite narrow particle size distribution. The average particle size is around 15-20 nm, which is consistent with the calculated average crystallite size from XRD.
Figure 2. TEM image of the LFS/C powder
3.2. Electrochemical properties of Li2FeSiO4/C
applications such as in hybrid vehicles than in low rate applications.
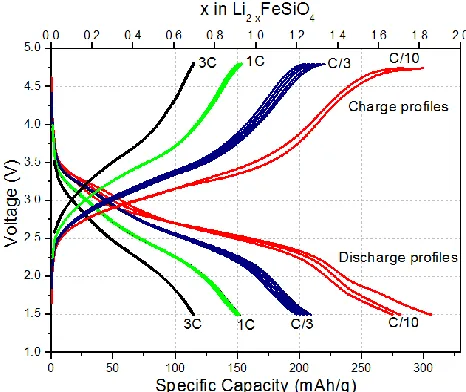
Figure 3. Charge and discharge profiles of the LFS/C cathode measured at various current densities between 1.5-4.8 V (vs. Li+/Li).
Also seen in Fig.3, shape of the charge profiles especially at low current rates apparently shows two distinct regions. The first region at lower voltages shows that the curves have high tangent slopes and should be resulting from phase transformation involving the oxidation of Fe2+ to Fe3+. The second region at higher voltages is relatively flatter and should indicate partial oxidation of Fe3+ to Fe4+. The discharge curves also show two regions with a less obvious distinction, which should be correlated to reduction of Fe-ion to lower oxidation state upon re-insertion of the Li ions back into the LFS structure. The oxidation and reduction peaks are a clear signature of phase transition similar to previous report for high capacity LFS [23].
3.3. Structure transformation during battery operation
[image:6.596.184.417.115.311.2]
and Fe2O3 are used as the references for the K-edge of Fe when the oxidation state is +2 and +3,
respectively.
Figure 4. (a) Charge and discharge profiles of the LFS/C cathode showing the voltages at which in-situ time resolved XAS measurements were conducted. The corresponding in-situ XANES spectra at the Fe K-edge during charge (b) and discharge (c) are shown.
During the charge process, the XANES spectrum obtained when the electrode is charged to 3.14 V has a similar profile as of FeO indicating that the majority of Fe ion has the oxidation state of +2. The spectrum shows a slight peak shift to higher energy resulting from the partial oxidation of the Fe ion to +3 upon Li+ extraction. When we continue charging the electrode to 3.29 V, a significant shift of the XAS profile toward higher energy is observed. This means that the oxidation state of Fe ion continues to increase from 2+ to 3+ upon further extraction of Li+. When we continue charging to higher voltages at 3.53, 3.86 and 4.41 V, the XAS spectra have the K-edge of Fe located between the profiles of FeO and Fe2O3 indicating that the oxidation state of Fe is still between +2 and +3. However,
[image:7.596.78.517.132.508.2]
means that about 19% of Fe2+ has transformed to Fe3+, which is almost 60% difference of the amount of Fe3+ in the material at 4.41V compared to at 3.53 V. This should have resulted in a dramatic shift of the K-edge. The observed results indicate that the shift of the K-edge of Fe observed when voltages ranged from 3.14 to 4.41 V of LFS under the P21 space group has no linear relationship with increasing charge capacity or valence change of the Fe ions. This non-linear relationship has also been reported for LFS under the Pmn21 crystal structure [18]. Upon charging to a higher voltage at 4.48V, the XANES spectrum shifts to higher energy than that of Fe2O3. This suggests that the Fe ion with a
high valence of +4 is formed. Note that the formation of Fe4+ in our LFS/C with P21 space group occurs at much higher voltages compared to the LFS with Pmn21 crystal structure observed in [18] which shows the presence of Fe4+ above 4.1V. The origin of this difference is still unclear but should be related to different ions arrangement in the crystal structure.
During the discharging process, the XANES spectra were obtained when the electrode were discharged to 2.55, 2.46, 2.20, 2.04, and 1.55 V as shown in Fig. 4 (c). In general, the results show the opposite trend of the shift of the K-edge compared to the results during the charging process, i.e. all the spectra shift to lower energy upon discharging as the Li ions are inserted back into the structure. This indicates that the valence of Fe is reduced systematically to +2 according to the degree of Li+ intercalation in the structure. Note that the K-edge shift also shows no linear relationship with the discharge capacity. For example, when the electrode was discharged from 2.55 V to 2.20 V there is no obvious shift of the K-edge. However, the shift is very apparent when the electrode was discharged from 2.20 V to 2.04 V and a minimal shift when the electrode was discharged to 1.55 V.
3.4. Structure transformation during relaxation
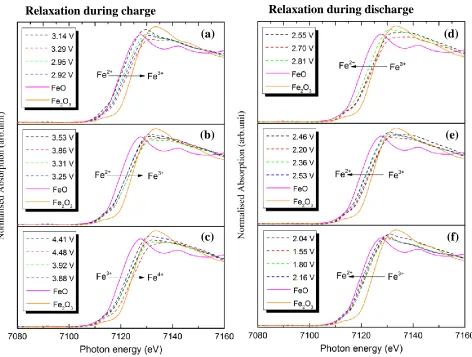
In addition to in-situ time resolved XANES spectra during battery operation, the K-edge of Fe spectra of the LFS/C cathode were also collected during relaxation as shown in Fig. 5. To obtain these data, the electrode was charged or discharged to a specific voltage and allowed to relax. Several XANES spectra were collected during each relaxation and two spectra at each period are chosen to show the local structure change during relaxation. The spectra as shown in Fig. 5a were obtained at the voltages of 2.95 and 2.92 V after the electrode was charged to 3.29 V and allowed to relax. The results show that the K-edge also shifts to lower energy upon relaxation. Similar observations are also evident for the spectra obtained during relaxation after charging to 3.86 V (Fig. 5b) and 4.48 V (Fig. 5c). The Fe K-edge XANES spectra collected at 2.70 V and 2.81 V after the electrode was discharged to 2.55 V (Fig. 5d) obviously show the peak shift to lower energy. The Fe XANES spectra show a lesser but still obvious shift of the peak for the relaxation at 2.36 V and 2.53V after the electrode was discharged to 2.20 V as shown in Fig. 5e. A similar result is obtained for the relaxation at 1.80V and 2.16V after the electrode was discharged to 1.55 V as shown in Fig. 5f as well. To the best of our knowledge, these observations have not been reported before.
[image:9.596.68.540.123.480.2]
that lattice parameters b of both FP and LFP phases within the two-phase reaction region dynamically decrease upon high rate cycling.
Figure 5. Normalized and calibrated Fe K-edge XANES spectra including the spectra obtained during relaxation at different voltages measured during the charge process (left panels) and the discharge process (right panels).
An analytical technique of XAS data, XANES difference, has been used to demonstrate that the shift of the Fe K-edge has been primarily correlated with the change of Fe-O bond lengths during transient phase change in olivine cathode materials [24]. For the LFS/C cathode, it may be possible that during charging and discharging, an extraction or insertion of Li ion from the structure results in an expansion or contraction of Fe-O bonds. After charging or discharging the Fe-O bond-length gradually changes and the structure eventually relaxes to an equilibrium state resulting in a shift of the Fe K-edge. This shows that the time-resolved XAS experiments can capture the transient changes in local structure of the LFS/C material, which has not been reported before.
4. CONCLUSIONS
Nanoscale high capacity LFS/C material with monoclinic crystal structure in space group (a)
(b)
(c)
(d)
(e)
P21has been synthesized by sol-gel method using tri-block copolymer P123 as carbon source. Structural transformation during charging and discharging processes has been studied by in-situtime resolved XAS and the transformation of iron in the 3+ to 4+ state is responsible for high capacity of this material when charging above 4.43 V. In-situ time-resolved XAS experiment involves fast data collection of a second which permits us to be able to monitor fast structural and local transformation that may have been missed previously by other methods. During relaxation, the XANES spectra show a shift of the Fe K-edge energy (E0) which indicates a possible variation of oxidation states or
rearrangement of the ions in the structure.
ACKNOWLEDGEMENT
This work has partially been supported by the Nanotechnology Center (NANOTEC), NSTDA, Ministry of Science and Technology, Thailand, through its program of Center of Excellence Network. O.K. acknowledges support by Synchrotron Light Research Institute Scholarship GS-53-D03. W.L. acknowledges support by the Thailand Research Fund (TRF) under the TRF Senior Research Scholar, Grant No. RTA 5680008. N.M. also acknowledges support by the TRF, Grant No. MRG 5380035. References
1. M. Armand and J. M. Tarascon, Nature, 451 (2008) 652-657
2. A. Nyten, A. Abouimrane, M. Armand, T. Gustafsson, J.O. Thomas, Electrochem. Commun.,7(2005)156-160
3. S. Zhang, C. Deng, S. Yang, Electrochem. Solid-State Lett., 12 (2009) A136-A139
4. Z.L. Gong,Y.X.Li, G.N. He, J. Li, Y.Yang, Electrochem. Solid-State Lett., 11(2008)A60-A63 5. S.I. Nishimura, S.Hayase, R.Kanno, M.Yashima, N.Nakayama, A.Yamada, J. Am. Chem. Soc.,
130(2008)13212-13213
6. C.Sirisopanapon, B. Adrien, H. DarKo, R. Dominko, B. Bojan, A.R. Armstrong, P.G.Bruce, C.Masquelier, Inor. Chem., 49 (2010) 7446-7451
7. O. Kamon-in, W.Klysubun, W.Limphirat, S.Srilomsak, N.Meethong, Physica B, 416 (2013) 69–75 8. H. Guo, K. Xiang, X. Cao, X. Li, Z. Wang, L. Li, Transactions of Nonferrous Metals Society of
China, 19 (2009) 166-169
9. C. Deng, S. Zhang, B.L. Fu, S.Y. Yang, L. Ma, Mater. Chem. and Phys., 120 (2010) 14-17 10.X. Huang, X. Li, H. Wang, Z. Pan, M. Qu, Z. Yu, Solid State Ionics, 181 (2010) 1451-1455 11.X. Huang, X. Li, H. Wang, Z. Pan, M. Qu, Z. Yu, Electrochem. Acta, 55 (2010) 7362-7366 12.Z. Yan, S. Cai, L. Miao, A. Zhou, Y. Zhao, J. Alloys and Compounds, 511 (2012) 101-106 13.H. Zhou, M.A. Einarsrud, V.B. Fride, Solid State Ionics,225 (2012) 585-589
14.D. Lv, W. Wen, H. Xingkang, B. Jingyu, M. Jinxiao,W. Shunqing, Y.Yong, J. Mater. Chem., 21(2011) 9506-9512
15.D. Rangappa, K.D. Murakannahally, T. Tomai, A. Unemato, T. Honma, Nano Lett., 12 (2012) 1146-1151
16.A. Deb, U. Bergman, S.P. Cramer, E.J. Cairns, Electrochim. Acta, 50 (2005) 5200-5207 17.R.Dominko,I. Arcon, A. Kodre, D. Hanzel, M. Gaberscek, J. Power Sources, 189(2009)51-58 18.D. Lv, B. Jingyu, Z. Peng, W. Shunqing, L. Yixiao, W. Wen, J. Zheng, M. Jinxiao, Z. Zizhong, Y.
Yong, Chem. Mater. , 25 (2013) 2014-2020
19.W. Xiaozhen, J. Xin, H. Qisheng, Z. Youxiang, Electrochem. Acta, 80 (2012) 50-55
and P. Songsiriritthigul, J. Synch. Rad., 19 (2012)937-943 22.B. Ravel and M.Newville, J. Synchr. Rad., 12(2005)537-541
23.Z. Yi, L. JiaXin, W. Ning, W. Chuxin, D. Yunhai, G. Lunhui, J. Mater. Chem., 22 (2012) 18797-18800
24.Y. Orikasa, T. Maeda, Y. Koyama, H. Murayama, K. Fukuda, H. Tanida, H. Arai, E. Matsubara, Y. Uchimoto, Z. Ogumi, Chem. Mater., 25 (2013) 1032-1039