www.parliament.uk/commons-library | intranet.parliament.uk/commons-library | papers@parliament.uk | @commonslibrary
BRIEFING PAPER
Number CBP 07585, 5 April 2017
The Troubled Families
programme (England)
By
Alex Bate
Inside:
1. The Troubled Families programme
2. Impact and outcomes – phase one
3. Impact and outcomes – phase two
4. Similar programmes 5. Devolution of the Troubled
Contents
Summary 3
1. The Troubled Families programme 4
1.1 Pilot programme 4
1.2 Phase One (2012-2015) 5
Identifying troubled families 5
Definitions 5
Payment-by-results 7
How the programme worked in practice 8
1.3 Phase Two (2015-2020) 8
Changes from phase one 9
Focus on worklessness and review of payment-by-results, 2017 10
2. Impact and outcomes – phase one 12
2.1 How ‘troubled’ were the identified families? 12
2.2 How many families were ‘turned around’? 13
2.3 How much money did the programme save? 16
2.4 Independent evaluation of the programme 18
Impact evaluation 18
Economic evaluation 20
Leaked final report, August 2016 20
3. Impact and outcomes – phase two 21
3.1 Changes to the evaluation process 21
3.2 Household characteristics 22
3.3 Outcomes 23
3.4 Service transformation 23
3.5 Economic evaluation 24
4. Similar programmes 25
4.1 Respect programme (2006-2010) 25
4.2 Families with Multiple Problems programme (2011-2015) 26
Relationship to the Troubled Families programme 26
5. Devolution of the Troubled Families programme 28
Summary
Troubled Families is a programme of targeted intervention for families with multiple problems, including crime, anti-social behaviour, truancy, unemployment, mental health problems and domestic abuse.
Local authorities identify ‘troubled families’ in their area and usually assign a key worker to act as a single point of contact. Central Government pays local authorities by results for each family that meet set criteria or move into continuous employment.
£448 million was allocated to the first phase of the programme, which ran from 2012 to 2015. Local authorities worked with around 120,000 families, and ‘turned around’ 99%. However the independent evaluation of the programme found no evidence that the programme had made any significant impact across its key objectives.
The second phase of the Troubled Families programme was launched in 2015, with £920 million allocated to help an additional 400,000 families. The second phase will run until 2020, with annual progress reporting until 2022.
The programme was championed in part as a way to reduce public spending on families who require support from multiple parts of the state. No formal analysis has yet been published on the extent of any savings from the programme as a whole.
1.
The Troubled Families
programme
Summary
• The first phase of the Troubled Families programme ran from 2012 to 2015
• It set a target to work with, and ‘turn around’, families with multiple problems, or help them move into continuous employment
• Problems included crime, anti-social behaviour, truancy and unemployment
• Local authorities ran the programme and received payment-by-results from central Government
• Programme was expanded for 2015-2020 to work with 400,000 additional families
• Second phase targeted additional problems, including domestic violence, health, drug abuse, mental health and children at risk
1.1
Pilot programme
The 2010 Spending Review announced a new Community Budgets programme to be trialled in 16 English local authority areas that would:
Help turn around the lives of families with multiple problems, improving outcomes and reducing costs to welfare and public services. The campaign will be underpinned by local Community Budgets focused on family intervention –enabling a more flexible and integrated approach to delivering the help these families need.1
More details were announced in a subsequent press release. The programme, overseen by the Department for Communities and Local Government (DCLG), would give council areas direct control over several strands of central Government funding from 2011/12, free of the usual conditionality attached to the funding streams. This would then be spent on tackling social problems around families with complex needs.2 The 16 council areas chosen to pilot the programme were: Birmingham, Blackburn with Darwen, Blackpool, Bradford, Essex, Greater Manchester (a group of 10 councils), Hull, Kent, Leicestershire, Lincolnshire, Barnet, Croydon, Islington, Lewisham, Swindon, and a grouped area of
Westminster, Hammersmith and Fulham, Kensington and Chelsea and Wandsworth.3
1 HM Treasury, Spending Review 2010, October 2010
2 More information on the community budget model can be found in the Commons Library briefing paper, Local government: alternative models of service delivery 3 ‘16 areas get 'community budgets' to help the vulnerable’, DCLG press release, 22
1.2
Phase One (2012-2015)
Following the 2011 riots in some parts of England, the then Prime Minister David Cameron set out plans to invest £448 million over the course of the Parliament to turn around the lives of around 120,000 troubled families in England.4 In his speech he cited an estimate that, over the previous year, £9 billion had been spent on these
approximately 120,000 families, due to the multiple interventions they received from different parts of the state.5
Although the new programme would continue to target families with multiple problems, the administration and funding of the new Troubled Families programme was different to that of the Community Budgets pilot, moving instead to a payment-by-results model.
Given the cross-cutting nature of the programme, to target families with multiple problems, DCLG provided 39% of the central Government funding, with five other departments providing the rest (Department for Work & Pensions, Ministry of Justice, Department for Education, Home Office and Department of Health).6
Identifying troubled families
The figure of approximately 120,000 troubled families was an estimated number based on a 2005 survey. DCLG then provided all upper-tier local authorities in England with an indicative number of troubled families in their area, based on population estimates and indices of deprivation and child well-being.
Local authorities were then responsible for identifying their assigned troubled families, based on criteria set out in the financial framework document (see below).
In order to help local authorities identify some of their troubled families, regulations were passed allowing the Department for Work and
Pensions (DWP) to share data on families receiving out-of-work benefits, without informed consent.7
Definitions
The definition of ‘troubled families’ is set out in the financial framework document. This defined ‘troubled families’ as households who:
• Are involved in crime and anti-social behaviour
─ Households with 1 or more under 18-year-old with a proven offence in the last 12 months; AND/ OR
4 The 120,000 figure is based on research from 2005. Further details were published in the Cabinet Office’s, Troubled Families Estimates Explanatory Note
5 Prime Minister’s Office, Troubled families speech, 15 December 2011
6 National Audit Office, Programmes to help families facing multiple challenges, 3 December 2013, HC 878 2013-14
7 The Social Security (Information-sharing in relation to Welfare Services etc.) Regulations 2012, SI 2012/1483
Launched in 2012, the programme initially targeted 120,000 families with multiple problems
Troubled families were defined as those facing problems with crime, anti-social behaviour, truancy and/ or
─ Households where 1 or more member has an anti-social behaviour order, anti-anti-social behaviour injunction, anti-social behaviour contract, or where the family has been subject to a housing-related anti-social behaviour intervention in the last 12 months.
• Have children not in school
─ Has been subject to permanent exclusion; three or more fixed school exclusions across the last 3 consecutive terms; OR
─ Is in a Pupil Referral Unit or alternative provision because they have previously been excluded, or is not on a school roll; AND/ OR
─ A child has had 15% unauthorised absences or more from school across the last 3 consecutive terms. • Have an adult on out-of-work benefits
• Cause high costs to the public purse
─ Local discretion… to add other families.8
Families meeting all three of the non-discretionary criteria (crime and anti-social behaviour, truancy and unemployment) were to be included in the programme automatically. Those that met two of the three criteria could be included where they met discretionary criteria set by the local authority, causing high costs to the public purse.
According to the independent evaluation of phase one, the most common discretionary criteria applied by local authorities were: domestic violence/abuse, child protection, drug/alcohol/substance misuse and mental health problems.9
The aim of the programme was to ‘turn around’ the lives of these families. This would be achieved either when:
• They achieve all 3 of the education and crime/anti-social behaviour measures set out below where relevant:
─ Each child in the family has had fewer than 3 fixed exclusions and less than 15% of unauthorised absences in the last 3 school terms; and
─ A 60% reduction in anti-social behaviour across the family in the last 6 months; and
─ Offending rate by all minors in the family reduced by at least 33% in the last 6 months.; OR
• At least one adult in the family has moved off out-of-work benefits into continuous employment in the last 6 months
These outcomes would lead to payment under the payment-by-results system (see below). There was also some payment if families achieved ‘progress to work’ (volunteering for the Work Programme or attached
8 DCLG, Financial framework for the Troubled Families programme’s payment-by-results scheme for local authorities, 28 March 2012
9 DCLG, National Evaluation of the Troubled Families Programme: Final Synthesis Report, October 2016, p30
Families meeting all three of the crime & anti-social
behaviour, truancy and unemployment criteria were to be included
to European Social Fund provision), but this was not a measure of ‘turning around’ a family.
Payment-by-results
DCLG estimated that the cost of intensive intervention with a family was around £10,000. As part of the Troubled Families programme, it would pay 40% of this (£4,000), in a payment-by-results model, when a family was ‘turned around’ (see above).
The framework document referenced DCLG analysis that existing programmes would have ‘turned around’ one in six families eligible for support, even without the Troubled Families programme, and therefore this 40% would only be paid for five out of every six families helped. Part of the £4,000 would be paid up-front as an ‘attachment fee’, with the rest paid when a family was defined as having been ‘turned
around’. The proportion paid up-front would decrease year on year, to reflect the higher initial set-up costs. The up-front fee made up 80% of payment in 2012/13, 60% in 2013/14 and 40% in 2014/15. Figure 1
shows the payment model for 2012/13.
Figure 1: Troubled Families payment-by-results model, 2012/13
Results for payment would be self-declared by local authorities’ Troubled Families teams. However, DCLG would also carry out ‘spot checks’ to ensure accurate reporting.
How the programme worked in practice
The financial framework did not set out any centrally mandated way in which the Troubled Families programme should be implemented, instead emphasising flexibility for local authorities.
In December 2012, DCLG published Working with Troubled Families: a guide to the evidence and good practice. Looking at what practitioners and families said had worked for them, the guide noted five key factors:
1. A dedicated worker, dedicated to a family 2. Practical ‘hands-on’ support
3. A persistent, assertive and challenging approach
4. Considering the family as a whole – gathering the intelligence 5. Common purpose and agreed action.10
Examples throughout the guide showed that many practitioners based interventions around having a key worker as a single point of contact for the family.
The DWP also provided 150 JobCentre Plus advisers to 94 local authority Troubled Families teams, to offer help in finding work.11
1.3
Phase Two (2015-2020)
The 2013 Spending Round announced that the Troubled Families programme would be expanded to reach an additional 400,000 families, for which £200 million would be allocated in the first year (2015/16).12 It was later confirmed that the programme would run until 2020, with an additional £720 million allocated for the remaining four years.13
Stephen Crossley of the Centre for Crime and Justice Studies (CCJS) criticised the expanded 400,000 figure as a move away from the programme’s initially stated aims:
The new figure of 400,000 more ‘troubled families’ equates to around 6.5 per cent of all families in England, and the substantial discretion offered to local authorities in interpreting and applying the criteria, means that almost any family who comes into contact with, or is referred to, a non-universal service could fall into the category of ‘troubled’.14
Although the programme did not fully start until 2015/16, 113 local authorities signed up as ‘early starters’ in 2014/15 for the expanded programme.
Under measures brought in under the Welfare Reform and Work Act 2016, the Secretary of State for Communities and Local Government is
10 DCLG, Working with Troubled Families: a guide to the evidence and good practice, December 2012
11 HC Deb 10 March 2015 c158
12 HM Treasury, Spending Round 2013, Cm 8639, 26 June 2013 13 PQ 28956 [on Families: Disadvantaged], 3 March 2016
14 CCJS, The Troubled Families Programme: the perfect social policy?, November 2015
required to report annually to Parliament on the progress of the Troubled Families programme.
Changes from phase one
The significant increase in the number of troubled families identified is due to wider inclusion criteria than in phase one. A new financial framework for phase two, Financial framework for the expanded Troubled Families programme, set out the following criteria:
To be eligible for the expanded programme, each family must have at least two of the following six problems:
1. Parents or children involved in crime or anti-social behaviour. 2. Children who have not been attending school regularly. 3. Children who need help: children of all ages, who need help, are identified as in need or are subject to a Child Protection Plan. 4. Adults out of work or at risk of financial exclusion or young people at risk of worklessness.
5. Families affected by domestic violence and abuse. 6. Parents or children with a range of health problems.15
Each of these criteria were more broadly defined than in the first phase of the programme. Local authorities can claim funding for a family when they have:
1. Achieved significant and sustained progress, compared with all their problems at the point of engagement , OR
2. An adult in the family has moved off benefits and into continuous employment.
The terminology of ‘significant and sustained progress or continuous employment’ replaces the ‘turned around’ terminology of phase one (see section 2.2).
Where a local authority, in its work with a family, identifies more problems than were initially suspected, progress must be made against all of these problems to qualify for payment-by-results.
What counts as significant and sustained progress is agreed locally and set out in a Troubled Family Outcome Plan. These plans should follow the 10 principles set out in Annex D of the 2015 framework. Principle 9 looks at ensuring that progress is sustained over a period of time, which was not built into the framework of phase one:
The periods of sustainment for outcomes should be meaningful. These may vary between areas, reflecting local priorities and evidence. However, most areas have set a minimum of six months and the school attendance outcome should be demonstrated across at least three consecutive terms.16
15 DCLG, Financial framework for the expanded Troubled Families programme, March 2015
16 DCLG, Financial framework for the expanded Troubled Families programme, March 2015, Annex D
Families’ success is measured on the basis of “significant or sustained
In October 2016, DCLG produced an overview of the first phase of the programme, which looked at what had been learned for phase two. This included the following information on the payment-by-results model for phase two:
The new programme retains a payment by results element. This is a more modest reward than that offered by the first programme in recognition of there being a broader range of needs likely to be captured through the eligibility criteria for this larger cohort. Local authorities receive an upfront £1,000 attachment fee for each family with whom they agree to work and an £800 results payment for each family with whom they achieved an outcome. Each authority receives an annual Service Transformation Grant (most local authorities receive £200,000 each year) to support local delivery of the programme.17
As with phase one of the programme, results are self-reported by local authorities’ Troubled Families teams. However, the Government’s response to the Public Accounts Committee (PAC) report on the programme noted that additional checks would take place for phase two, compared to previously:
Each local authority is now subject to two spot checks during the lifetime of the programme. The spot checks now include a visit by a Department expert, as well as scrutiny of local authority data systems, and these visits include an interview of local authority keyworkers to assess local practice.18
Focus on worklessness and review of
payment-by-results, 2017
DCLG’s first progress report for the 2015-2020 phase included plans to review the payment-by-results model, so that it could drive service transformation, and also so that it could allow for a greater focus on parental unemployment than at present.
Although the entry criteria for the programme would not be changed, the review proposed asking local authorities to prioritise families experiencing worklessness, as well as parental conflict and serious personal debt. The progress report argued that conflict and debt were two of the main disadvantages associated with worklessness.19
The review was launched alongside the DWP policy paper, Improving Lives: Helping Workless Families, which set out an evidence base for the impact of worklessness and conflict on children. As part of the launch, the DWP announced £30 million of funding over three years for
17 DCLG, The first Troubled Families Programme 2012 to 2015: An overview, October 2016, p19
18 HM Treasury, Treasury Minutes: Government responses on the Committee of Public Accounts on the Twenty Sixth, the Twenty Seventh and the Twenty Ninth to the Thirty Fourth reports from Session 2016-17, March 2017, para 3.2
19 DCLG, Supporting disadvantaged families – Troubled Families Programme 2015-2020: progress so far, 4 April 2017, p23-25
DCLG is looking to prioritise families experiencing
relationship support for families experiencing worklessness, which would be delivered through the troubled families programme.20 Gingerbread, a charity for single parents, criticised the increased focus on worklessness as the root of family problems:
While Gingerbread welcomes the promise of better relationship support across family types, it questions the emphasis on ‘worklessness’ as an overriding obstacle to financial stability. While two-thirds of single parents work, the risk of working single parent families being in poverty sharply increased over the last year, emphasising that employment alone is not a solution to improving life chances. Today’s policy paper doesn’t address structural obstacles facing single parents out of work, such as lack of access to childcare, flexible work and training.21
20 ‘Government to fund relationship support for unemployed families’, The Guardian, 4 April 2017
2.
Impact and outcomes – phase
one
Summary
• DCLG figures show that 99% of the families identified were ‘turned around'
• Government originally estimated the programme saved £1.2 billion of public money
• Some commentators have raised concerns about the accuracy of this figure, and about the impact the programme had on the families it ‘turned around’
• Independent evaluation of Troubled Families found that it had no significant impact across the programme’s key objectives, and could not calculate estimates of savings
2.1
How ‘troubled’ were the identified
families?
The first phase of the Troubled Families programme set out to identify 117,910 families to ‘turn around’ by the end of the Parliament, a figure usually rounded up to 120,000 in DCLG publications. Figures for May 2015 indicated that all 117,910 troubled families had been identified. Some commentators, such as Ruth Levitas from the Poverty and Social Exclusion research project (PSE), criticised the use of the term ‘troubled families’, noting that the families identified for help by the programme were not necessarily the “neighbours from hell” referred to in David Cameron’s 2011 speech:
The ‘120,000 families’ identified in the original SETF (Social Exclusion Task Force) report do indeed have troubles: physical and mental ill-health, poor housing, income poverty, material
deprivation. And, as Ogden Nash said, ‘a trouble is a trouble is a trouble, and it’s twice the trouble when a person is poor’. The leap to treating them as ‘troublesome families’, bears little relation to the original criteria of multiple disadvantage on which the figure is based.22
The CCJS’s analysis of the families helped under the programme also raised concerns about the term ‘troubled families’:
In contrast to the image of ‘troubled families’ as ‘neighbours from hell’ where drug and alcohol addictions, crime and irresponsibility ‘cascade through generations’… the only characteristics shared by the majority of ‘troubled families’ are that they are white, not in work, live in social housing and have at least one household member experiencing poor health, illness and/or a disability. Crime, anti-social behaviour and substance abuse, even at relatively low levels, are all characteristics which relate to small minorities of official ‘troubled families’.23
22 PSE, There may be ‘trouble’ ahead: what we know about those 120,000 ‘troubled’ families, 21 April 2012, Policy response series no. 3
23 CCJS, The Troubled Families Programme: the perfect social policy?, November 2015
Critics argued that the so-called ‘troubled families’ had little in common besides economic
2.2
How many families were ‘turned
around’?
The Government’s target, at the launch of phase one of the Troubled Families programme in 2012, was that 117,910 families would be ‘turned around’ by the end of the 2010-2015 Parliament.
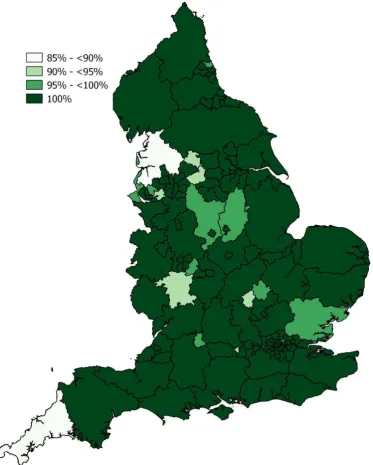
[image:13.595.100.474.279.745.2]Statistics as of May 2015 showed that of the 117,910 families identified, 116,654, or 99%, had been ‘turned around’. Of the 152 local authorities in England, only two, Cornwall and Lancashire, had a success rate of below 90%, whilst 132 had a success rate of 100%.
Figure 1: Percentage of families ‘turned around’ by local authority, to May 2015
The significant majority of families that were ‘turned around’ by the programme were defined as such because of a crime, anti-social behaviour or education outcome, rather than an ‘achieving continuous employment’ outcome (see Chart 1 below).
Chart 1: Outcomes for identified ‘troubled families’, to May 2015
Source: DCLG, Troubled Families: progress information by December 2014 and families turned around by May 2015
The then Communities Secretary Eric Pickles welcomed these results in a statement to the House of Commons in March 2015:
I am genuinely honoured to have led this remarkable, life-changing programme for the Government, and why I am
delighted that it is being expanded to help more troubled families across the country24
In response, the then Shadow Communities Secretary Hilary Benn offered some support for the programme:
We know that intensive support really can help families transform their lives. Raising children can be challenging and we can all do with help and advice at times. We support the programme precisely because the local authorities that are implementing it on the ground are convinced that it makes a difference.25
However, a number of commentators have criticised these results. Jonathan Portes from the National Institute of Economic and Social Research (NIESR) argued that the success rates were so high that they lacked credibility:
CLG told Manchester that it had precisely 2,385 troubled families, and that it was expected to find them and “turn them around”; in return, it would be paid £4,000 per family for doing so.
Amazingly, Manchester did precisely that. Ditto Leeds. And Liverpool. And so on. And CLG is publishing these figures as fact.
24 HC Deb 10 March 2015, c159 25 HC Deb 10 March 2015, c160
104,733
11,921
1,256 0
20,000 40,000 60,000 80,000 100,000 120,000
Families achieving crime/anti-social behaviour/education
result
Families achieving continuous employment
result
Families not turned around
I doubt the North Korean Statistical Office would have the cheek.26
In her evidence to the Public Accounts Committee (PAC), the former Director General of the Troubled Families programme Dame Louise Casey, admitted that the number of families worked with may have been higher than 117,910, in order for local authorities to meet their targets:
It was suggested in the financial framework that local authorities reached more families, although we would not pay them for them, in order both to reach that and as part of a system change. I don’t think they did masses more, but our sense around the country is that people did more in order to meet that.27
Depending on how many more families were worked with, this would have an impact on the reported 99% success rate.
Other commentators, including Lyn Brown MP, argued that in many cases families had been classed as having been ‘turned around’ but had in fact never engaged with the programme in their area, with many still facing problems of crime, unemployment and truancy.28
Stephen Crossley from the CCJS also raised concerns about the use of the term ‘turned around’, particularly that it may not reflect the experience of those actually targeted by the Troubled Families programme:
We do not know how many ‘turned around’ families are still experiencing domestic violence, poor mental health or other issues such as poor quality or overcrowded housing, poverty or material deprivation, because this information has not been reported by the government.
At present, we are also not aware of whether the families consider their lives to have been ‘turned around’ by their
involvement with the programme, or whether their lives remained ‘turned around’ after the intensive support was withdrawn. It should also be noted that many families will not know that they have been labelled as ‘troubled families’ because many local authorities choose not to inform them of this and use different names for their local programmes.29
The 2016 PAC report, Troubled families: progress review, was also critical of the terminology:
The implication of ‘turned around’ was misleading, as the term was only indicative of achieving short-term outcomes under the programme rather than representing long-term, sustainable change in families’ lives. While there was some success, by claiming that an outcome achieved meant that a family had been “turned around”, the Department’s use of the term overstated the impact of the Troubled Families programme.
The use of this term suggested that long term social problems could be fixed within a few months or years, and risks
26 ‘A troubling attitude to statistics’, NIESR policy blog, 15 March 2015
27 Committee of Public Accounts, Troubled families: progress review, 20 December 2016, HC 711 2016-17, Q104
28 HC Deb 30 June 2014, c582
29 CCJS, The Troubled Families Programme: the perfect social policy?, November 2015
undermining the entire concept of this work. The Department should not have used such misleading terminology.30
PAC recommended that DCLG should change the terminology to give “an accurate depiction of how disadvantaged families make
progress.”31 The Government’s response noted that this had already been implemented, with a change in terminology for phase two from ‘turned around’ to ‘significant and sustained progress’:
The current programme recognises that families with multiple problems, some of the hardest to help in the country, will not have their problems resolved overnight and refers to “significant and sustained progress‟ being achieved.32
2.3
How much money did the programme
save?
David Cameron’s 2011 speech highlighted the benefits, not only to those families who would take part in the programme, but also to the public purse:
We’ve always known that these families cost an extraordinary amount of money…
…but now we’ve come up the actual figures.
Last year the state spent an estimated £9 billion on just 120,000 families…
…that is around £75,000 per family.33
Of this £9 billion, Government figures estimated that £8 billion was spent “purely reacting to their (the approximately 120,000 families) problems”.34
Analysis of subsequent DCLG publications by Stephen Crossley of the CCJS raised concerns about the accuracy of this figure. Crossley argued that the £9 billion had been extrapolated from a smaller sample of families with at least five disadvantages and a child with multiple behaviour problems, and that this may not be the case amongst the whole population of the approximately 120,000 families.35 However, a 2014 written statement from the then Communities Secretary Eric Pickles noted that each of the families worked with by that point had an average of nine serious problems.36
Although no target was set for how much money the programme intended to save, DCLG’s original business case estimated a saving of
30 Committee of Public Accounts, Troubled families: progress review, 20 December 2016, HC 711 2016-17, recommendation 5
31 Ibid.
32 HM Treasury, Treasury Minutes: Government responses on the Committee of Public Accounts on the Twenty Sixth, the Twenty Seventh and the Twenty Ninth to the Thirty Fourth reports from Session 2016-17, March 2017, para 4.3
33 Prime Minister’s Office, Troubled families speech, 15 December 2011 34 PQ 7919 [on Families: Disadvantaged], 7 September 2015
35 CCJS, The Troubled Families Programme: the perfect social policy?, November 2015 36 HC Deb 1 September 2014, c5WS
£2.9 billion (later revised down to £2.7 billion).37 Figures were published in March 2015, estimating that £1.2 billion had been saved to date.38 This figure was based on extrapolation of results from seven local authorities, including Manchester, for which it was estimated that for every £1 invested in the programme, £2.20 in benefits were realised.39 When questioned on the difference between the announced £1.2 billion and the initial cost estimate of £9 billion, the then Communities Secretary Eric Pickles gave the following response:
The right hon. Gentleman made a number of points on how we can demonstrate success and square the £1.2 billion with the £9 billion. He knows as well as anybody that this is notoriously difficult territory, because Governments of all types are absolutely terrible at measuring outcomes. We have made a start—he might have had an opportunity to look at the research—by looking at seven exemplar authorities and extrapolating the findings to produce some financial analysis. To answer his questions, I think that it is only fair to have that audited independently. As he will know, we are due to have a very comprehensive audit of the programme.40
In their analysis of the £1.2 billion, Full Fact raised concerns about the quality of the figure:
The £1.2 billion figure doesn't count the cost of the intervention, and it's based on a sample of families from just seven of the 152 local authorities taking part in the scheme.
Most of the seven areas saved about £6,000 to £10,000 per family, but Salford saved £18,000 per family while Staffordshire saved £49,000 per family in the first year of the programme. If the other 145 local authorities are more like the £6,000 or £10,000 regions than Salford or Staffordshire, then the total savings will be much lower than the £1.2 billion figure.
The department says that it thinks the estimate for savings is on the low side. Not all of the savings made are included (for example, they don't have an agreed cost for police call outs), and the councils reporting back didn't collect information on all the services where they could make savings.
Some areas actually ended up spending more per family on things like social services and housing, so some of the services that they didn't have information on might have seen an increase in spending.41
The National Audit Office (NAO) also noted that the estimated figure did not take into account the non-intervention rate (that is, those who would have been ‘turned around’ anyway without the programme).42
37 National Audit Office, Programmes to help families facing multiple challenges, 3 December 2013, HC 878 2013-14
38 ‘More than 105,000 troubled families turned around saving taxpayers an estimated £1.2bn’, DCLG press release, 10 March 2015
39 DCLG, The Benefits of the Troubled Families Programme to the Taxpayer, March 2015
40 HC Deb 10 March 2015, c161
41 ‘£1.2 billion saved? The troubled families programme’, Full Fact, 23 June 2015 42 National Audit Office, Programmes to help families facing multiple challenges, 3
December 2013, HC 878 2013-14
2.4
Independent evaluation of the
programme
An independent, national evaluation of the first phase of the Troubled Families programme was published on 17 October 2016.
The report was originally intended to be published in late 2015, and the 2016 PAC report into the Troubled Families programme was very critical of this delay:
The Department for Communities and Local Government’s delayed publication of the evaluation of the Troubled Families programme was unacceptable.
The Department for Communities and Local Government (the Department)’s evaluation of Troubled Families was originally due to be published in late 2015. However, the Department did not publish it until 17 October 2016, a year later. We requested the evaluation reports on 5 October 2016, but the Department did not provide them to us until they were published on 17 October, just two days before the evidence session. These delays and obfuscation have given a bad impression about the Department’s willingness to be open.43
Impact evaluation
Through analysis of data from 56 local authorities, encompassing around 25% of the 117,910 participants, and through interviews with 495 families, the evaluation found little in the way of significant impact that could be attributed to the programme:
Across a wide range of outcomes, covering the key objectives of the programme - employment, benefit receipt, school attendance, safeguarding and child welfare - we were unable to find
consistent evidence that the Troubled Families Programme had any significant or systematic impact.
That is to say, our analysis found no impact on these outcomes attributable to the programme 12 to 18 months after families joined the programme. The vast majority of impact estimates were statistically insignificant, with a very small number of positive or negative results.44
The only short-term outcome with statistically significant improvements attributable to the programme related to families reporting that they were managing well financially, or managing better than a year ago. However, there were no significant impacts on their self-reported levels of debt.45
Families which had taken part in the programme were also more likely to report knowing how to keep on the right track, being confident that their worst problems were behind them, and feeling positive about the future, when compared with a matched comparison group.46
43 Committee of Public Accounts, Troubled families: progress review, 20 December 2016, HC 711 2016-17, recommendation 1
44 DCLG, National Evaluation of the Troubled Families Programme: Final Synthesis Report, October 2016, p49
45 Ibid., p68 46 Ibid., p68
The evaluation noted that the lack of any significant impact was not necessarily a contradiction with the figures showing 99% of families ‘turned around’ (see section 2.2). This is because the 99% of families are those who achieved set outcomes, whilst the evaluation analysed whether families would have achieved these outcomes in the absence of the Troubled Families programme existing. That is, above and beyond achieving them by themselves or through existing interventions by local authorities.
Concerns were raised in the evaluation about how the payment-by-results model failed to take this into account:
Of course, deadweight is a normal feature of almost all social policy interventions, so in itself this is not a concern. However, the financial framework of the Troubled Families Programme had only limited mechanisms to avoid paying for results not attributable to the programme.
[…]
The financial framework could have been significantly improved if it had followed the model of other programmes, which included a requirement to demonstrate that results were attributable to the programme.47
The evaluation did concede the possibility that the 12 and 18 month evaluation periods were too soon to provide firm conclusions, and recommended repeated analysis after 24 or 36 months.48
Differences in how the programme was implemented by different local authorities were also highlighted, and it was conceded that the
programme may have had statistically significant impacts in some areas, balanced out by negative impacts in other areas:
Averaging effects between local areas may therefore have influenced the impact results at a programme level - that is, in principle it is possible that positive impacts in some areas were obscured by negative impacts elsewhere, so average impacts were not significantly different from zero.49
Although there was no evidence of significant impact across the Troubled Families programme’s core objectives, the evaluation did note other positives. These included:
• Raising the profile of family intervention nationally;
• Boosting local capacity for family intervention;
• Transforming local services and systems, at a time when most local authority budgets were undergoing retraction;
• Improving joint working with Jobcentre Plus at a local level.50
47 Ibid., p75 48 Ibid., p83 49 Ibid., p77 50 Ibid., p68
The evaluation did find evidence of the programme
Economic evaluation
Despite earlier claims by the Government that the programme had saved £1.2 billion (see section 2.3), the evaluation stated that it had not been possible to undertake a full Cost Benefit Analysis.51
The report calculated an estimated fiscal benefit due to the gross reduction in services of around £7,050 per family per year (around £2.11 for every £1 spent). However, this did not consider what the results would have been in the absence of the programme, so fiscal benefits cannot necessarily be attributed to the programme.52 On 19 October 2016, in her evidence to PAC’s inquiry into the
programme, DCLG’s Permanent Secretary Melanie Dawes, stated that “we are certainly not claiming any definitive cost savings from the programme.”53
The final PAC report noted that there had been difficulties in building the cost savings calculator, as it had not always been possible to convince other agencies to release data needed by the DCLG, such as the number of police or ambulance callouts.54
Leaked final report, August 2016
On 8 August 2016, BBC Newsnight reported that it had seen a leaked copy of the final evaluation report, and claimed that the Government had had the final report since autumn 2015.
The copy seen by the BBC reportedly contained similar results to those in the final, published evaluation. Their report quoted a civil service source, which claimed that had the report been positive, it would have already been published. DCLG denied that the report had been
suppressed, stating that:
There were several strands to the evaluation work commissioned by the last government and there is not yet a final report. 55
Melanie Dawes’ subsequent evidence to the PAC inquiry in October 2016 stated that issues with the data provided and difficulties with the data analysis had delayed the publication from its original 2015 target, and the report had been published as soon as had been possible.56
51 Ibid., p10
52 DCLG, Local Authority Data on the Cost and Potential Fiscal Benefits of the Troubled Families Programme, October 2016, p4
53 Committee of Public Accounts, Troubled families: progress review, 20 December 2016, HC 711 2016-17, Q107
54 Ibid., para 24
55 ‘Troubled Families report 'suppressed’’, BBC News, 8 August 2016
56 Committee of Public Accounts, Troubled families: progress review, 20 December 2016, HC 711 2016-17, Qq37-48
The evaluation was unable to
undertake any Cost Benefit Analysis of the Troubled
3.
Impact and outcomes – phase
two
Summary
• DCLG are required to report annually on the progress of the second phase of the programme • Phase two has a more longitudinal evaluation methodology than phase one
• The first annual report shows 46% of the 400,000 families have already been identified and entered onto the programme, with payment-by-results claims made for 13%
• No economic evaluation has yet been published
3.1
Changes to the evaluation process
The 2016 PAC report on the Troubled Families programme criticised the design of the evaluation for phase one, noting that it was unable to directly attribute any significant impact on a range of key measures, despite receiving some evidence of good practice.
As a result, the Committee recommended that DCLG develop a more meaningful, longitudinal methodology for evaluating the impact of phase two, which should also include annual progress reports.57 The Government’s response to the Committee report agreed with this recommendation, and set out a number of changes to the evaluation process for phase two:
• regularly reporting throughout the lifetime of the programme and beyond to 2022;
• measuring over 60 outcome indicators across crime, education, employment, health, domestic abuse and child safeguarding;
• tracking outcomes for up to five years before and after intervention;
• ensuring all participating local authorities have committed to the collection and provision of good quality data; • including rich qualitative information from local authorities
and families describing how the
• programme is being delivered and how changes are experienced by families;
• a survey of over 1,000 families interviewed before and after intervention, capturing improvements in families
circumstances;
• regularly feeding back local findings to councils so they can review family progress, estimate cost-savings and make comparisons with similar councils; and
57 Committee of Public Accounts, Troubled families: progress review, 20 December 2016, HC 711 2016-17, recommendation 2
Significant changes were made to the evaluation
• establishment of an independent advisory group of leading academics to provide external support and scrutiny of the evaluation. 58
DCLG was already required to report annually to Parliament on progress of phase two of the programme, under provisions set out in section 3 of the Welfare Reform and Work Act 2016.
3.2
Household characteristics
The first annual report under the Welfare Reform and Work Act 2016
included a family survey conducted by Ipsos MORI, across 19 local authorities. The same families will be interview again after 24 months to see what impact the programme is having or has had.
In the first family survey publication, the household characteristics of the families participating in the programme were explored:
• The mean household size of ‘troubled families’ (TF) was four, compared to 2.5 nationally;
• 56% of TF were one parent families, compared to 10% nationally;
• 82% of TF rented, compared to 29% nationally, although a higher proportion of TF renters were in social housing than non-TF renters;
• 29% of TF main carers are in employment, compared to 75% nationally;
• 57% of TF households are workless households (no-one aged 16 or over is currently working), compared to 16% nationally;
• With regards to benefits, 78% of TF households receive Child Tax Credit (10% nationally), 31% receive Income Support (3% nationally) and 23% receive Carer’s Allowance (1% nationally);
• 21% of TF main carers said their health was good or excellent, compared to 51% nationally;
• 52% of TF main carers smoke, compared to 19% nationally;
• 25% of TF main carers left school with no formal qualification, compared to 8% nationally;
• 46% of TF households include at least one child with special educational needs, compared to 15% nationally.59
58 HM Treasury, Treasury Minutes: Government responses on the Committee of Public Accounts on the Twenty Sixth, the Twenty Seventh and the Twenty Ninth to the Thirty Fourth reports from Session 2016-17, March 2017, para 2.3
3.3
Outcomes
The results published in the first phase two evaluation report show that nationally, of the 399,960 families funded up to 2020, 46% had been entered onto the Troubled Families programme by December 2016. As of 28 March 2017, local authorities had made claims for 13% of the 399,960 families. 17% of these claims were made for families achieving continuous employment, whilst 83% were for families achieving
significant and sustained progress.
Data is also available at a local authority level and shows significant variations in performance and outcomes. Some noteworthy variations include:
• North Yorkshire has already entered 70% of its allocated families to 2020 onto its programme, whilst the figure for Derby is only 14%.
• North Yorkshire has also already submitted claims for 37% of its allocated families to 2020, whilst Dudley has only claimed for 1% of its allocated families.
• Of the 1,385 claims made by Essex, none of these have been on the basis of continuous employment. 100% have been for significant and sustained progress achievements.
• Other local authorities have relied more heavily on continuous employment. 100% of Wokingham’s claims have been on the basis of continuous employment (although they have made only six claims), and 94% of Coventry’s 264 claims have been on this basis.60
3.4
Service transformation
As well as surveying households to evaluate the impact of the
programme on families, Ipsos MORI is also carrying out staff surveys as part of the evaluation process, to see if and how local authority service provision is being transformed.
This looks in detail at multi-agency working. 54% of Troubled Families keyworkers told the survey that they find it easy to get support from partner organisations, with 15% finding it difficult.
This also varied depending on the agency worked with. Key workers particularly noted that they would like more input from mental health services (almost 60% mentioned this service), housing services and adult services. 85% noted that waiting for health teams to diagnose problems was a barrier to effective partnership working.
62% of keyworkers use accredited programmes such as the DWP Working Programme, Family Nurse Partnerships and the Big Lottery Fund’s Improving Futures as part of their support package.
60 DCLG, Supporting disadvantaged families – Troubled Families Programme 2015-2020: progress so far, 4 April 2017, p49-56
Whilst 84% of keyworkers said they thought the Troubled Families programme was effective at achieving long-term positive change, suggestions for improvement were also made. These included reduced workloads, less paperwork at the expense of contact with families and better data sharing between organisations.61
3.5
Economic evaluation
The evaluation for phase two will include an economic evaluation, which provides a cost benefit analysis.
The analysis will be carried out automatically through the Troubled Families Information System:
1. Local authorities enter the costs of delivering their local interventions via an online information system. Using data collected through the National Impact Study and Family Progress Data the monetised costs families incur on the public sector and wider society (for example, through crime and truancy) is calculated, both before and after the intervention.
2. The system uses the costs of delivering services and attaches unit costs to outcomes to allow local authorities to see how much they are spending on their services and the outcomes and benefits associated with this spend. It also estimates how much public money was saved for each pound spent on interventions, and reports the estimates back to local authorities through an online tool.62
No public cost benefit analysis is yet available.
61 Ipsos MORI, National evaluation of the Troubled Families Programme 2015-2020: service transformation – staff survey: part 1, April 2017
62 DCLG, Supporting disadvantaged families – Troubled Families Programme 2015-2020: progress so far, 4 April 2017, p62
4.
Similar programmes
4.1
Respect programme (2006-2010)
As part of the previous Labour Government’s approach to tackling anti-social behaviour, 2006 saw the launch of the Respect programme. Following six local authority pilot schemes, the programme included family intervention projects (FIPs), which would:
Take a new approach to tackle the behaviour of ‘problem families’ by challenging them to accept support to change their behaviour, backed up by enforcement measures.63
The policy was part of a change in policy emphasis on anti-social behaviour, moving from investment in deprived areas to a more targeted focus on so-called ‘problem families’.64
Similar to the Troubled Families programme, Respect allocated a key worker to co-ordinate with the family and multiple services, and to offer a single point of contact. However, unlike Troubled Families, there was a focus on sanctions for those who did not sufficiently engage with the programme.
There were a number of similarities with the Troubled Families programme, including personnel. The Respect Task Force was led by Louise Casey, who is currently in charge of the Troubled Families Unit in DCLG.
Additionally, like the Troubled Families programme, the Government’s analysis argued that the programme was extremely successful, with significant reductions in anti-social behaviour, truancy and housing enforcement actions.65 Critics similarly argued that poor families were misrepresented as ‘problem families’ and that the statistical basis for the high success rate was questionable.66
In his response to Eric Pickles’ March 2015 statement on the Troubled Families Programme, the then Shadow Communities Secretary Hilary Benn argued that the programme could be directly traced back to the Respect programme:
We on the Opposition Benches support this important work. As the Secretary of State has generously acknowledged, the previous Labour Government started the family intervention project, and a future Labour Government would want to see this work continue and go from strength to strength.67
63 Home Office, Respect Action Plan, 10 January 2006
64 ‘I got it wrong on problem families, admits Blair’, The Telegraph, 28 April 2007 65 Department for Children, Schools and Families, Anti-social behaviour family
intervention projects: monitoring and evaluation, November 2009
66 CCJS, Family intervention projects: a classic case of policy-based evidence, June 2010 67 HC Deb 10 March 2015, c159
4.2
Families with Multiple Problems
programme (2011-2015)
The Families with Multiple Problems programme was launched in December 2011 and funded under the 2007-2013 European Social Fund, with the DWP acting as one of the co-financing organisations. £200 million was provided for the programme from the DWP’s budget. It sought to work with families that faced multiple barriers to work, and the coordinator role could either be carried out by local authorities or private providers. The DWP set a target that 22% of those joining the programme would have moved into employment by March 2015. The final outcomes data was published in October 2015, which showed that 9,130 out of 79,130 participants moved into sustainable
employment, with 3,550 employment outcomes achieved from March 2015 onwards. The DWP calculated the overall job outcome rate for all participants, 18 months after joining the programme, as 11.8%.68 The NAO highlighted concerns about the performance of private contractors in the programme, noting that none met their target for number of families to work with (attachments), with the best performing reaching 74% of the target, and the worst performing reaching only 7%.69
The Public and Commercial Services trade union argued that the contracted private companies were “proving themselves incapable of providing the kind of complex, dedicated support necessary”.70 However, although some local authorities performed better, with one reaching 270% of its attachment target, 105 authorities did not meet the target set for them by the DWP by December 2013.
Relationship to the Troubled Families programme
The Public Accounts Committee (PAC) looked at the DWP programme and the DCLG programme together in its 2014 report, Programmes to help families facing multiple challenges.
The PAC report was critical that the two programmes had both been launched in the same year, targeting similar families and both offering payment-by-results, with little coordination or joint governance
arrangements between DWP and DCLG:
The integration of the programmes at the design phase was poor, leading to confusion, and contributing to the low number of referrals to the DWP’s programme.71
68 DWP, ESF Support for Families with Multiple Problems – December 2011 to August 2015, October 2015
69 National Audit Office, Programmes to help families facing multiple challenges, 3 December 2013, HC 878 2013-14
70 ‘'Catastrophic' back-to-work scheme for families gets just 720 people back to work - out of 88,000’, Mirror, 3 December 2013
71 Public Accounts Committee, Programmes to help families facing multiple challenges, 24 March 2014, HC 688 2013-14
5.
Devolution of the Troubled
Families programme
As part of the Government’s devolution agenda, combined authorities in some areas have chosen to negotiate control over local Troubled Families programmes. So far, only Greater Manchester’s devolution deal has done so:
The government now commits to support Greater Manchester to establish a Life Chances Investment Fund from April 2017, on the basis of a jointly agreed business plan. The government will enable Greater Manchester to bring together funding from the following budget lines into a single pot:
a. Troubled Families Programme, including the service transformation grant and payment by results allocation for Greater Manchester;
b. Working Well pilot; and
c. Cabinet Office Life Chances Fund […]
This commitment is subject to agreement of an appropriate outcomes framework and governance arrangements, and fulfilment of DCLG performance and evaluation requirements in respect of the Troubled Families programme.72
Whilst DCLG will retain oversight of the programme, the ten Greater Manchester borough will be able to pool their Troubled Families funding. The combined authority has a history of pooling its Troubled Families budgets, being only one of two combined council areas among the 16 total council areas participating in the 2011 Community Budgets pilot (see section 1.1).
Greater Manchester’s programme will also incorporate elements of the community budget model, pooling funds from two other related funding streams:
Government and Greater Manchester will jointly establish a Life Chances Investment Fund from April 2017, aligning funding from the Troubled Families Programme, the Working Well pilot and the Cabinet Office Life Chances Fund with local resources to increase investment in innovative approaches to delivering public
resources.73
More information can be found in the Commons Library briefing paper,
Devolution to Local Government in England.74
72 HM Treasury, Further Devolution to Greater Manchester Combined Authority, 16 March 2016
73 Greater Manchester Combined Authority, Budget Announcement: further devolution to Greater Manchester, 18 March 2016
74 House of Commons Library, Devolution to Local Government in England, SN07029, 23 November 2016
Greater Manchester is so far the only combined authority to secure
BRIEFING PAPER
Number CBP 07585, 5 April 2017The House of Commons Library research service provides MPs and their staff with the impartial briefing and evidence base they need to do their work in scrutinising Government, proposing legislation, and supporting constituents. As well as providing MPs with a confidential service we publish open briefing papers, which are available on the Parliament website.
Every effort is made to ensure that the information contained in these publically available research briefings is correct at the time of publication. Readers should be aware however that briefings are not necessarily updated or otherwise amended to reflect subsequent changes.
If you have any comments on our briefings please email papers@parliament.uk. Authors are available to discuss the content of this briefing only with Members and their staff.
If you have any general questions about the work of the House of Commons you can email hcinfo@parliament.uk.
Disclaimer - This information is provided to Members of Parliament in support of their parliamentary duties. It is a general briefing only and should not be relied on as a substitute for specific advice. The House of Commons or the author(s) shall not be liable for any errors or omissions, or for any loss or damage of any kind arising from its use, and may remove, vary or amend any information at any time without prior notice.