
Int. J. Electrochem. Sci., 7 (2012) 77 - 88
International Journal of
ELECTROCHEMICAL
SCIENCE
www.electrochemsci.orgElectrochemical Behavior of bis((E) 3-(2-Nitrophenyl)
Allylidene)Propane-1,2-Diamine as a New Schiff Base and Some
Its New XII Group Complexes
Morteza Montazerozohori1*, Maryam Sedighipoor1 and Shiva Joohari2
1
Department of Chemistry, Yasouj University, Yasouj 75918-74831, Iran
2
Department of Basic Science, Yasouj Branch, Islamic Azad University, Yasouj, Iran
*
E-mail: [email protected]; [email protected]
Received: 13 November 2011 / Accepted: 15 December 2011 / Published: 1 January 2012
Synthesis, spectroscopic and electrochemical properties of some complexes of a new symmetric bidentate Schiff base ligand of bis((E) 3-(2-nitrophenyl)allylidene)propane-1,2-diamine (L) with a general formula of MLX2(M= Cd(II) and Hg(II); X= Cl-, Br-, -I, SCN- and N3-)are reported. The ligand
and its complexes were characterized by elemental analysis, molar conductance, UV-Visible spectra, FT-IR spectra, 1H NMR and 13C NMR spectra. The molar conductance and spectral data indicated that the complexes are molecular and non-electrolyte. The reasonable shifts of FT-IR and NMR spectral peaks of the complexes with respect to the free ligand confirm coordination of ligand and anions(X-). The redox potentials of ligand and its complexes were investigated by electrochemical method using cyclic voltammetry (CV). The results showed the changes in cathodic and anodic potentials of complexes with respect to free ligand. The ligand and complexes exhibited quasi-reversible electron transfer process except about mercury thiocyanate complex that showed reversible redox behavior.
Keywords: Schiff base, Cadmium(II), Mercury(II), Spectroscopic, FT-IR, NMR.
1. INTRODUCTION
presented in literature[10-13]. Recently the electrochemical investigations have been used as useful studies in various aspects because of their sensitivity and relatively short analysis time in comparison with other physicochemical techniques. For example redox potentials can lead to some information on structural features and chemical and biochemical activity [14-16]. Therefore electrochemical behaviors of some Schiff base complexes have been reported [17-19]. To the best of our knowledge, among many other bidentate Schiff base ligands and their complexes of mercury and cadmium and also their electrochemical behaviors has been less paid attention to with respect to other metal ions. In continuation of our previous works[20-22] on synthesis of XII group metal complexes, in this work we wish to report synthesis, characterization and electrochemical behaviors of bis((E) 3-(2-nitrophenyl)allylidene)propane-1,2-diamine (L) as a new bidentate Schiff base ligand and its mercury and cadmium complexes.
2. EXPERIMENTAL
2.1. Materials and methods
3(2-nitrophenyl)-1-propenal, 1,2-propanediamine, cadmium and mercury halides and other chemicals were purchased from Aldrich, Merck or BDH Chemicals. Metal thiocynate and azides were prepared according to our previous report[20]. Solvents were purified and dried before use according to the standard method.
KBr pellets were used for recording of IR spectra in range of the 4000–400 cm-1. UV-Visible spectra were recorded in DMF solutions on a JASCO-V570 spectrophotometer. 1H and 13C NMR spectra were obtained using a Brucker DPX FT-NMR spectrometer at 500 MHz in DMSO-d6. Carbon,
hydrogen and nitrogen of dried samples were performed using an elemental analyzer. BUCHI B-545 melting point instrument was applied for recording of melting points.
Molar conductance of the ligand and their complexes were measured on 10−3 M solutions in DMF at room temperature using Metrohm-712 conductometer with a dip-type conductivity cell made of platinum black. Electrochemical behaviors have been investigated by use of a BHP 2063 Potentiostat Galvanostat instrument.
2.2. Cyclic voltammetry (CV) recording
All experiments were performed in a three electrode cell containing three electrodes; glassy carbon as working, platinium disk as supporting and silver wire as reference electrodes was applied. Scan rate was of V/S. The solvents were dried by CaH2. Voltammetric measurements were performed
at room temperature. For recording of CV, the solutions of 10-3 M of ligand and complexes in dry acetonitrile (ligand, cadmium iodide and mercury complexes) and/or DMF (cadmium chloride, bromide and thiocyanate complexes) as well as tetrabutylammonium hexafluorophosphate as supporting electrolyte were used. All solutions were deoxygenated by passing a stream of pre-purified N2 into the solution for at least 10 Min prior to recording the voltamograms. All chemical potentials
2.3. Synthesis of the Schiff base ligand(L)
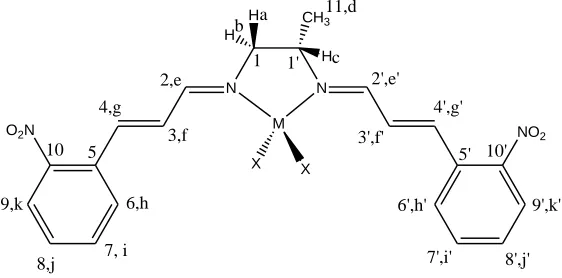
The ligand of bis ((E) 3-(2-nitrophenyl)allylidene) propane -1, 2-diamine was synthesized by condensation of propane-1,2-diamine, (2 mmol) and (E) 3-(2-nitrophenyl)-1-propenal (4 mmol) in absolute methanol (25 mL) under severe stirring for 1.5 hours in an ice both. After completion of the reaction, reaction mixture was poured to cooled water (50 mL). The yellowish white precipitate was filtered and then recrystallized from ethanol to obtain pure ligand in 75%. The Schiff base is soluble in some common organic solvents but not in n-hexane and n-heptane. Some physical, characteristic IR peaks and UV-Visible bands are summarized in Table 1 and 2. The 1H and 13C NMR data of ligand based on figure 1 are as following:
1
HNMR(in DMSO-d6): 8.11(d, 1He J= 8.85Hz), 8.09(d, 1He', J= 8.85Hz), 7.91(d, 2H , J=8.15Hz),
7.79(d, 2Hhh , J= 7.85 Hz), 7.70(t, 2Hi , J= 6.76 Hz), 7.56(t, 2Hj , J= 7.75 Hz and J= 7.70Hz),
7.34(d,2Hg , J= 15.90 Hz), 6.93(dd, 1Hf, J= 15.80 Hz and J= 8.75Hz), 6.92(d, 1Hf , J= 15.80 Hz and J=
8.62Hz), 3.66(bd, 1Hb, J= 7.30Hz), 3.53(m, 2Hac), 1.19(d, 3Hd, J= 5.70Hz) ppm.
13
CNMR(in DMSO-d6): 163.18(C2), 161.14(C2΄), 147.92 (C10,10΄), 135.37(C4), 135.21 (C4΄),
133.49(C9, 9΄), 132.54(C5), 132.40(C5΄), 130.17(C3), 130.11(C3΄), 129.79(C6), 129.17 (C6΄), 128.39(C7, 7΄), 124.42(C8,8΄) 67.27(C1΄), 65.83(C1), 20.37 (C11).
2.4. Synthesis of complexes
The Cd(II) and Hg(II) complexes were prepared by stepwise addition of the ligand (0.5 mmol) in ethanol(10 mL) to cadmium(II) or mercury(II) halide, thiocynate or azide salts(0.5 mmol) in absolute ethanol (5 mL) for 1-2 hours under severe stirring at room temperature. The precipitate of CdLX2 and HgLX2 complexes so obtained were filtered and washed with ethanol twice. The
compounds were recrystallized from dichloromethane/ ethanol mixture(1:1) and dried at (80-100oC) under vacuum and were kept in a desiccator over silica-gel. The color, yield%, microanalysis data, characteristic IR peaks and UV-Visible bands are collected in Table 1 and 2. The 1H and 13C NMR data of complexes based on figure 1 are as following:
-CdLCl2: 1HNMR(in DMSO-d6): 8.32(d, 1He, J= 7.90 Hz), 8.27(d, 1He', J= 8.40 Hz), 8.03(d, 1Hk, J=
7.80 Hz),8.02 (d, 1Hk', J= 8.05 Hz), 7.91(d, 1Hh, J= 7.80 Hz), 7.87(d, 1Hh', J= 7.75 Hz), 7.78 (t, 2Hii',
J= 6.75 Hz and J=6.55 Hz), 7.62 (t, 2Hjj', J=7.65Hz), 7.47(m, 3Hgg'f) } 7.48 (d, 2Hgg', J=15.65 Hz),7.47
(m, 1Hf){, 7.40(dd, 1Hf', J=15.58 and J= 8.28 Hz), 1.18(d, 3Hd, J= 6.45 Hz) ppm. 13CNMR(in
DMSO-d6): 166.27(C2),164.48(C2΄), 148.00(C10), 147.97(C10΄), 137.64(C4), 137.27(C4΄), 133.70(C9),
133.66(C9΄), 131.82(C5), 131.71(C5΄), 130.30(C6,6΄), 130.09(C3), 130.06 (C3΄),128.39(C7), 128.36(C7΄),
124.64(C8), 124.61(C8΄), 65.35(C1), 64.01(C1΄).19.77(C11) ppm.
-CdLBr2: 1HNMR(in DMSO-d6): 8.30(d, 1He, J= 8.60 Hz), 8.26(d, 1He', J= 8.75 Hz), 8.02(d, 2Hkk',
J=8.15Hz),7.90(t, 2Hhh', J= 7.95 Hz and J=8.10 Hz), 7.78(t, 2Hii', J= 7.55Hz and J= 7.65 Hz), 7.62(t,
2Hjj', J= 7.75 Hz and J=7.65 Hz), 7.47(d, 2Hgg', J= 15.75 Hz), 7.40(m, 1Hf),7.32(dd, 1Hf', J=15.80Hz
and J= 8.90 Hz), 3.83(dd, 1Hb, J=11.80 Hz and J=3.30Hz), 3.77 (sixtet, 1Hc, J= 5.65Hz), 3.54 (dd, 1Ha,
147(C10,10΄), 137 (C4,4΄), 133.68(C9), 133.65(C9΄), 131.82(C5), 131.63(C5΄), 130.27(C3,3΄), 130.09(C6,6΄),
128.35(C7), 128.35(C7΄), 124.62(C8), 124.48(C8΄),65.62(C1),64.30(C1΄), 19.89(C11) ppm.
-CdLI2: 1HNMR(in DMSO-d6): 8.30(d, 1He, J= 8.85 Hz), 8.26(d, 1He', J= 8.80 Hz), 8.02(d, 2Hkk',
J=8.10Hz),7.89(d, 2Hhh', J= 7.55 Hz), 7.78(t, 2Hii', J= 7.55 Hz and J=7.70 Hz), 7.62(t, 2Hjj', J= 7.55Hz
and J=7.35 Hz), 7.47 (d, 2Hgg', J= 15.75 Hz), 7.28(dd, 2Hff', J=15.72 Hz and J= 8.87 Hz), 3.83(dd, 1Hb,
J=12.18 Hz and J=3.70Hz), 3.76(sixtet, 1Hc, J=3.70 Hz), 3.54(dd, 1Ha, J= 12.28Hz and J= 5.45 Hz),
1.20(d, 3Hd, J = 6.54Hz) ppm. 13CNMR(in DMSO-d6): 165.64(C2), 163.67(C2΄), 147.94(C10,10΄),
137.33 (C4,4΄), 133.67(C9,9΄), 131.80(C5), 131.63(C5΄), 130.26(C3), 130.23(C3΄), 130.12(C6),
130.08(C6΄), 128.39(C7), 128.32(C7΄), 124.62(C8,8΄), 65.71(C1), 64.41(C1΄), 20.02 (C11) ppm.
-CdL(SCN)2: 1HNMR(in DMSO-d6): 8.33(d, 1He, J= 8.85 Hz), 8.29(d, 1He', J= 8.85 Hz), 8.04(d, 1Hk,
J= 8.15 Hz), 8.03 (d, 1Hk', J= 7.45 Hz), 7.97(d, 2Hhh', J= 7.85 Hz), 7.79(t, 2Hii', J= 7.55 Hz and J=7.60
Hz), 7.64 (t, 2Hjj', J= 7.60 Hz and J= 7.70Hz),7.54(d, 2Hgg', J= 15.80 Hz), 7.39(m, 1Hf), 7.30 (dd, 1Hf',
J=15.85Hz and J=9.00Hz), 3.85(bd, 1Hb, J= 11.70Hz), 3.78(m, 1Hc), 3.50 (dd, 1Ha, J=12.22 Hz and J=
4.65 Hz), 1.15 (d, 3Hd, J=6.55 Hz) ppm. 13CNMR(in DMSO-d6): 166.45(C2), 164.70(C2΄), 148.01(C10),
147.99(C10΄), 138(C4,4΄), 133.89(CSCN), 133.77(C9), 133.74(C9΄), 131.31 (C5), 131.19(C5΄), 129.95(C3),
129.90(C3΄), 128.60(C6, 6΄), 128.59(C7,7΄), 124.64(C8,8΄), 65.23(C1), 63.92(C1΄), 19.60 (C11)
-CdL(N3)2: 1HNMR(in DMSO-d6): 8.31(d, 1He, J= 8.60 Hz), 8.27 (d, 1He', J= 8.80 Hz), 8.02(d, 2Hkk',
J= 8.10 Hz), 7.95(d, 1Hh, J= 4.60 Hz), 7.94(d, 1Hh', J=4.90 Hz), 7.77(t, 2Hii', J= 7.35 Hz and J=7.50
Hz),7.62 (t, 2Hjj', J= 7.75 Hz and J=7.70 Hz), 7.48(d, 2Hgg', J=16.10 Hz), 7.37(dd, 1Hf, J=15.85 Hz and
J=7.65 Hz), 7.31 (dd, 1Hf', J= 15.40 Hz and J=8.90 Hz), 3.84 (bd, 1Hb, J=11.80Hz), 3.74 (m, 1Hc, 3.51
(m, 1Ha), 1.17(d, 3Hd, J=6.40) ppm. 13CNMR(in DMSO-d6): 165.94(C2), 164.07(C2΄), 148.03(C10,10΄),
137.54(C4,4΄), 133.63(C9,9΄), 131.78(C5), 131.62(C5΄), 130.25(C3), 130.23(C3΄), 130.08(C6), 130.06(C6΄),
128.48(C7), 128.44(C7΄), 124.58(C8,8΄), 63.97(C1),63.09(C1΄), 19.56(C11)
-HgLCl2: 1HNMR(in DMSO-d6): 8.58(d, 1He, J= 8.85 Hz), 8.55(d, 1He', J= 9.00Hz), 8.07(d, 1Hk, J=
8.00 Hz), 8.06(d, 1Hk', J= 8.05 Hz), 7.86(d, 2Hhh', J= 8.00 Hz), 7.82(t, 2Hii', J= 7.05 Hz and J= 6.95
Hz), 7.66 (t, 2Hjj', J= 7.20 Hz and J=8.35Hz), 7.65(d, 2Hgg', J= 15.50 Hz), 7.22(dd, 2Hff', J=15.62 Hz
and J= 8.83 Hz), 4.03(m, 1Hc), 3.95(bd, 1Hb, J=13.00 Hz), 3.69(dd, 1Ha, J= 12.95 Hz and J=4.00 ),
1.22(d, 3Hd, J= 6.50) ppm. 13CNMR(in DMSO-d6): 167.93(C2), 165.64(C2΄), 148.01(C10,10΄),
140.30(C4), 140.06(C4΄), 133.89(C9,9΄), 130.77(C5), 130.71(C5΄), 130.52(C3), 130.30(C3΄), 129.84(C6),
129.80 (C6΄), 128.52(C7), 128.48(C7΄), 124.75(C8), 124.73(C8΄) 63.28(C1), 63.10(C1΄), 19.17(C11) ppm. -HgLBr2: 1HNMR(in DMSO-d6): 8.61(d, 1He, J= 8.85 Hz), 8.58 (d, 1He', J= 8.90 Hz), 8.07(d, 2Hkk',
J= 7.00 Hz), 7.82(bs, 4Hhh'ii'), 7.70(d, 1Hg, J= 15.65 Hz), 7.69(d, 1Hg', J= 15.65 Hz) 7.68 (m, 2Hjj'),
7.15 (sixtet, 2Hff'){ 7.16(dd, 2Hf, J= 15.68 Hz, J= 8.90 Hz), 7.14(dd, 1Hf', J= 15.68 Hz and J= 8.90
Hz)}, 4.07 (m, 1Hc), 3.95(bd, 1Hb J=12.95Hz), 3.70(dd, 1Ha, J=13.05Hz and J=3.70Hz), 1.24 (d, 3Hd,
J= 6.50 Hz) ppm. 13CNMR(in DMSO-d6): 167.91(C2), 165.70(C2΄), 147.99(C10,10΄), 140.58(C4),
140.44(C4΄), 133.97(C9,9΄), 130.83(C5), 130.78(C5΄), 130.15(C3), 129.91(C3΄), 129.82(C6), 129.79 (C6΄),
128 (C7,7΄), 124.80(C8,8΄), 64.55(C1), 63.36(C1΄), 19.21(C11) ppm.
-HgLI2: 1HNMR(in DMSO-d6): 8.58(t(2d), 2Hee', J=9.30 Hz and J=10.55 Hz), 8.07(d, 2Hkk', J= 8.05
Hz), 7.82(m, 4Hhh'ii'), 7.70(dd, 1Hg, J=15.75 Hz), 7.69(dd, 1Hg', J= 15.65), 7.67(t, 2Hjj', J= 5.90 Hz and
J= 8.30Hz), 7.14(dd, 1Hf, J= 15.60 Hz and J=8.90 Hz), 7.08(dd, 1Hf', J= 15.52 Hz and J= 8.90 Hz),
Hz) ppm. 13CNMR(in DMSO-d6): 167.57(C2), 165.34(C2΄), 147.98(C10), 147.96(C10΄), 140.50(C4),
140.34(C4΄), 134.02(C9,9΄), 130.85(C5), 130.80(C5΄), 129.86(C3), 129.80(C3΄), 129.60(C6,6΄), 128.30
(C7,7΄), 124.84(C8,8΄), 64.54(C1), 63.34(C1΄), 19.37(C11) ppm.
-HgL(SCN)2: 1HNMR(in DMSO-d6): 8.70(d, 1He, J=8.90 Hz), 8.67(d, 1He', J= 8.95 Hz), 8.07(d, 2Hkk',
J= 8.00 Hz), 7.96(t, 2Hhh', J= 6.90 Hz and J= 6.45 Hz), 7.82(bt, 2Hii', J= 5.10 Hz and J= 7.00 Hz),
7.71(d, 2Hgg', J= 15.65Hz), 7.67(t, 2Hjj', J= 8.15 Hz and J= 7.55 Hz), 7.21(dd, 2Hff', J= 15.45 Hz and J=
8.90 Hz), 4.08 (m, 1Hc), 3.97 (bd, 1Hb, J= 12.90 Hz), 3.74(dd, 1Ha, J= 13.15 Hz and J=3.40 Hz),
1.25(d, 3Hd, J=6.45 Hz) ppm. . 13CNMR(in DMSO-d6): 168.55(C2), 166.45(C2΄), 148.10(C10,10΄),
140.93(C4,4΄), 133.77(C9,C9΄), 130.85 (C5,C5΄), 130.27(C3), 130.05(C3΄), 129.65(C6), 129.64(C6΄),
128.83(C7), 128.76 (C7΄), 124.72(C8,8΄), 117.43(CSCN), 64.83(C1), 62.82(C1΄), 19.12 (C11) ppm.
-HgL(N3)2: 1HNMR(in DMSO-d6): 8.28(d, 1He, J= 8.75 Hz),8.25(d, 1He', J=8.70 Hz), 8.00(d, 2Hkk', J=
8.10 Hz), 7.93(d, 2Hhh', J=7.80 Hz), 7.74(t, 2Hii', J= 7.50 Hz and J= 7.60 Hz), 7.59(t, 2Hjj', J=7.70Hz),
7.44(d, 1Hg, J= 15.75 Hz), 7.43(d, 1Hg', J=15.75 Hz), 7.10(dd, 2Hff', J= 15.75 Hz and J= 8.70 Hz),
3.74(bd, 1Hb, J= 12.00 Hz), 3.70(q, 1Hc, J= 5.70Hz), 3.56(dd, 1Ha, J= 11.82, J= 5.50 Hz) ppm. . 13
CNMR(in DMSO-d6): 164.68(C2), 162.54(C2΄), 147.97(C10,10΄), 136.75(C4), 136.61(C4΄),
133.53(C9,9΄), 131.99(C5), 131.83(C5΄), 130.06(C3), 130.03(C3΄), 128.54 (C6,6΄), 128 (C7,7΄),
124.49(C8,8΄), 64.62(C1), 64.87(C1΄), 19.78(C11) ppm.
3. RESULTS AND DISCUSSION
3.1. Physical and analytical data
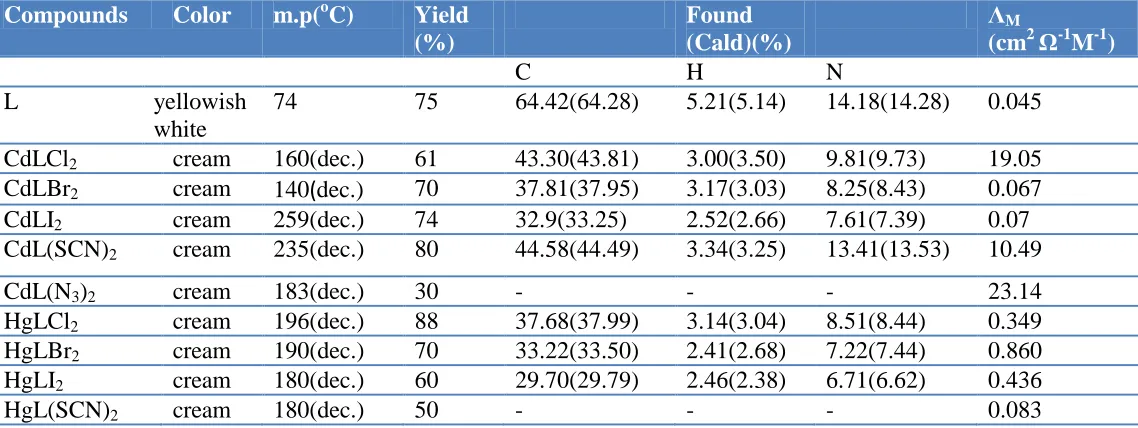
The analytical and physical data of the ligand and its complexes are summarized in Table 1. Analytical data prove the 1:1 metal to ligand for all complexes. All of the isolated complexes are soluble in organic solvents such as chloroform, dichloromethane, dimethylformamide and dimethylsulfoxide and insoluble in alcohols. The ligand melts at 74 oC while the complexes are decomposed in the range of 140-259 oC.
N N
CH3
H H
H
M
X X
a b
c 11,d
2,e 2',e'
3,f 3',f'
6,h 6',h'
7, i 7',i'
8,j 8',j'
9,k 9',k'
NO2 O2N
10 5 5' 10'
4,g 4',g'
[image:5.596.158.439.547.686.2]1 1'
Figure 1. Structural formula of ligand and complexes
The general formula of MLX2 (M= Cd(II) and Hg(II); X= Cl-, Br-, I-, SCN- and N3-) as shown
solvent at room temperature are found to be in the range of 0.067-23.14 cm2 Ω-1M-1 that well suggest molecular identity for all complexes indicating coordination of all ligands to the metal ion in inner sphere coordination space[17, 23].
3.2. FT-IR spectra
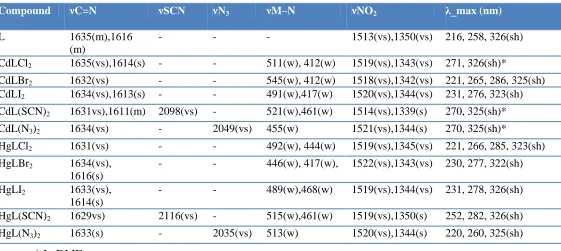
Some characteristic IR peaks of the ligand and its complexes have been presented in the Table 2. The ligand absorption frequencies at 3079, 3022, 2988 and 2828 cm-1 are assigned to C-H aromatic, alkenic, aliphatic and iminic C-H bonds respectively and are slowly affected after coordination. Azomethine groups (C=N) of ligand exhibit to medium peaks at 1635 and 1616 cm–1 can safely attributed to its asymmetric and symmetric stretching vibration respectively [20-22, 24-26]. After coordination, while the intensity of azomethine asymmetric peaks are aromatic, alkenic, aliphatic and iminic C-H bonds respectively and are slowly affected after coordination. Azomethine groups (C=N) of ligand exhibit to medium peaks at 1635 and 1616 aromatic, alkenic, aliphatic and iminic C-H bonds respectively and are slowly affected after coordination. Azomethine groups (C=N) of ligand exhibit to medium peaks at 1635 and 1616 cm–1 can safely attributed to its asymmetric and symmetric stretching vibration respectively [20-22, 24-26]. After coordination, while the intensity of azomethine asymmetric peaks are enhanced and appeared as very strong peak in all complexes IR spectra, they shifted by 1-6 cm-1 to lower energy. On the other hand azomethine symmetric peaks are shifted to higher energy and merged to asymmetric by 13-18 cm-1 or shifted 2-5 cm-1 indicating coordination of azomethine groups to metal ions. In the ligand spectrum, two very strong peaks are seen at 1513 and 1350 cm-1 that may be attributed to asymmetric and symmetric stretching of NO2 groups[27]. Due to
coordination of ligand, the asymmetric and symmetric stretching vibrations are shifted by 6-9 cm-1 and 5-7 to higher and lower wave numbers respectively.
Table 1. Analytical and physical data of the Schiff base ligand (L) and its Cd(II) and Hg (II) complexes.
Compounds Color m.p(oC) Yield
(%)
Found (Cald)(%)
ΛM
(cm2Ω-1M-1)
C H N
L yellowish
white
74 75 64.42(64.28) 5.21(5.14) 14.18(14.28) 0.045 CdLCl2 cream 160(dec.) 61 43.30(43.81) 3.00(3.50) 9.81(9.73) 19.05
CdLBr2 cream 140(dec.) 70 37.81(37.95) 3.17(3.03) 8.25(8.43) 0.067
CdLI2 cream 259(dec.) 74 32.9(33.25) 2.52(2.66) 7.61(7.39) 0.07
CdL(SCN)2 cream 235(dec.) 80 44.58(44.49) 3.34(3.25) 13.41(13.53) 10.49
CdL(N3)2 cream 183(dec.) 30 - - - 23.14
HgLCl2 cream 196(dec.) 88 37.68(37.99) 3.14(3.04) 8.51(8.44) 0.349
HgLBr2 cream 190(dec.) 70 33.22(33.50) 2.41(2.68) 7.22(7.44) 0.860
HgLI2 cream 180(dec.) 60 29.70(29.79) 2.46(2.38) 6.71(6.62) 0.436
[image:6.596.13.582.542.756.2]
The weak absorption frequencies of complexes at 450-550 cm–1 regions may be due to asymmetrical and symmetrical vibration modes of M–N[28] supporting the coordination of two azomethine nitrogens of ligand that is in agreement to molar conductivities results. Coordination of anions to metal ion in this type of complexes is well proved based on thiocyanate and azide complexes IR spectra. The stretching vibration frequencies of uncoordinated thiocyanate and azide ions are at 2049 and 2126 cm–1 respectively. Shift of stretching vibration frequencies of azide and thiocyanate to higher wave number for thiocyanate and to lower wave number respectively with respect to uncoordinated status of them indicate their binding to metal centers. On the other hand, about thiocyanate, mode of coordination also is distinguishable from IR spectra.
Generally appearance of a peak at 2055-2080 cm–1 is assigned to N-coordinated mode and at higher than 2090 cm–1 safely attributed to S-coordinated mode of this ion[29-32]. The results in table 2 confirm coordination of azide ions to metal ion centers. Vibration frequencies of thiocyanate ions at 2098 and 2116 cm-1 respectively at IR spectra of cadmium and mercury complexes certainly suggest S-coordination mode of thiocyanate in these complexes.
3.3. Electronic spectra
[image:7.596.16.577.498.749.2]The ultraviolet-visible spectral data of complexes in CHCl3 or DMF, are summarized in Table2. In ligand spectrum, a bond at 216nm, a shoulder band at 325 nm and a very intensive band at 258 nm are seen that all are attributed to the π-π* transition of aromatic rings, olefin and azomethine groups.
Table 2. Some characteristic vibrational (cm−1) and electronic (nm) spectral data of the Schiff base (L) and its cadmium (II)complexes.
Compound νC=N νSCN νN3 νM–N νNO2 λ_max (nm)
L 1635(m),1616
(m)
- - - 1513(vs),1350(vs) 216, 258, 326(sh)
CdLCl2 1635(vs),1614(s) - - 511(w), 412(w) 1519(vs),1343(vs) 271, 326(sh)*
CdLBr2 1632(vs) - - 545(w), 412(w) 1518(vs),1342(vs) 221, 265, 286, 325(sh)
CdLI2 1634(vs),1613(s) - - 491(w),417(w) 1520(vs),1344(vs) 231, 276, 323(sh)
CdL(SCN)2 1631vs),1611(m) 2098(vs) - 521(w),461(w) 1514(vs),1339(s) 270, 325(sh)*
CdL(N3)2 1634(vs) - 2049(vs) 455(w) 1521(vs),1344(s) 270, 325(sh)*
HgLCl2 1631(vs) - - 492(w), 444(w) 1519(vs),1345(vs) 221, 266, 285, 323(sh)
HgLBr2 1634(vs),
1616(s)
- - 446(w), 417(w), 1522(vs),1343(vs) 230, 277, 322(sh)
HgLI2 1633(vs),
1614(s)
- - 489(w),468(w) 1519(vs),1344(vs) 231, 278, 326(sh)
HgL(SCN)2 1629vs) 2116(vs) - 515(w),461(w) 1519(vs),1350(s) 252, 282, 326(sh)
HgL(N3)2 1633(s) - 2035(vs) 513(w) 1520(vs),1344(s) 220, 260, 325(sh)
As seen in table2, the first band is vanished or combined with intensive bond after coordination in cadmium chloride, thiocyanate and azide complexes. In other complexes, the first band is red shifted by 5-36 nm. The intensive band of ligand well red shifted by 7-36 nm after bounding of ligand to metal center. This obvious red shifting in electronic spectra is due to metal to ligand π- back bounding after coordination in this type of complexes.
3.4. 1H and 13C NMR spectra
The 1H and 13C NMR spectral data of ligand and complexes were recorded in DMSO-d6 as
solvent at 500MHz and their proton and carbon chemical shifts have been presented in experimental section. The NMR spectra of the ligand and its complexes well exhibit proton and carbon signals as expected based on structure in figure 1. The 1H NMR spectrum of the ligand includes the azomethine protons (Hb and Hb׳) resonances as characteristic ones at 8.11 and 8.09 ppm as doublet with the same
coupling constant of 8.85 Hz[33]. These peaks are down fielded to 8.30-8.70 and 8.25-8.67 ppm respectively in the complexes with respect to TMS, supporting well binding of the azomethine groups of ligand to metal ions.
More down fielding of these protons in mercury halide complexes indicates stronger binding of ligand to mercury ion. The aromatic hydrogens(kk' and hh') of the ligands are appeared as a doublet at 7.91 and 7.79 ppm with coupling constants of 7.85 and 6.76 Hz respectively. In complexes, these signals are down fielded to 8.00-8.07 and 7.82-7.96 ppm and also in some cases, kk' and hh' hydrogens are separated from each other.
The aromatic hydrogens(ii' and jj') of ligand are appeared at 7.70 and 7.56 ppm as triplets that shifted to 7.78-7.82 and 7.59-7.68 ppm after coordination respectively. Olefinic hydrogens of gg' of ligand are shown as doublet at 7.34 ppm that down fielded to 7.43-7.71ppm in the complexes. It is to be noted that gg' hydrogens in mercury bromide, iodide and azide complexes are separated and observed as two kinds of doublets at different chemical shifts. Other olefinic hydrogens of ligand, f and f', are seen at 6.93 and 6.92 ppm as two separately doublet of doublets that related signals are shifted to 7.10-7.47 ppm after coordination. Despite of gg' hydrogens, f and f' hydrogens are found to appear at same chemical shifts after binding to metal ion centers.
Aliphatic hydrogens of b, (a, c) and d of the ligand are appeared at 3.66, 3.53 and 1.19 ppm as broad doublet, multiplet and doublet respectively. After coordination, all signals are down fielded and also hydrogens of a and c are obviously being distinguishable from each other. The 13C NMR spectrum of the ligand shows two different azomethine carbons signals at 163.18(C2) and 161.14(C2΄) [30].
3.5. Electrochemical investigation
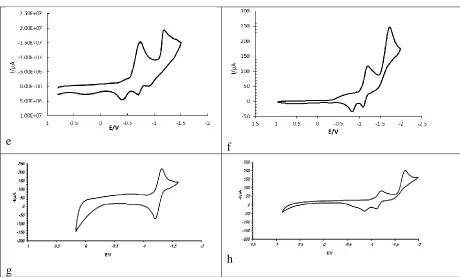
In the present study electrochemical properties, cyclic voltammetry (CV) of ligand and complexes were recorded in dry DMF or acetonitrile on glassy carbon electrode with scan rate of 0.1 V/S. CV diagrams of compounds are depicted at figure 2 and their electrochemical data were summarized in Tale 3. In all cases couples of redox peaks are observed. Ligand is reduced in two steps at -0.98 and -1.56 V in negative sweep. These cathodic peaks may be corresponded to reduction of nitro groups to nitro radical anions[34]. In positive sweep, two anodic peak potentials at -0.81 and 0.57 V that may be attributed to the electro-oxidation of the radical anions formed in the negative sweep. After coordination of ligand to metal centers, the redox potentials are smoothly found to be changed. In cadmium complexes, the first cathodic potentials are shifted to less negative numbers. The softness of coordinated anions supports this positive shifting so that observed in CV of cadmium thiocyante complex. The second cathodic potentials are shifted to more negative numbers for cadmium chloride, bromide and iodide while changed to less negative number for cadmium thiocyanate complex. This is due to strong coordination of thiocyanate to cadmium center than other anions. In reverse sweep, the first and second anodic potentials are more negative in cadmium chloride complex, unchanged in cadmium bromide and less negative in cadmium iodide and thiocyanate complexes. In the case of mercury chloride and azide complexes, both two cathodic potentials are appeared at more negative numbers indicating strong binding of ligand to mercury ion and electron enrichment of ligand leading to harder reduction of its nitro groups. The anodic potentials of these complexes are considerably shifted to more negative numbers due to strong coordination of ligand to mercury center in them. Despite of others, in the cyclic voltammogram of mercury thiocyanate complex, only a cathodic and an anodic potential is observed. This redox potentials may be assigned to Hg(II)/Hg(I) redox process.
b a
f e
h g
Figure 2- CV diagrams of ligand(a); CdLCl2, CdLBr2, CdLI2 and CdL(SCN)2(b-e) and HgLCl2,
HgL(N3)2 and Hg(SCN)2(f-h).
[image:10.596.68.528.64.341.2]In principle, cyclic voltammograms are seen as three shapes: reversible, quasi-reversible and/or irreversible. When the anode and cathode peak currents’ height ratio is very close to 1, the process is reversible. On the other hand when the peak height ratio is less than or greater than 1, the process is considered as quasi-reversible. Ultimately an irreversible process is labeled to one that contains only one peak (either oxidation or reduction).
Table 3. Electrochemical data of ligand and complexes
EPa2(EPa/2)
EPa1(EPa/2)
ΔEP2b
ΔEP1a
EPC2(EPC/2)
EPC1(EPC/2)
Compounds -0.57(-0.62) -0.81(-0.88) -0.14 -0.10 -1.56(-1.42) -0.98(-0.88) L -0.65(-0.69) -0.86(-0.96) -0.92 -0.16 -1.64(-0.72) -0.92(-0.76) CdLCl2 -0.57(-0.63) -0.81(-0.89) -0.14 -0.19 -1.70(-1.56) -0.89(-0.70) CdLBr2 -0.44(-0.48) -0.71(-0.80) -0.09 -0.14 -1.61(-1.52) -0.90(-0.76) CdLI2 -0.45(-0.52) -0.72(-0.79) -0.08 -0.12 -1.16(-1.08) -0.71(-0.59) CdL(SCN)2 -0.78(-0.85) -1.04(-1.12) -0.14 -0.11 -1.74(-1.60) -1.21(-1.10) HgLCl2 --1.17(-1.27) -0.12 - -1.32(-1.20) - HgL(SCN)2 -0.89(-0.93) -1.13(-1.19) -0.10 -0.09 -1.69(-1.59) -1.18(-1.09)
HgL(N3)2
a) ΔEP1=EPC1-EPC/2
[image:10.596.28.569.560.706.2]
Accordingly redox process for mercury thiocyanate complex is reversible and regarding the fact that in other compounds, current height ratios are less than 1 and also the separation of the cathodic and anodic peak potentials are more than 100 mV at 100 mV/S, the electrochemical behaviors are suggested as quasi- reversible processes. Recording of CV diagrams of mercury bromide and iodide complexes failed due to decomposition of these compounds during the voltage scan.
4. CONCLUSION
In this paper we reported the synthesis, full spectroscopic characterization of new symmetric bidentate Schiff base ligand and its cadmium(II) and mercury(II) halide, azide and thiocyanate complexes. The physical and spectral data suggest coordination of the ligand and anions in pseudo-tetrahedral geometry for all complexes. Finally the redox potentials of the complexes were evaluated by electrochemical method using cyclic voltammetry (CV). The results showed the changes in cathodic and anodic potentials of coordination compound with respect to uncoordinated ligand. The ligand and complexes exhibited quasi-reversible electron transfer process except about mercury thiocyanate complex that shows reversible redox behavior.
ACKNOWLEDGEMENT
Partial support of this research by Yasouj University is acknowledged.
References
1. K. Cheng, Q.Z. Zheng, Y. Qian, L. Shi, J. Zhao, H.L. Zhu, Bioorg. Med. Chem., 17(23) (2009) 7861.
2. M. Yildiz, A. iraz and B. Dülger, J. Serb. Chem. Soc., 72(3) (2007) 215. 3. H. M. Parekh, M. N. Patel, Russian J. Coord. Chem., 32(6) (2006) 431. 4. M. Jesmin, M. M. Ali, J. A. Khanam, Thai J. Pharm. Sci., 34 (2010) 20-31.
5. F. Ding, Y. Sun, S. Monsaert, R. Drozdzak, I. Dragutan, V. Dragutan, Curr. Org. Syn., 5 (2008) 291.
6. M. M. Taqui khan, S. B. Halligudi, S. Shokla and Z. A. Shaikh, J. Mol. Catal., 57 (1990) 301. 7. H. Du, X. Pang, H. Yu, X. Zhuang, X. Chen, D. Cui, X. Wang, X. Jing, Macromolecules, 40(6)
(2007) 1904.
8. M. Montazerozohori, M. H. Habibi, L. Zamani-Fradonbe, S. A. R. Musavi, Arkivoc, (xi) (2008) 238.
9. N. H. Lee, J. C. Byun, T.-H. Oh, Bull. Korean Chem. Soc., 26 (3) (2005) 454. 10. N Raman, J. Dhaveethuraja, A. Sakhivel, J. Chem. Sci., 119(4) (2007) 303.
11. G. Dilbera, H. Kantekina, N. Yaylia, R. Abbasoğlua, J. Coord. Chem., 64(21) (2011) 3679. 12. S. Thota, S. Somalingappa Karki, K.N. Jayaveera, J. Balzarini, E. De Clercq, J. Coord. Chem.,
63(24) (2010) 4332.
13. A. A. Nejo, G. A. Kolawole, A. O. Nejo, J. Coord. Chem., 63(24) (2010) 4398. 14. J.M. Kauffmann, J. C.Vire, Anal. Chim. Acta, 273 (1993) 329.
16. P.T. Kissinger, W.R. Heineman, Laboratory Techniques in Electroanalytical Chemistry, 2nd Edition, Marcel Dekker, New York, 1996.
17. A. D. Kulkarni, S. A. Patil, , P. S. Badami, Int. J. Electrochem. Sci., 4 (2009) 717. 18. P. A. M. Farias, M. B. R. Bastos, Int. J. Electrochem. Sci., 4 (2009) 458.
19. S. Ershad, L.-A. Sagathforoush, G. Karim-nezhad, S. Kangari, Int. J. Electrochem. Sci., 4 (2009) 846.
20. M. Montazerozohori, S.A. Musavi, J. Coord. Chem., 61 (2008) 3934.
21. M. Montazerozohori, S. Joohari, S.A.R. Musavi, Spectrochim. Acta Part A, 73 (2009) 231. 22. M. Montazerozohori, S. Khani, H. Tavakol, A. Hojjati, M. Kazemi, Spectrochim Acta Part A,
81(1) (2011) 122.
23. U. Cakır, H. Temel, S. Ilhan, H. Ibrahim Ugras, Spectroscopy Lett., 36 (2003) 429. 24. W. Liu, Y. Zou, Y. Li, Y. G. Yao, Q. J. Meng, Polyhedron, 23 (2004) 849.
25. M. Samir El-Medani, A. M. A. Omyana, R. N. Ramaden, J. Mol. Struct., 738 (2005) 171. 26. N. Kurtoglu, J. Serb. Chem. Soc., 74 (8–9) (2009) 917.
27. N. Sundaraganesan, , S. Ilakiamani, H. Saleem, P. M. Wojciechowski, D. Michalski, Spectrochimica Acta Part A, 61 (2005) 2995.
28. S. Chandraa, M. Tyagia, K. Sharma, J. Iran. Chem. Soc., 6(2) (2009) 310.
29. B. Samanta, J.Chakraborty, C. R. Choudhury, S. K. Dey, D. K. Dey, S.R. Batten, P. Jensen, G.P.A. Yap, S. Mitra, Struct. Chem., 18 (2007) 33.
30. C. Zhang, G. Tian, B. Liu, Trans. Met. Chem., 25 (2000) 377.
31. S. Sen, P.Talukder, G. Rosair, S. Mitra, Struct. Chem., 16 (2005) 605.
32. P. Bhowmik, S. Chattopadhyay, M.G.B. Drew, C. Diaz, A. Ghosh, Polyhedron, 29 (2010) 2637. 33. S. Dehghanpour, A. H. Mahmoudkhani, A. M. Amirnasr, Struct. Chem., 17 (2006) 255.
![Synthesis, Spectroscopic Characterization and Potentiometric Studies of a Tetradentate [N2O2] Schiff Base, N,N'-bis(2-hydroxybenzylidene)-1,1-diaminoethane and Its Co(II),Ni(II),Cu(II) and Zn(II) Complexes.](data:image/gif;base64,R0lGODlhAQABAIAAAP///wAAACH5BAEAAAAALAAAAAABAAEAAAICRAEAOw==)