SUMMARY
Recently published international rankings indicate that the
perfor-mance gap between European and American universities is large and, in
particular, that the best European universities lag far behind the best American
universities.
The country performance index we construct using the Shanghai
ranking confirms that, despite the good performance of some countries,
Europe as a whole trails the US by a wide margin.
The reason for this situation,
which contributes to Europe’s lagging growth performance, is two-fold. First,
Europe invests too little in higher education. Total public and private spending
on higher education in EU25 accounts for barely 1.3% of GDP, against 3.3% in
the US. This translates into average spending of less than €10,000 per student
in EU25 versus more than €35,000 in the US. Second, European universities
suffer from poor governance, insufficient autonomy and often perverse
incentives. Our own survey of European universities shows that both factors
contribute to the EU’s poor performance and that reform should take place on
both fronts, because autonomy also increases the efficiency of spending.
bruegel
policy
brief
ISSUE2007/04 SEPTEMBER 2007
POLICY CHALLENGE
by
Philippe Aghion
Non-Resident Senior Fellow at Bruegel and Professor of Economics at Harvard University
philippe.aghion@bruegel.org
Mathias Dewatripont
Professor of Economics at Université Libre de Bruxelles
Caroline Hoxby
Professor of Economics at Harvard University
Andreu Mas-Colell
Professor of Economics at Universitat Pompeu Fabra
André Sapir
Senior Fellow at Bruegel and Professor of Economics at Université Libre de Bruxelles
andre.sapir@bruegel.org
If Europe is to be a leader in the global
knowledge economy – and if universities
are to produce the top-level research
needed to achieve this – comprehensive
reform of higher education is the order
of the day. While there is more than one
university system that works, most
European countries should invest an
extra one percent of their GDP in higher
education each year. The extra funding
may be public or private. To make this
additional funding ‘bite’, universities
should be given more autonomy in
budgets, hiring and remuneration.
WHY REFORM
EUROPE’S UNIVERSITIES?
Source: Bruegel country performance index, see Table 1.
0 50 100
EU15 EU25 US
The EU-US performance gap for Shanghai Top 100 universities
br
ueg
el
policy
br
ief
02
EUROPEANpointing for the last 30 years butgrowth has been disap-policymakers have only recently started to realise that Europe’s growth performance is intimately linked with the research perfor-mance of its universities.Europe invests too little in higher education. It is generally known that the European Union (EU) spends less than two percent of its GDP on research and development (R&D), compared to more than 2.5 percent in the United States (US). But the gap between Europe and the US is even wider for spending on universities than for R&D. In 2001, total (public and private) spending on higher education in EU25 accounted for barely 1.3 per-cent of GDP, against 3.3 perper-cent in the US. In other words, every year Europe spends two percent of GDP less than the US. In terms of expen-diture per student, the contrast is starker still, with an annual spend of €8,700 in EU25 versus €36,500 in the US.
But the unsatisfactory research performance of Europe’s universi-ties also results from inadequate institutions. European universities suffer from poor governance, insufficient autonomy and often perverse incentives.
Europe started to recognise some years ago that its university system faces a problem. A first step was the Bologna Declaration which ini-tiated the creation of a ‘European Higher Education Area’. Recently, a growing number of individual EU member states have introduced reforms of their university systems.
However, it is the recent publication of global rankings, such as the Shanghai Jiao Tong University Academic Ranking of World Universities (the ‘Shanghai ran-king’), which has made most policy-1
This policy brief does not deal with all the various roles and functions of univer-sities, solely their research function. An upcoming Bruegel Blueprint will provide a fuller analysis of how uni-versities perform against a broader set of objectives. Furthermore, this policy brief does not discuss the potential of EU-level policy to add value. This will also be dealt with in the upcoming Blueprint.
by the publication, since 2003, of the Shanghai ranking which mea-sures university research perfor-mance. Constructed by a group of Chinese scholars, the Shanghai ran-king is a weighted average of six dif-ferent indicators (see Box 1). While the weights are admittedly somew-hat arbitrary, the main advantage of the index is its reliance on publicly available information.
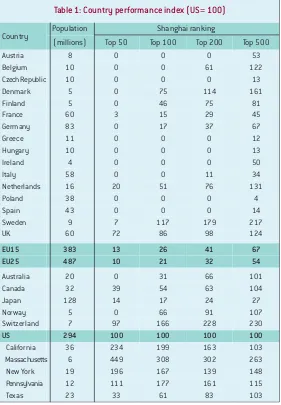
Table 1 presents a detailed account of relative country performance, looking successively at the Top 50, Top 100, Top 200 and Top 500 uni-versities in the Shanghai ranking. To understand how to read this table, consider first the column 'Top 50'. The best university in the Top 50 is given a score of 50, the next best university is given 49, and so on, down to a score of 1 for the lowest performing university within the Top 50. For each country (or region), we then compute the sum of Top 50 Shanghai rankings that belong to this country, and divide the sum by the country's population. Finally, all the country scores are divided by the US score, so that each entry in the column ‘Top 50’ can be interpreted as a fraction of the US per capita perfor-mance for the Top 50 universities. This gives our Country Performance Index for the Top 50 universities. The same logic applies, respectively, to the ‘Top makers aware of the magnitude of
the problem and sparked a public debate on university reform.
The purpose of this policy brief is to examine what reforms are nee-ded in order to enable European universities to produce world-class research and thus make the optimum contribution to growth1.
In the first section of this brief, we draw conclusions from the Shanghai ranking both about European university research per-formance in relation to that of US institutions and about differences in performance between European countries. We then report on our own survey of European universi-ties listed in the Shanghai ranking, which we use to establish what determines university research performance. We also use compre-hensive US data to analyse the interplay between autonomy and funding in boosting university research performance. Finally, we make concrete proposals about how to improve the conditions for research at European universities with the objective of improving their contribution to growth.
1. COUNTRY PERFORMANCE
The debate on the funding and governance of European universi-ties has been stirred considerably
Box 1: The Shanghai ranking
This index aggregates six different indicators of research performance:
• The number of alumni from the university winning Nobel Prizes in physics, chemistry, medicine, and economics and Fields Medals in mathematics.
• The number of university faculty winning Nobel Prizes in physics, chemistry, medicine, and economics and Fields Medals in mathematics.
• The number of articles (co-)authored by university faculty published in Nature and Science.
• The number of articles (co-)authored by university faculty published in Science Citation Index Expanded and Social Sciences Citation Index.
• The number of highly cited researchers from the university in 21 broad subject categories. • The academic performance with respect to the size of the university.
br
ueg
el
policy
br
ief
03
100’, ‘Top 200’ and ‘Top 500’columns, where the best university receives a score of, respectively, 100, 200 and 500, and the last one receives a score of 1. There are, obviously, fewer zero entries in a column as one moves from the Top 50 to the Top 500 as it is easier for a country to have universities appearing in the Top 500 than in the Top 50.
Table 1 reveals several interesting findings:
• First, the United States comple-tely dominates all European coun-tries in the Top 50 universities. Only Switzerland and the United Kingdom rival the US on a per capita basis. By contrast, the EU15 and EU25, with a greater popula-tion than the US, score much lower. • Second, the top 4 US states (Massachusetts, California, New York and Pennsylvania) score bet-ter than any European state in the Top 50 and Top 100.
• Third, country performance gaps close as one enlarges the number of universities considered. In parti-cular, the gap between the EU15 or the EU25 and the US narrows as one moves from the Top 50 to the Top 500. In part this is due to the way the scores are constructed, but it mostly reflects a reality: American universities dominate European universities in the top tier (the Top 50 and Top 100), but Europe has many good universi-ties in the second (the next 100) and the third (the next 300) tiers. • Fourth, there are major differences among European countries: Switzerland, the UK and Sweden do particularly well, even in the Top 100, where they outperform (Switzerland and Sweden) or almost match (the UK) the United States on a per capita basis. Other Nordic countries (Denmark and Finland), Belgium and the Netherlands also do fairly well in the
Top 200 and Top 500. In contrast, southern and eastern Europe lag far behind. France and Germany do relatively poorly, except in the third tier, the universities ranked bet-ween 301 and 500.
2. WHAT EXPLAINS RESEARCH
PERFORMANCE IN EUROPE?
An obvious starting point for eco-nomists is money. Table 2 pre-sents aggregate data on the levels of private and public expenditure on higher education across coun-tries. The main findings are that:
• Richer countries spend relatively more on higher education than poo-rer countries.
• The US spends a lot more on higher education than any European coun-try, especially thanks to private fun-ding. But public spending alone is relatively higher than in the EU. • The Nordic countries also spend a lot, with most of the money coming from public sources.
• The UK spends surprisingly little (more on this later).
[image:3.595.203.484.115.520.2]There is a strong positive correlation between expenditure per student Table 1: Country performance index (US= 100)
Country Population Shanghai ranking
(millions) Top 50 Top 100 Top 200 Top 500
Austria 8 0 0 0 53
Belgium 10 0 0 61 122
Czech Republic 10 0 0 0 13
Denmark 5 0 75 114 161
Finland 5 0 46 75 81
France 60 3 15 29 45
Germany 83 0 17 37 67
Greece 11 0 0 0 12
Hungary 10 0 0 0 13
Ireland 4 0 0 0 50
Italy 58 0 0 11 34
Netherlands 16 20 51 76 131
Poland 38 0 0 0 4
Spain 43 0 0 0 14
Sweden 9 7 117 179 217
UK 60 72 86 98 124
EU15 383 13 26 41 67
EU25 487 10 21 32 54
Australia 20 0 31 66 101
Canada 32 39 54 63 104
Japan 128 14 17 24 27
Norway 5 0 66 91 107
Switzerland 7 97 166 228 230
US 294 100 100 100 100
California 36 234 199 163 103
Massachusetts 6 449 308 302 263
New York 19 196 167 139 148
Pennsylvania 12 111 177 161 115
Texas 23 33 61 83 103
Source: Bruegel computation based on the Shanghai Jiao Tong University Academic Ranking of World Universities (2006).
br
ueg
elpolicy
br
ief
04
Greece Hungary
UK
50 100 150 200 250
5 0
Denmark Sweden
Netherlands Belgium
Germany Finland
Austria Ireland France Italy Spain Czech Republic
10 15 20 25 30
Expenditure per student, 1 000 euros Country performance index
35 US and country performance
[image:4.595.115.389.137.410.2](measu-red by the Top 500 performance values in Table 1), as shown in Figure 1.
However, these aggregate data do not indicate how the money is split between higher education institu-tions, in particular between research-oriented and teaching-oriented universities. In the remainder of this section we there-fore present the results of a survey questionnaire which elicits infor-mation on individual budgets and on the governance of top research performers.
A survey of European universities
A survey questionnaire was sent to the European universities in the 2006 Top 500 Shanghai ranking2. We received 71 responses, an
overall response rate of 36 percent, which can be considered very satisfactory. We decided to focus
on the ten countries for which the response rate was at least 25 per-cent and the number of respon-dents at least two3. This left us with a total sample of 66 universities, with an average response rate of 41 percent for the ten countries considered. We were able to check that, for each country, respondent universities have an average Shanghai 500 rank fairly close to that of the whole population of uni-versities from that country, so that we could be satisfied of the repre-sentativity of our sample4.
Table 3 provides country averages on a variety of dimensions5. It confirms the high degree of hete-rogeneity between countries for the universities in the Top 500:
•Southern European countries (Italy and Spain) have very large (more than 40 thousand students on average) but not well-funded universities.
• Sweden and the Netherlands have universities of average size (20-25 thousand students), and better funded.
•The UK and Switzerland have small (10-15 thousand students) 2
The 2006 Shanghai ranking includes roughly 200 European universi-ties belonging to the EU25 and Switzerland.
3
The ten countries are: Belgium (4 responses out of 7 universities in the Shanghai 500 ran-king), Denmark (2 out of 5), Germany (11 out of 40), Ireland (2 out of 3), Italy (9 out of 23), Netherlands (4 out of 12), Spain (6 out of 9), Sweden (5 out of 11), Switzerland (6 out of 8) and the UK (17 out of 43). We left out France, because only 4 out of 21 universities respon-ded and, moreover, uni-versity budgetary data are not comparable with those of other countries.
4
In fact, respondents had a somewhat higher rank for all countries except for Spain.
5
We obtain very similar results when looking at medians rather than averages.
Source: European Commission, DG Research, for expenditure as percent of GDP. Figures in euros per student were obtained by applying these percentages to GDP and dividing by the number of full-time equivalent students.
* Not available. Note: Not PPP converted.
Table 2: Public and private expenditure on higher education, 2001
As % of GDP In thousand euros per student
Country Public Private Total Public Private Total
Austria 1.4 0.1 1.5 11.0 0.5 11.5
Belgium 1.4 0.2 1.6 10.6 1.6 12.2
Czech Republic 0.8 0.1 0.9 2.3 0.4 2.7
Denmark 2.7 0.0 2.7 25.6 0.4 26.0
Finland 2.1 0.1 2.2 10.3 0.3 10.6
France 1.0 0.2 1.2 7.5 1.2 8.7
Germany 1.1 0.1 1.2 11.5 0.9 12.4
Greece 1.2 0.0 1.2 3.3 0.0 3.3
Hungary 1.1 0.3 1.4 2.6 0.6 3.2
Ireland 1.2 0.2 1.4 9.7 1.6 11.3
Italy 0.8 0.2 1.0 5.6 1.4 7.0
Netherlands 1.3 0.3 1.6 13.0 2.7 15.7
Poland 1.1 -* -* 1.7 -* -*
Spain 1.0 0.3 1.3 4.0 1.2 5.2
Sweden 2.1 0.2 2.3 18.9 1.8 20.7
UK 0.8 0.3 1.1 8.4 3.1 11.5
EU25 1.1 0.2 1.3 7.3 1.4 8.7
Japan 0.5 0.6 1.1 6.5 7.3 13.8
[image:4.595.260.539.514.729.2]US 1.5 1.8 3.3 16.6 19.9 36.5
Figure 1: Relationship between expenditure per student and country performance
br
ueg
el
policy
br
ief
05
and very well funded universities. Comparing with the aggregate information on expenditure in Figure 1, one observes that the UK significantly favours top research performers since the universities in our sample (which belong to the group of top universities) have a budget per student about twice as large as the average for all univer-sities in the country.
There is also a great deal of hetero-geneity – albeit with some general trends – as far as university gover-nance is concerned:
• State intervention is clearly per-vasive, even when universities are not public.
• Wage-setting autonomy is rare, with Sweden and the UK being the prime exceptions.
• Building ownership by the univer-sity is commonplace (except in the Nordic countries and Switzerland). • Hiring autonomy is prevalent, except in southern Europe. • Endogamy (measured as the per-centage of faculty trained in house at PhD level) seems to be negatively correlated with country size: it is high in small countries (Belgium, Denmark, Ireland and Sweden, but not in Switzerland which is highly
open to hiring scholars with PhDs from other institutions), and small in large countries (Germany, Italy and the UK, but not in Spain). This finding clearly reflects the absence of significant academic mobility between European countries.
A striking fact is thus the high variance in university governance across European countries, even among those which are performing well in terms of research. For exam-ple, among the three European countries with the best perfor-mance index, endogamy is high in Sweden but low in Switzerland and the UK, and universities are mostly public in Denmark, Sweden and Switzerland whereas they are mostly private in the Netherlands and the UK.
One dimension where there is little variance across European coun-tries is the age of universities. Top European universities are old insti-tutions: the average age of the 66 universities in our sample is nearly 300 years. It ranges from 220 years in the Netherlands to 450 years in Italy. The only outlier is Denmark where the average age is only 60 years. This suggests that European universities have much
accumulated knowledge, but may also be complicated to reform.
Preliminary evidence
Our survey allows us to examine how budget per student and various measures of university governance correlate with research performance as measu-red by the Shanghai ranking. Table 4 shows that the research perfor-mance of a university is:
[image:5.595.348.482.534.713.2]• positively correlated with the size of its budget per student: the higher Table 3: Characteristics of the universities in the sample (country averages)
Country Age
(years)
Number of students (thousands)
Budget per student (1 000€)*
Public status+
Budget autonomy§
Building ownership§
Hiring autonomy§
Wage-setting autonomy§
Faculty with in-house PhD (%)
Belgium 284 21.7 11.3 0.5 0.4 1.0 1.0 0.0 63
Denmark 59 18.2 11.4 1.0 1.0 0.3 0.5 0.5 40
Germany 289 26.2 9.6 0.9 0.0 0.5 0.8 0.0 40
Ireland 259 16.3 12.7 0.5 0.5 1.0 1.0 0.0 49
Italy 444 44.9 10.1 1.0 0.9 1.0 0.4 0.0 24
Netherlands 217 21.4 20.5 0.8 0.8 1.0 0.8 0.2 33
Spain 342 44.8 7.0 1.0 0.5 1.0 0.5 0.0 69
Sweden 266 27.1 16.2 0.8 0.8 0.2 1.0 1.0 58
Switzerland 326 12.8 26.2 0.8 0.1 0.4 0.8 0.0 24
UK 242 14.6 24.5 0.5 0.9 0.9 1.0 0.8 8
Total 290 24.9 16.1 0.8 0.6 0.8 0.8 0.3 29
Source: Bruegel survey.
* PPP adjusted. +1 if public, 0 if private. §
1 if yes, 0 if no.
Table 4: Correlation between budget and university governance,
and research performance*
Characteristics Correlation
coefficient
Budget per student +0.61
University governance:
Public status+
-0.35
Budget autonomy§
+0.16
Building autonomy§
-0.01
Hiring autonomy§
+0.20
Wage setting autonomy§
+0.27 Faculty with
in-house PhD
-0.08
* Measured by the (logarithm of the) Shanghai ranking
+
1 if public, 0 if private. §
br
ueg
el
policy
br
ief
06
the budget per student, the betterthe performance; • negatively correlated with its degree of public ownership: pri-vate universities perform better than public institutions;• positively correlated with its budget autonomy: not being requi-red to have its budget approved by governmental authorities is asso-ciated with better performance; • not correlated with its building ownership: more autonomy with respect to buildings is not associa-ted with better performance; • positively correlated with its hiring and wage-setting auto-nomy: universities that decide on faculty hiring and set faculty wages do better;
• negatively correlated with its degree of endogamy in faculty hiring: universities which tend to hire their own graduates as faculty do less well.
Taken together these results sug-gest that the research perfor-mance of a university is positively affected by all our measures of university autonomy (except for building ownership), and also by funding. However, they do not tell us: (i) which of these autonomy indicators dominates and how interrelated they are; (ii) whether funding and autonomy improve performance separately from one another, or whether there are posi-tive interactions between the two. We now try to answer these ques-tions with appropriate statistical instruments.
Funding and autonomy
We use ‘regression analysis’, a sta-tistical technique for the investiga-tion of relainvestiga-tionships between variables, to assess the effect of budget and governance on research performance as measu-red by Shanghai rankings.
We are interested in the effect of budget and university governance on university research perfor-mance. However we need to begin by taking into account two other factors that also affect Shanghai rankings, our measure of univer-sity research performance. The first is the size of the university. All other things being equal, larger institutions are likely to have a better Shanghai ranking because they have more researchers. We do not have data on the number of researchers in our survey so we proxy the size of the university by the number of students. The second factor is the age of the uni-versity. All other things being equal, older institutions may have a better Shanghai ranking because they have more alumni.
As expected, the regression analy-sis indicates that the research per-formance of universities is positi-vely associated with their size and their age. More importantly, it also confirms the existence of a positive linkage between budget per stu-dent and research performance. These effects are statistically signi-ficant. Once these three important factors (size, age and money) are taken into account, it turns out that one of the six governance indica-tors reported in Table 4, namely budget autonomy, has a statisti-cally significant effect on research performance. The others have no statistical impact on performance.
But our main result is not simply that more money or more auto-nomy is good for research perfor-mance. It is that more money has much more impact when it is com-bined with budget autonomy. To be more precise: we find that having budget autonomy doubles the effect of additional money on uni-versity research performance.
Hence, increasing budget per
student helps research perfor-mance, and having budget auto-nomy doubles this beneficial effect.
This message, based on the research performance of European universities, is reinforced by an ana-lysis of US universities .
3. LESSONS FROM US EVIDENCE
The United States provide a wealth of information that can be used to go one step further in the analysis of research performance. We have access to a rich data set across US states and over time on education spending and patenting. For each state, we have annual information on university funding and gover-nance and on patenting. We are able, therefore, to examine the effect of university funding and governance on innovation activity directly, rather than solely on uni-versity research performance.
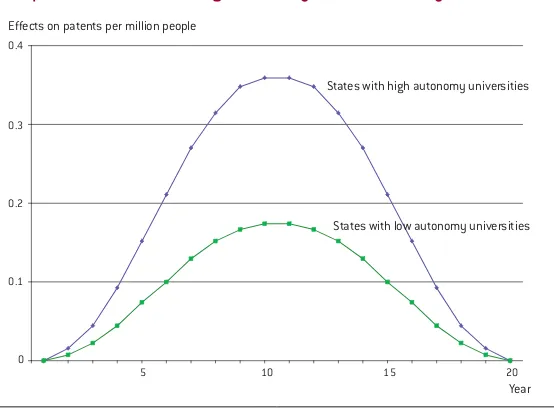
[image:6.595.405.540.114.255.2]There is considerable variation in university governance across states. States vary not only in the relative importance of private ver-sus public universities, but also in the degree of autonomy granted by state authorities to public universi-ties. Sometimes, even neighbou-ring states display sharp diffe-rences in governance. For instance, public universities in Illinois enjoy on average rather low autonomy,
Table 5: Effect of budget and autonomy on research performance*
Variable Effect on research
performance
Size of the university +
Age of the university +
Budget per student +
Budget autonomy +
Interaction between budget and autonomy
+
br
ueg
elpolicy
br
ief
07
6Philippe Aghion,
Leah Boustan, Caroline Hoxby and Jerome Vandenbussche,
Exploiting States’ Mistakes to Evaluate the Impact of Higher Education on Growth, mimeo, Harvard (2007).
while their neighbours in Ohio enjoy high autonomy. These diffe-rences are persistent over time and often go back to the idiosyn-cratic origin of American universi-ties, which in turn reflect diffe-rences in the prefediffe-rences of univer-sity founders (eg Benjamin Franklin founded the private University of Pennsylvania, whe-reas Thomas Jefferson was the founder of the public University of Virginia).
Our strategy is to take US states' differences in university autonomy as given and then ask the following question: Does a given investment in higher education produce more patenting in a US state if universi-ties in that state are more autono-mous? The details of the statistical test are reported in Box 2. The ans-wer to our question is a resounding ‘yes’. As illustrated in Figure 2, the effect of additional spending on patenting is roughly twice as high for states with more university autonomy. Autonomy therefore greatly enhances the efficiency of spending. This result confirms and nicely complements the one from Section 2.
4. CONCLUSIONS
In this brief we have investigated the relationship between univer-sity governance and funding on the one hand and various mea-sures of performance on the other hand. In the first section we have tried to link our Country Performance Index based on the Shanghai ranking of universities to different aspects of university governance drawn from a survey questionnaire. In the second sec-tion of the brief we have assessed how university autonomy affects the patenting impact of university research funding.
Several interesting findings come
out of our investigation.
First, the performance gap bet-ween Europe and America is large, in particular for the best-perfor-ming universities.
Second, as we broaden the investi-gation from the Top 50 to the Top 500 universities in the Shanghai ranking, the relative performance of European countries improves compared to the US. This, in turn, suggests strongly that quality variance is lower among European universities than among their American counterparts. It also sug-gests that what Europe lacks most is top-class universities.
Third, there is more than one model of university system that appears to work. For example, both Switzerland and Sweden are doing
well with mostly public universities, while the UK also performs well with a higher share of private uni-versities, but also higher tuition fees and a higher degree of stu-dent selection. The UK, however, differs significantly from Switzerland and Sweden in one respect. All three perform very well in the top tier (Top 50 and Top 100), but the UK performs relati-vely less well in the remainder of the Top 500. This is due to the fact that the UK concentrates its less than average higher education budget (in terms of GDP) heavily on its top institutions.
Indeed, a fourth lesson is that money helps performance.
Fifth, autonomy is good for research performance.
Box 2: University funding, autonomy and innovation: data and methodology
Data
For research expenditure, we use the detailed data in Aghion et al (2007)6
on how much each state spent on each type of education in all years from 1947 to 2004. We know in particular from these time series how much each US state spent on a given cohort of individuals (eg born in year X) in each year. Thus we know how much was spent on average on each individual at every stage of his or her studies (from primary school to post-graduate college).
For governance, we consider two alternative measures of university autonomy at the state level: (i) the percentage of universities that are private, keeping in mind that pri-vate universities are, on average, more autonomous than public universities; (ii) an aggregate autonomy index for public universities, which is constructed on the basis of several component factors. This index takes the maximum value when the public uni-versities in the state: (a) set their own faculty salaries; (b) set their own tuition fees; (c) have lump-sum budgeting (as opposed to line item budgeting); (d) can shift funds among major expenditure categories; (e) retain and control tuition revenue and/or grants; (f) have no ceiling on external faculty positions (and therefore need not hire faculty internally); (g) have no ceiling on external non-faculty positions (administra-tors or technicians); (h) have freedom from pre-audits of their expenditure; (i) can carry over year-end balances (rather than returning them to the state). It emerges that, as in the case of European universities, the most statistically important compo-nent factor of this aggregate index is budget autonomy.
Statistical test
We examine the effect on patenting in a US state of increasing research education fun-ding by $1,000 per year and per person over a sustained period, respectively in states with highly autonomous universities and in states with less autonomous universities.
br
ueg
el
policy
br
ief
08
Bruegel is a European think tank devoted to international economics, which started operations in Brussels in 2005. It is supported by European governments and international corporations. Bruegel’s aim is to contribute to the quality of economic policymaking in Europe through open, fact-based and policy-relevant research, analysis and discussion.
Visit www.bruegel.orgfor information on Bruegel's activities and publications.
Bruegel - Rue de la Charité 33, B-1210 Brussels - phone (+32) 2 227 4210 info@bruegel.org
© Bruegel 2007. All rights reserved. Short sections of text, not to exceed two paragraphs, may be quoted in the original language without explicit permission provided that the source is acknowledged. The Bruegel Policy Brief Series is published under the editorial responsibility of Jean Pisani-Ferry, Director. Opinions expressed in this publication are those of the author(s) alone.
Sixth, autonomy and funding are complementary: more autonomy increases the extent to which addi-tional research funding improves performance.
Policy lessons
What should be done to improve the performance of European uni-versities?
1. European countries should invest more in their university systems. On average, EU25 members spend 1.3 percent of GDP on higher education, against 3.3 percent in the US. European countries should increase higher education fun-ding by at least one percentage point over the next ten years. It remains an open question how public budgets and private fun-ding inclufun-ding tuition fees can share the burden of this increase.
2. For this effort to pay off, European universities should become more autonomous, in particular with regard to bud-gets, and also in hiring, remu-neration, course design and student selection, particularly at Master’s level. What matters for good performance is both money and good governance. The two are complementary: increasing university budgets has more impact with good governance and improving
governance has more impact with higher budgets. We are aware, however, that greater autonomy can be perverse and that it must be accompanied by greater performance evaluation.
Of course this brief has focused mainly on the research function of universities and has left aside poli-tically sensitive issues of tuition fees and student selection, which are perhaps more directly related to the teaching function, although they also impact on research. Yet we are confident that a reform stressing increased budget per student and greater autonomy (together with greater evaluation)
will be performance enhancing, either alone or as part of a more radical overhaul of the university system, involving tuition fees and student selection. So far, our par-tial evidence, which will be further examined in a forthcoming Bruegel Blueprint, leads us to believe that there is more than one university system that works and, therefore, that there are diverse paths to uni-versity reform.
We are very grateful to Aida Caldera, Indhira Santos and Alexis Walckiers for their excellent research assis-tance, and to colleagues across European universities in helping with the university survey used in
Source: Authors’ own computations.
Note: The increase in expenditure is assumed to last from year 1 to 6. The effect on patenting accordingly starts in year 2, peaks in years 10 and 11, and ends in year 20.
0
20
5 10 15
[image:8.595.261.538.141.346.2]0.1 0.2 0.3 0.4
Figure 2: Effects on patents of an increase in higher education expenditure, states with high autonomy vs. low autonomy universities
Effects on patents per million people
Year States with high autonomy universities