IFS
Higher Education Funding Policy:
Who Wins and Who Loses?
A Comprehensive Guide to the Current Debate
Lorraine Dearden
Emla Fitzsimons
Alissa Goodman
Greg Kaplan
Higher Education Funding Policy:
Who Wins and Who Loses?
A Comprehensive Guide to the Current Debate
Lorraine Dearden Emla Fitzsimons Alissa Goodman
Greg Kaplan
Institute for Fiscal Studies
Copy-edited by Judith Payne
Published by
The Institute for Fiscal Studies 7 Ridgmount Street London WC1E 7AE Tel: +44 (0)20 7291 4800 Fax: +44 (0)20 7323 4780 Email: mailbox@ifs.org.uk
Website: www.ifs.org.uk
Preface
Executive summary 1
1. Introduction 6
2. 2.1 2.2 2.3 2.4 2.5
Economic principles behind government intervention in the HE market
Who should pay for the costs of tuition and living expenses? Credit markets: helping students raise the money to pay for HE Subsidising the cost of HE: lowering the price faced by students Equality, fairness and reducing inequality
Designing an attractive funding system
7 7 8 9 10 11 3. 3.1 3.2 3.3 3.4
Details of the proposed reforms of the different parties
The 2003–04 HE funding system Labour Party proposed reforms Conservative Party proposed reforms Liberal Democrat Party proposed reforms
13 13 16 17 17 4. 4.1 4.2 4.3 4.4 4.5
What the reforms would cost, and who would pay
What do the reforms mean for the taxpayer? Labour’s proposals
The Conservatives’ proposals The Liberal Democrats’ proposals A circular flow of payments
19 19 19 21 22 24 5. 5.1 5.2 5.3
What the reforms mean for university funding
Funding per head
Distributional implications for universities International comparisons 29 29 32 32 6. 6.1 6.2
What the reforms mean for students from 2006–07
How much support would be available to students? How much would students borrow?
34 34 36 7. 7.1 7.2 7.3 7.4
What the reforms mean for future graduates
Introduction
Methodological approach
Earnings profiles of graduates and non-graduates
Impact of different HE funding policies on graduates across the entire earnings distribution
Analysis for all graduates Analysis by quintile Additional analysis
40 40 41 42 50 53 57 63
8. Conclusions 69
1
Executive summary
Why should the government intervene in the HE market?
1. Higher education (HE) is never free. The main political parties all aim to increase spending on HE per university student, but differ in how they would share the costs between students, graduates and taxpayers.
2. Credit market failures can prevent students from borrowing to finance a university education, even though it is likely to reward them with higher earnings later in life. This may justify government action to help them borrow, but does not in itself justify subsiding the cost of their education.
3. Subsidising higher education may be justified if the government also wants to encourage more people to enter HE than would wish to do so out of self-interest. It may believe that individuals are irrationally reluctant to borrow to finance an education that would benefit them, or that an individual’s university education would have spillover benefits for the rest of society.
4. The government may in particular wish to intervene to encourage people from low-income backgrounds to enter higher education. They may find it harder to borrow, they may be more short-sighted or debt-averse, and they may be less aware of the potential benefits of university education, than people from wealthier backgrounds. Helping to overcome these barriers may reduce the persistence of relative low incomes from one generation to the next.
5. A sensible HE funding system would help students defer the costs of university until after graduation, as well as providing some insurance against unexpectedly low future earnings, for students who have taken out loans to fund their higher education. It would offer some subsidy to reflect spillover benefits, but would ensure that people who benefit from HE bear more of the cost than those who do not. It would offer students an adequate standard of living at university, irrespective of their family backgrounds. Furthermore, it would be simple, transparent and flexible in terms of its administration.
Proposed reforms to the HE system
1. Students who started studying in 2003–04 (the ‘baseline’) faced an upfront fee of up to £1,200 p.a., depending on family income. They were offered annual maintenance loans of between £3,225 and £4,305, means-tested on family income and repayable at a rate of 9% of the graduate’s earnings above £10,000 each year, with the outstanding debt uprated in line with inflation (i.e. a zero real interest rate). No grants were available.
same terms as in 2003–04 (except any debt outstanding after 25 years would be written off, and the annual earnings threshold for debt repayments would be raised from £9,285 to £13,925). Some students would also be entitled each year to a means-tested grant up to £2,700, a means-means-tested maintenance loan of between £3,305 and £4,405, and a means-tested bursary of at least £300 if their university charged the full top-up fee.
3. The Conservatives would scrap tuition fees and make a £5,000 annual maintenance loan available to students from all family backgrounds. These loans would be offered by banks at market interest rates, estimated at between 6.5% and 8% (nominal) a year. Repayments would be set at 9% of the graduate’s earnings above £13,925, with outstanding debt written off after 25 years. A means-tested grant of up to £1,500 p.a. would be available to students whose parental earnings are below £22,100 a year. 4. The Liberal Democrats would also abolish tuition fees. They would offer a
means-tested maintenance loan of between £3,225 and £4,300 per year and a means-means-tested grant of up to £2,000 a year for those from families in which parental earnings are below £22,100. Repayments would be scheduled at 9% of the graduate’s earnings above £13,925 and would carry a zero real interest rate, with any outstanding debt written off after 25 years.
What would the reforms cost and who would pay?
1. The baseline HE system costs the taxpayer £6,300 million, with students contributing a further £500 million in upfront fees. This provides universities with income of £5,800 million and graduates with a loan subsidy of £1,000 million.
2. The Conservative proposals would provide universities with an extra £1,200 million and students with an extra £900 million compared with the baseline system. This would cost taxpayers an extra £1,100 million and graduates would lose the £1,000 million they received under the baseline system. Around £400 million of the taxpayer contribution would be made by gifting the Student Loan Book to the universities.
3. Labour’s proposals would provide the universities with an extra £1,100 million and students with an extra £1,500 million. This would cost both taxpayers and graduates £1,300 million, making graduates net contributors to the system.
4. The Liberal Democrat proposals would provide both universities and students with approximately an extra £1,100 million. The whole bill of £2,200 million would be picked up by taxpayers, funded by the introduction of a 49% income tax rate on all incomes in excess of £100,000. Graduates would remain net beneficiaries of the system, because of the loan subsidy they would receive.
Executive summary
3
between taxpayers and graduates under Labour and the Conservatives, but would be borne entirely by taxpayers under the Liberal Democrats.
What would the reforms imply for university funding?
1. The baseline HE system in 2003–04 provided funding per student of around £5,900 in 2006–07 prices. This would rise to £7,600 under Labour, £7,600 under the Conservatives and £7,700 under the Liberal Democrats, an increase of roughly 30% in each case.
2. This would return funding per student to the levels seen in the early 1990s, but would leave it well below the peak of around £11,000 experienced in 1973.
3. If universities wished to raise funding levels under Labour, they may be allowed to set fees in excess of £3,000 after this limit expires in 2010–11. This would require an extra contribution from graduates and presumably an extra contribution from taxpayers to subsidise bigger loans to cover the higher fees.
4. Under the Liberal Democrats and the Conservatives, the money would have to come from the taxpayer, although the Conservatives are also proposing incentives to encourage universities to raise more income from endowments.
5. Labour’s policy to require universities to pay bursaries to students from lower-income families would mean that universities with relatively large numbers of students from low-income families would receive less extra funding per student. Under the Conservatives, universities that are relatively successful at attracting endowments would receive more of the proceeds from the Student Loan Book.
6. The increase in student funding per head implied by the three parties’ proposals would lift funding in the UK above the 2001 figures for Australia and Japan, but leave it below those for the Scandinavian countries and the USA. Funding per student in the UK already exceeds that in France, Ireland, Germany and Italy.
What would the reforms mean for students?
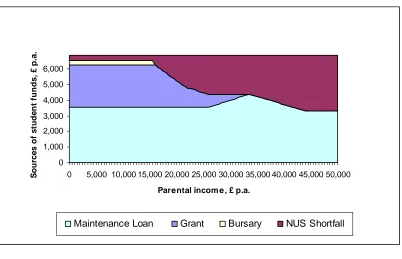
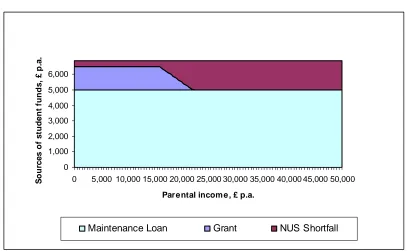
1. The National Union of Students (NUS) estimates that the basic cost of living for a student in year 1 or 2 of their degree, living away from home and outside London, is £6,890 in 2006–07 prices, excluding fee costs. None of the funding schemes proposed by the parties would provide students with this much income from maintenance loans, grants and bursaries alone.
3. If students wish to achieve (as far as possible) the same standard of living under the Labour, Conservative and Liberal Democrat systems, the poorest students would have maintenance loans of £3,555, £5,000 and £4,300 p.a. respectively. This would still leave them between £335 and £590 short of the NUS cost-of-living estimate. The richest students would have maintenance loans of £3,305, £3,305 and £3,225 p.a. respectively and this would leave them between £3,585 and £3,665 short of the NUS estimate. This assumes that students would not avail themselves of other sources of external finance.
4. These borrowing levels would mean that total debt on graduation under the Labour, Conservative and Liberal Democrat systems would be £19,340, £16,230 and £12,340 respectively for the poorest students, and £18,670, £10,730 and £9,250 respectively for the richest students. This assumes that students would borrow full fee loans of £3,000 p.a. under Labour.
What would the reforms mean for graduates?
1. How graduates fare under different parties’ HE funding schemes depends on their lifetime earnings, how much debt they graduate with, and the interest rate and repayment conditions for their loans.
2. We have used innovative techniques to estimate the full distribution of likely future graduate and non-graduate lifetime earnings profiles, taking into account earnings mobility and periods of non-employment, in order to assess how different HE funding policies would affect graduates.
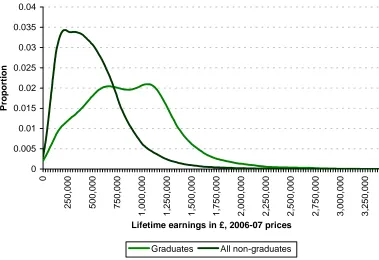
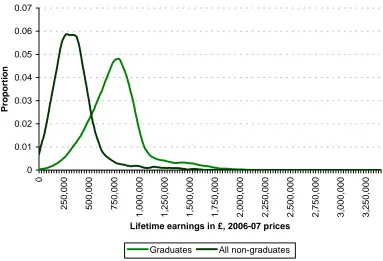
3. We estimate the median of the lifetime earnings distribution for male graduates to be around £325,000 higher than the equivalent figure for male non-graduates. For women, the lifetime earnings advantage of the median graduate over the median non-graduate is around £430,000.
4. However, there is considerable variability in total lifetime earnings across the population. Indeed, some graduates will earn less than some non-graduates over their lifetimes. For example, whereas 15% of male graduates will earn less than £900,000 over their lifetimes, 18% of male non-graduates will earn more than this amount. Similarly, 15% of female graduates are likely to earn less than £500,000 while 16% of female non-graduates will have lifetime earnings greater than £500,000.
5. Allowing for mobility and periods out of work results in lower estimates of within-education-group lifetime earnings inequality than conventional estimates, in which it is generally assumed that individuals are employed for every year of their working lifetimes and that they stay at the same point in the earnings distribution throughout their lives. The standard deviation of the lifetime earnings distribution for male graduates decreases by 60% when the effects of mobility and non-employment are taken into account.
Executive summary
5
• Under the Labour policy, the average taxpayer subsidy on loans ranges from 27.4% to 29.1% for men and from 41.2% to 45.7% for women, depending on the family income of the student while at university. Under the Liberal Democrat policy, the corresponding numbers are 21.0% to 23.3% for men and 26.3% to 30.9% for women.
• The average time to pay back loans, and the percentage of graduates not paying back their loans within 25 years of graduation, differ considerably between the three systems. Furthermore, even within systems, they are different for graduates from different backgrounds.
• Male graduates from the poorest families pay back debt on average for the shortest time under the Liberal Democrats’ proposed system and for the longest time under the Conservative system. This is also the case for female graduates.
Men Women
Low-income family
High-income
family
Low-income
family
High-income
family Labour
Years to pay debt 17.3 17.0 22.2 22.0
Percentage of graduates not paying off debt after 25 years
3.3% 3.1% 58.1% 54.6%
Conservatives
Years to pay debt 20.9 15.2 23.2 20.9
Percentage of graduates not paying off debt after 25 years
18.8% 2.9% 81.4% 50.3%
Liberal Democrats
Years to pay debt 13.3 11.3 18.2 15.2
Percentage of graduates not paying off debt after 25 years
1.3% 0.9% 21.9% 11.2%
1. Introduction
In the run-up to the next general election, higher education (HE) funding policies will be a key election issue. This Commentary compares Labour’s proposed reforms to the system of HE finance in England1
and the alternative proposals outlined by the Conservative Party in September 20042 and the Liberal Democrats in January 2005.3
At their root, all of the parties’ proposals aim to increase the level of funding per university4
student. But the ways in which this will be achieved are very different. This has implications for how well off students will be and how well off future graduates will be and will also have implications for universities and the taxpayer. All of these issues are explored in this report. Our Commentary brings together the facts relating to proposed reforms to HE funding and offers new insights into the HE funding debate in the run-up to the election, including:
• the economic arguments behind government intervention in the higher education market and what features a sound funding scheme should display;
• an exposition of the key features of the three parties’ HE policy, and the main differences between them;
• how the numbers behind the different proposals add up, setting out the implications for taxpayers, universities, students and graduates;
• an assessment of what the reforms will mean for the living standards of students whilst at university, and what levels of debt students are likely to graduate with under different funding systems;
• an in-depth examination of the impact of different HE funding policies on graduates across the entire distribution of likely future graduate earnings paths, accounting for earnings mobility and time spent out of the labour market.
This research builds on earlier work at IFS in which we provided assessments both of the government’s plans for reforming HE funding5
and of previous Conservative and Labour proposals.6
1
Department for Education and Skills, 2003, 2004a, 2004b and 2004c.
2
See Conservative Research Department (2004).
3
See Liberal Democrats (2005).
4
In line with Department for Education and Skills (2003) and for ease of reading, we use the word ‘university’ as a substitute for ‘higher education institution’.
5
See Dearden, Fitzsimons and Goodman (2004a).
6
7
2. Economic
principles
behind
government intervention in the HE
market
2.1 Who should pay for the costs of tuition and living
expenses?
The most fundamental way in which Labour’s proposals and the proposals set out by the Conservatives and Liberal Democrats diverge is in who pays for the costs of tuition. They also diverge in their vision of who pays for costs of living whilst at university (see Chapter 4). What economic principles underlie the question of who should pay for higher education fees and living costs? First, it is important to be clear that higher education is never free, whether the costs are met upfront by students, later in life by graduates or in an ongoing way by taxpayers in general (or indeed subsidised by the universities themselves). Altering the system of HE finance changes the timing of payments and might also change the incidence of payments, but does not change the fact that the cost of university education must be paid for in one way or another.
With no intervention in the market for higher education, all students would bear the full costs of their higher education – both fees and living costs – upfront and in full. Although there is clear evidence that individuals stand to gain financially from attending university7
– both from an increased likelihood of employment and from higher earnings once in employment – at least five different sorts of problems might justify government intervention:
• Capital markets may not develop to allow students to borrow enough money to cover
the costs of their tuition and maintenance. This could lead to an inefficiently low level of participation in higher education. Moreover, this inefficiency may be inequitable, affecting students from poorer families more than those from richer ones.
• Students may lack the information they require to make rational, informed choices.
• Young people may be too short-sighted or too debt-averse to make the choices that are likely to be best for them. This may lead to the government intervening to affect education choices for paternalistic reasons.
• Apart from the private benefits to a degree, there may also be social returns to higher education.8
Young people may have a limited incentive to take these into account when deciding whether or not to go to university, so the government may intervene to affect choices.
7
For example, see Blundell et al. (2000) and Dearden, McGranahan and Sianesi (2004).
8
• There may also be a case for intervention on equity grounds. A government may wish to influence the composition of participants in higher education in such a way as to reduce future inequalities.
Given these issues, one might expect the government to determine who should pay, how much and when, so as to generate what it regards as the optimal level of investment in education, both for the individuals who are investing and for society as a whole. In order to understand more fully the possible forms that intervention is likely to take, we now look more closely at issues relating to credit markets and to subsidising the cost of higher education.
2.2 Credit markets: helping students raise the money
to pay for higher education
The first – and arguably the most important – aspect of the market for higher education is that the main benefits are not realised until some time after the costs of undergoing education are incurred. As such, it represents an investment, with at least part of the pay-off taking the form of higher earnings potential later in life. This renders it different from many other goods, from which the pay-offs accrue upon consumption. Of course, there are likely to be consumption benefits to attending university, such as enjoyment of learning and/or other aspects of student life, but in general these are secondary to the long-term benefits.
In the absence of government intervention, it is only if students themselves can somehow raise the money to pay for their higher education that they can make the investment. Some individuals may work part-time or may receive repayable and/or non-repayable contributions from parents, or they may study after a period of employment, in order to pay for university. However, in general, students – particularly those from lower-income families – must be prepared to borrow to finance the investment. If they rely on capital markets for loans, such markets must operate efficiently in order for an optimal level of investment in higher education to be realised.
Moreover, the returns to this investment are also uncertain. Some people stand to gain a great deal from their higher education, in terms of future income. Others stand to gain much less. The rewards for a particular individual cannot be known in advance with any degree of certainty. This means that there needs to be some form of insurance in operation, allowing people to pool their risks, in order for an optimal level of higher education to be realised. In principle, even if the returns are uncertain, we might expect capital markets to develop to help individuals to pay for their higher education. This would allow an efficient level of educational investment to take place without the government stepping in. However, in practice, there are some common reasons why capital markets fail:
• Lenders are prone to problems relating to asymmetric information. If banks or other
Economic principles
9
• If borrowers realise that they can avoid paying back their loans – for example, by not
earning sufficient income to repay them or by declaring bankruptcy9
– and lenders lack the information to monitor their behaviour closely enough, the market may break down for this reason (this problem is commonly referred to as moral hazard).
In many markets in which banks or other financial institutions provide loans, individuals are required to provide collateral to overcome these informational problems. However, in the case of loans for higher education, just as with other investments in human capital, there is no obvious collateral that an individual can put forward against the value of the loan – lenders do not have property rights over students’ future earnings, and bonded labour is illegal.10 This
makes it even less likely that a fully effective credit market will develop without the government intervening.
What do these credit market failures suggest about who should pay for university tuition? One possible approach that a government could take is to remove the requirement for students to pay for their fees, as in the Conservative and Liberal Democrat proposals. This would certainly remove some short-term financial constraints that may deter students from attending university. Another approach is to remove any upfront fee requirement and to make fee payment deferrable until after graduation, as in the Labour proposals. However, it is important to remember that regardless of whether fees are payable or not, living costs are also likely to represent a significant deterrent to potential students, if capital markets are not perfect.
It is also important to remember that while the presence of credit market failures might justify action by governments to make it easier for students to borrow sufficient money to cover the cost (or to defer payment until later in life in some other way), it does not justify exempting them from all or part of that cost. In fact, credit constraints alone do not justify any subsidy; they only rationalise policies aimed at overcoming the capital and insurance market failures discussed. A more direct approach to alleviating credit constraints is to intervene in the credit market – for example, through providing loans at an economically efficient interest rate and/or through providing insurance by making loan repayments income-contingent.11
Designing a tax system that could achieve the same effect is theoretically possible but would be much more difficult and complicated.
2.3 Subsidising the cost of higher education:
lowering the price faced by students
As well as helping students to raise the capital they require, governments might also want to encourage more people to go to university than would otherwise choose to do so at the market
9
See ‘Is going bankrupt the way to stay afloat?’, Guardian, 14 June 2003, for evidence that some students have declared bankruptcy in order to avoid paying debts.
10
This would not be a problem for some older students, who could borrow against assets, or students whose parents are prepared to underwrite a loan.
11
price, by providing subsidies for tuition and/or living costs. This could be justified in the presence of externalities in the market for higher education and/or on paternalistic grounds:
• Externalities: An optimal policy approach would be to encourage more people to go to
university than would choose to go at the market price, if there are social returns to higher education that individuals do not take into account when making their education choices. For example, the benefits to some forms of research and innovation facilitated by higher education may be large, with the benefits to society outweighing the amount that any individual or firm can privately capture. An example could be scientific research for which the benefits to society are larger than the financial benefits captured by patents. There may also be benefits to society from a better-educated population, such as lower crime rates. However, it is open to debate what the size of such externalities is likely to be, how widespread they are and how best to alter the market to capture them. For example, it may be more efficient to fund research, from which the biggest externalities are likely to arise, or to subsidise some subjects more than others, rather than to provide blanket subsidies for all HE study.
• Paternalism: Society might believe that young people will not make the right choices for
themselves if they are liable for the full costs of their tuition and maintenance, even if they are able to borrow to cover the costs. For example, if individuals are too short-sighted or too averse to running up debt to take out loans to attend university, then intervention may be appropriate. One particular concern is that young people from lower-income backgrounds may both discount the future especially highly (i.e. be unprepared to forgo current income for future gains) and be more averse to borrowing in order to generate funds for living costs while they study. This may be in part due to them not understanding the implications of the different funding options open to them. This means young people should be provided with clear and comprehensive information about the likely implications of the different choices available.12
2.4 Equality, fairness and reducing inequality
All of the economic arguments discussed so far relate to how the government might intervene to ensure efficient HE outcomes and therefore an optimal level of HE investment. Some of the arguments discussed are likely to be more relevant for younger individuals from low-income backgrounds, who, compared with individuals from wealthier backgrounds or older students, may:
• be more likely to be credit-constrained if the market for loans fails, as parents are less likely to be able to fund their study;
• be more debt-averse, or more likely to discount the future more heavily13 (this is
especially so if there is a need to generate income at the earliest time possible to help support the family, or if the family cannot help out with future loan repayments if the expected returns to education fail to materialise);
12
Indeed, this is what the DWP’s ‘informed choice’ is doing with respect to retirement savings decisions.
13
Economic principles
11
• not have as many close relatives who attended university, in which case they will have less information about the relative costs, benefits and risks of attending university than their better-off peers.
But all of these efficiency arguments to one side, the government may wish to pursue other objectives. In particular, it may seek to equalise the distribution of income, or to reduce the intergenerational persistence of income. It may thus intervene in the HE market on these grounds alone, and may indeed choose to trade efficiency off against equity (e.g. to set fees at an inefficiently low level) to achieve these goals.
2.5 Designing an attractive funding system
Referring to our discussion above, there are a number of principles we can draw out underlying the design of an ideal HE funding system.
• Credit markets: It is important to ensure that students are able to study now and pay
later (both for fees and for costs of living), through a well-functioning market for loans or a carefully designed tax system. Students also need to be insured against future earnings risk. Again, this might be built into a system of loans or into the tax and benefit system.
• Price: The amount that students or graduates pay should be subsidised to reflect any
externalities, or for paternalistic reasons. However, despite these reasons for subsidies, the benefits of undertaking higher education are on average high, as well as variable. The benefits vary by subject chosen, university and luck. There are good economic efficiency arguments why students who benefit from university should pay for it and those who benefit most should pay more than others.
• Fairness: Students should be able to make HE choices based on an assessment of the
long-term benefits to them of attending, and not on the basis of short-term funding constraints, which will be largely determined by family income. Students should therefore have access to an acceptable level of living support whilst undertaking their course, regardless of family income (this is closely related to the credit market point, above). Ideally, family income should be assessed relative to family size for these purposes.
• Administration: The funding system should be simple, transparent and flexible, and as
much information as possible about the costs and benefits of HE should be provided.
• Quality: If students are required to pay part of the costs of their education through fees,
this may well drive up standards of provision or ensure that provision is more tailored to individual needs.
taxpayer would end up footing the bill for something that most high-income parents would otherwise have done willingly. This is the problem of moral hazard.
13
3. Details of the proposed reforms of the
different parties
The main features of the proposed reforms to the higher education funding system are set out in Table 3.1. The first column shows the proposals under Labour, the second column shows the main features of the Conservative proposals and the third column shows the Liberal Democrat proposals.
Before proceeding, it should be noted that throughout this Commentary, we present all figures relating to the reforms in 2006–07 prices, not current 2004–05 prices.14
The corresponding figures in today’s prices are available from the authors.
3.1 The 2003–04 HE funding system
The HE funding system that we use as the base against which to assess the proposed changes is the system that applies to students who started their study in 2003–04. This is because we believe it is correct to include the re-introduction of the maintenance grant in 2004–05 as an element of Labour’s reforms, as well as the increase in the loan repayment threshold in 2005– 06. This was an element of the phased reforms first set out in the 2003 White Paper (Department for Education and Skills, 2003) and subsequently modified (Department for Education and Skills, 2004b). Academic year 2003–04 was the final year before any of the White Paper changes had begun to be implemented. The key features of the 2003–04 system are:
• Upfront fees of £1,200 per annum across all undergraduate courses and universities. Individuals from low-income families (annual parental income below £33,560) were entitled to a full or partial fee exemption, means-tested against parental income.
• No student grants.
• Means-tested maintenance loans of up to £4,305 per annum available to all students, repayable at a rate of 9% of any earnings above £10,000 each year.15 The outstanding
value of the loan would rise each year in line with inflation. There was no provision for debt write-off.
Full details of the 2003–04 funding scheme are contained in Appendix A.
14
This follows the government’s own approach in its presentation of the key features of the reforms.
15
This is the threshold that would apply to new students from 2003–04 who would graduate in 2006–07. In analysing debt repayment under the various policies for new students in 2006–07 (when the new policies would be
Table 3.1. Details of Labour’s proposals 2004, the Conservatives’ proposals 2004 and the Liberal Democrats’ proposals 2005 (2006–07 prices)*
Measures Labour’s proposals** Conservatives’ proposals Liberal Democrats’ proposals FEES UPFRONT FEES DEFERRED FEES
No upfront fee.
Set by university. Initial cap of £3,000 p.a.
No fee exemptions.
No fee.
No fee.
No fee.
No fee.
LOANS
LOANS FOR FEES Equal to fees charged by
university. Not means-tested.
N/A N/A
LOANS FOR MAINTENANCE Students living away from home outside London
£3,555 (£3,225)a p.a. if
family income <£26,000
Loan of £3,555 (£3,225) p.a. is incrementally increased by up to £850 between family income of
£26,000 and £33,560, so that for family income
of £33,560 the loan is £4,405 (£4,070) p.a.
Loan of £4,405 (£4,070) is tapered away between family income of £33,560 and £44,000 (£42,500) so that for family income above £44,000 (£42,500)
the loan is £3,305 (£3,055) p.a.
£5,000 p.a.
Not means-tested.b
£4,300 (£3,735)
p.a. if family income <£33,560
Loan of £4,300
(£3,735)p.a. is
tapered away between family
income of £33,560 and £44,000 (£42,500), so that for family income above £44,000 (£42,500)
the loan is £3,225 (£2,800) p.a.
REPAYMENT OF LOANS
9% of income above £15,375 (from 2005–06).
£15,375 to be fixed in nominal terms until
2010–11.c
Loans to be state- subsidised.
Zero real interest rate.
Debt forgiveness after 25 years.
9% of income above £15,375. To be fixed in nominal terms until
2010–11.
Loans to be provided by a not-for-profit corporation financed by commercial banks. 4.0%–5.5% real interest rate (6.5%–8% nominal). Debt forgiveness after 25 years.
9% of income above £15,375. To be fixed in nominal terms until
2010–11.
Loans to be state-subsidised.
Zero real interest rate.
The proposed reforms
15 Table 3.1 continued
Measures Labour’s proposals**
Conservatives’ proposals
Liberal Democrats’
proposals
GRANT Means-tested
maximum of £2,700 p.a. comprised of: (a) £1,200 if family
income <£22,560. Tapered to zero at family
income of £33,560
plus
(b) £1,500 if family income <£15,970. Tapered to zero at family
income of £22,100.d
Means-tested maximum of £1,500 p.a. if family
income <£15,970. Tapered to zero at family income of
£22,100.
Means-tested maximum of £2,000 p.a. if family
income <£15,970. Tapered to zero at family income of
£22,100.
BURSARIES Minimum of £300 p.a. if
family income <£15,970
and university charges
fees of £3,000 p.a.e
N/A N/A
* Unless otherwise stated, all proposals relate to academic years from 2006–07. All figures have been converted to 2006–07 prices using an inflation rate of 2.5% per year.
** Not all of the proposed Labour reforms would affect existing students. Top-up fees, bursaries, grants and debt write-off would apply to new students only from 2006–07. Fee loans and maintenance loans would apply to new and existing students from 2006–07. The fee loan entitlement for existing students would be equivalent to the fees they are liable for (i.e. up to £1,200 p.a.). It is unclear whether the reduction in the maintenance loan for new students that some would incur due to the increased grant of £2,700 would also apply to existing students, none of whom would be
entitled to the increased grant (see, however, www.dfes.gov.uk/studentsupport/students/200_2006_entry.shtml).
Note further that the repayment threshold of £15,000 under the Labour system will apply to all borrowers from April 2005.
a. Throughout this table, non-parenthesised figures refer to first- and second-year students and parenthesised figures refer to final-year students. For more details of loan amounts in the government’s proposed system, see Dearden, Fitzsimons and Goodman (2004a).
b. Conservatives have not yet finalised the loan differentials for first- and second-year and final-year students. Furthermore, it is likely that the value of maintenance loans under the Conservatives’ system would vary by
London/non-London student status and by whether the student lives at or away from home. Details yet to be finalised by the Conservative Party.
c. The threshold being fixed in nominal terms means that its real value would be eroded over time. Starting from a value of £15,375 in 2006–07 prices (£15,000 in 2005–06 prices), its value in 2009–10, based on an expected inflation rate of 2.5% per annum, is £13,925 in 2006–07 prices.
d. The exact details of the thresholds and tapers relating to the combined grant and maintenance loan are yet to be determined, but some indicative figures are provided in Department for Education and Skills (2004c).
e. Any university charging fees of over £2,700 would be obliged to provide bursaries to cover the remaining fee due above that level, for students from the poorest backgrounds.
3.2 Labour
Party
proposed
reforms
The Labour Party’s reforms were set out in the White Paper (Department for Education and Skills, 2003) and the Higher Education Act 2004 (see column 1 of Table 3.1).16 The reforms
are now partially implemented, though many of the most substantial changes are not due to come into effect until academic year 2006–07.
The Labour funding system would see the abolition of upfront tuition fees for all students and the introduction of variable fees of up to £3,000 a year for new students from 2006–07. Graduates would be entitled to a subsidised Graduate Contribution Scheme loan equal to the value of their fees. Graduates from 2009–10 would contribute 9% of any earnings above £13,92517 each year towards repaying the loan. The outstanding value of the loan would rise
each year in line with inflation, with any sum remaining unpaid after 25 years to be written off.
While at college, students from the poorest backgrounds would receive a bursary of at least £300 a year if the university charged full top-up fees.18 Students from families with incomes
of up to £33,560 would receive a means-tested grant of up to £2,700 a year. Students would also be entitled to a means-tested loan of up to £4,40519 (for those living away from home and
outside London) to help cover living costs. The repayment terms for maintenance loans would be the same as those for fee loans.
The proposals give the poorest students the option to avoid incurring debt for any fees that universities may choose to charge, through providing a maintenance grant of £2,700 p.a. and requiring universities to pay out bursaries to cover any outstanding fees. However, this money need not be put towards fees, as all students would have the option of taking out subsidised loans to pay for fees. If students exercised this option, they would be left with more money to put towards living expenses. The upper parental income threshold at which entitlement ceases is £22,100 p.a. for the £1,500 element and £33,560 p.a. for the additional £1,200 grant.20
16
All of the proposals are brought together in the Regulatory Impact Assessment (RIA) (Department for Education and Skills, 2004b). From here on, we use the term ‘Higher Education Act’ to denote all of the proposals as laid out in the RIA.
17
This is the value of a £15,000 threshold in 2009–10, expressed in 2006–07 prices (see note c to Table 3.1).
18
This means that any university charging fees of over £2,700 would have to provide bursaries equivalent to the fee cost above that level, to students from the poorest backgrounds.
19
However, this amount would only be available to students with parental income of exactly £33,560. For students with parental income below £26,000 or above £44,000, the maintenance loan would be £3,555 or £3,305 respectively. From parental income of £26,000, it would gradually increase from £3,555 up to £4,405 at parental income of £33,560. It would then gradually decrease to £3,305 at parental income of £44,000. This quirk in the tapering has arisen as a means of maintaining cost neutrality after the conversion of the £1,200 fee exemption into an upfront grant (for those eligible for the fee exemption).
20
The proposed reforms
17
3.3 Conservative Party proposed reforms
The way in which the Conservatives’ system would operate is set out in column 2 of Table 3.1. The most notable aspect of the reforms would be the complete removal of all tuition fees – both the basic fee currently paid by university students and any top-up fees universities might choose to charge from 2006–07.
Since loans would no longer be required to cover tuition fees under the Conservatives, loans would be available to cover maintenance only. The borrowing limit would be lifted to £5,000 per year for all students, regardless of family income. Rather than government-backed zero-real-interest-rate loans, the loans would be available from a not-for-profit corporation financed by commercial banks at a market interest rate. The Conservatives presently estimate that the market loans would charge a nominal interest rate of between 6.5% and 8% (equivalent to around a 4% to 5.5% real interest rate), with 8% being the upper threshold for the lifetime of the next Parliament.21
Further, banks would also be able to offer students the choice of a fixed or flexible rate.
Despite carrying a real interest rate, this new form of debt would differ from standard bank loans in so far as its repayment schedule would be income-contingent and outstanding debt would be written off after 25 years. Repayments would be scheduled at 9% of earnings above a threshold of £13,925 p.a.22
Therefore monthly debt repayment amounts would be the same as under the Labour system, but the length of time to repay the same loan would be longer.23
The Conservative plans also include the introduction of a grant up to a maximum of £1,500 p.a. for the poorest students, i.e. those with annual parental income below £22,100.
3.4 Liberal
Democrat
Party proposed reforms
The Liberal Democrats also propose to remove all tuition fees. Students whose parental income is below £22,100 would receive a means-tested grant of up to £2,000 a year. Students would also be entitled to a means-tested loan of at least £3,225 (for those living away from home and outside London) to help cover living costs. Repayments would carry a zero real interest rate and would be fixed at 9% of earnings above a threshold of £13,925 p.a.24
Outstanding debt would be written off after 25 years.
21
The Conservatives plan to take out insurance in the financial markets that will ensure that the interest rate charged to students cannot rise above 8% during the lifetime of the next Parliament, and they ‘do not expect this to rise thereafter’ (see Conservative Research Department (2004)).
22
See footnote 17.
23
This assumes that graduates choose to repay no more than the minimum 9% repayment required. However, as the loan is not subsidised, there is more incentive for graduates to make voluntary repayments.
24
Before proceeding, it is worth pointing out that the key ways in which the three sets of proposals differ from each other relate to fundamental principles concerning fees and loans. Grants on the other hand, are included in all proposals and differ across systems only in their generosity. The complete abolition of tuition fees – as in the Conservative and Liberal Democrat systems – would essentially close down the market for university courses, which would be allowed to operate under a Labour system through the variable element inherent in the fee proposals.25
Before we consider the likely effects of the various proposals on students and graduates (Chapters 6 and 7), we first provide more details of the costs of these reforms and who will pay for them (Chapter 4) and discuss the funding implications for universities (Chapter 5).
25
The Office for Fair Access in a press release on 17 March 2005 has estimated that 91% of Higher Education Institutions and Further Education Colleges are planning to charge the full tuition fee of £3,000
19
4. What the reforms would cost, and who
would pay
4.1 What do the reforms mean for the taxpayer?
Relative to the £6.3 billion cost to the taxpayer of the 2003–04 system, the Conservative plans would cost an extra £1.1 billion, Labour’s an extra £1.3 billion and the Liberal Democrats’ an extra £2.2 billion.
We first set out the composition of the taxpayer costs of the 2003–04 system, for reference, before outlining the details of the public spending implications of each party’s reforms. We then look more broadly at what the reforms would cost and who would pay for them.
How much does the taxpayer contribute to the 2003–04 (base)
system?
The base system, if in place in 2006–07, would cost the taxpayer approximately £6.3 billion per year, restricting our analysis to the costs of teaching and to higher education institutions in England only. These costs are made up of approximately:
• £4,800 million in subsidies for teaching;
• £450 million in fee remissions;
• £1,000 million in maintenance loan subsidies.
(See Table 4.1, and accompanying notes, for sources.)
4.2 Labour’s
proposals
The additional spending implied by Labour’s plans compared with the 2003–04 system all arises from increases to student and graduate support, and none arises from giving more subsidies direct to universities (see Table 4.1):
• The most significant additional public spending contained in Labour’s plans is the cost of new fee loan subsidies. Although official government estimates of this cost are now out of date,26
the Liberal Democrats estimate the cost at around £800 million, under plausible assumptions (see notes to Table 4.1, and Appendix B).
26
• Labour’s plans also include increasing the maximum maintenance loan, which the Department for Education and Skills has costed at £70 million.27
• Approximately £420 million additional spending would be paid out in grants. This covers the £1,500 grant introduced in 2004–05. The additional grant that would come into effect in 2006–07 when top-up fees become payable (the ‘Single Combined HE Grant’) has been designed to cost the same to the taxpayer as the current fee remission already included in the 2003–04 system, and so no additional costs for this are included here. In total, Labour’s plans imply additional public expenditure compared with the 2003–04 system of around £1.29 billion per year. The overall cost of the system to the taxpayer would rise to around £7.6 billion per year.
It is also worth pointing out that Labour’s plans also include raising the repayment threshold on maintenance loans from £10,000 to £15,000.28
According to the Regulatory Impact Assessment for the Higher Education Bill and White Paper proposals (Department for Education and Skills, 2004b), ‘from 2005 we will raise the threshold at which loans start to be paid back from £10,000 to £15,000 per year, to make repayment less burdensome’.
However, the same document also suggests that this will be at no additional cost to the exchequer:
Raising the threshold from £10,000 to £15,000 will increase the cost of student loans to Government. From April 2010 it is intended that it should increase in line with inflation. However, since the cost of the current loans is assessed on the basis that the threshold will rise in line with earnings growth, there are offsetting savings associated with up-rating by inflation instead. The combined effect of the two is expected to be a small net saving in cost to Government over the period during which variable fees will be introduced.
Department for Education and Skills, 2004b
These statements suggest that in raising the repayment threshold, there are in fact two separate policy reforms being introduced:
• The repayment threshold is being raised from £10,000 to £15,000, at a cost to the exchequer (since students spread their repayments over a longer period of time and at zero real interest, gaining a bigger subsidy).
• The default method of indexation is being changed from earnings indexation to price indexation. This will mean an overall gain to the exchequer (since above-inflation earnings growth will mean that students will repay their loans faster, gaining a smaller subsidy).
According to the government’s calculations, the overall revenue effects of these two policy measures should cancel each other out.
27
This additional maintenance loan subsidy cost estimate is based on DfES costings produced before the announcement of the conversion of the fee remission into the Single Combined HE Grant, and the subsequent rescaling of fee and maintenance loans to ensure that the conversion would be cost-neutral. Such rescaling will affect the balance of costs between fee and maintenance loan subsidies, but not their overall cost to the taxpayer.
28
Costs of the reforms
21
Two points need to be raised about this issue. First, the repayment threshold has remained fixed in nominal terms at £10,000 since the introduction of income-contingent loans in 1998. This means that the threshold has not been uprated even with inflation, let alone earnings, at an annual saving to the exchequer. This apparent deviation from ‘default’ indexation has not, as far as we are aware, been accompanied by any policy announcements.
Second, it is highly misleading to describe the policy as one that ‘make[s] repayment less burdensome’, since its overall revenue neutrality would suggest that this is not the case.
4.3 The Conservatives’ proposals
The Conservatives incur some extra public spending compared with the 2003–04 system, but also make some savings. In Table 4.1, we set out the Conservative estimates of the costs that they would incur:
• The majority of the new expenditure is incurred as a result of increasing the taxpayer subsidy to universities, in order to guarantee ‘fee replacement’; this is designed to cover the revenue that universities would lose from the removal of basic tuition fees, and the revenue they would have gained if top-up fees were introduced. The overall cost of fee replacement is estimated by the Conservatives at around £1.8 billion per year. Since the taxpayer already contributes around £450 million in fee remission, this implies a net addition of £1.35 billion. It is important to note that this level of fee replacement would only be enough to replace the revenue raised if:
− three-quarters of all universities charged the full top-up and a quarter charged only the basic fee; and
− the number of students assessed for fees remains the same as in 2003–04
(See illustrative costs set out in Department for Education and Skills (2004b).)
However, it seems that 91% of universities now plan to charge the full top-up in 2006– 07;29 it is also likely that student numbers will have increased by 2006–07, making this
level of fee replacement a partial, rather than full, fee replacement.30 If the Conservatives
wanted to guarantee full fee replacement (and they have made no announcements that they would), this would imply additional public expenditure – of up to £330 million – according to the latest available estimates. This estimated addition, however, does not take into account the effect of increased student numbers on the required level of fee replacement.
• In addition to (possibly partial) fee replacement, the taxpayer would provide new money to universities by gifting the outstanding value of the Student Loan Book to the university sector, a public asset estimated by the Conservatives to be worth £380 million per year if kept in public hands.31 We include the total annual equivalent here, though some is likely
29
See footnote 25.
30
For example, if student numbers remain the same, but all universities charge full top-up fees, then the Conservatives would provide 84% of full fee replacement with this public expenditure allocation.
31
to be tied to capital rather than teaching expenditure (see Conservative Research Department (2004)).
• The Conservatives would also continue to pay out the £1,500 grant that was introduced by Labour in 2004–05, at an estimated cost of £420 million.
Offsetting these costs are the following savings relative to the 2003–04 system:32
• The Conservatives would completely remove maintenance loan subsidies, worth around £1 billion per year.
In total, the Conservatives’ plans imply additional public expenditure compared with the 2003–04 system of around £1.1 billion per year. The overall cost of the system to the taxpayer would rise to around £7.4 billion per year.33
4.4 The Liberal Democrats’ proposals
The additional public expenditure implied by the Liberal Democrats’ plans relative to the 2003–04 system amounts to:
• Fee replacement of £2.13 billion, less £450 million in fee remissions already in place, amounting to £1.68 billion. This is more than in the Conservatives’ plans, above, since the Liberal Democrats assume that all universities would charge the full top-up fees for all courses, and have designed their level of funding to compensate universities fully for this. However, the funding level is based on what university revenue would have been in 2003–04 if top-up fees were charged then, and therefore does not take into account any increases in student numbers since 2003–04.
• Around £560 million in grant expenditure, to cover a £2,000 grant (assuming a cost 33.3% higher than the cost of a £1,500 grant).
In total, the Liberal Democrat plans imply additional public expenditure compared with the 2003–04 system of around £2.2 billion per year. The overall cost of the system to the taxpayer would rise to around £8.5 billion per year.
It should be noted that the Liberal Democrats also plan for an extra £200 million additional spending in Wales, Scotland and Northern Ireland, which would be required by the Barnett Formula rules. These dictate how additional public expenditure in England must be matched in the devolved authorities (sometimes referred to as the Barnett Consequential). However, we consider only the funding implications of changes to English universities and so do not include this cost here.
32
The Conservatives argue that they would make savings of £40 million in administrative costs from handing all student loans to the private sector. However, it is not clear to us that this is not already included in the £1 billion loan subsidy outlined below, so we do not include it as an additional saving.
33
Costs of the reforms
23
Table 4.1. Taxpayer costs of Labour, Conservative and Liberal Democrat proposals (relative to 2003–04 baseline, in 2006–07 prices)
2003–04 base system
Public funding for teaching at English universities £4,820ma
Fee remission £450mb
Maintenance loan subsidies £1,030mc
Total taxpayer cost of 2003–04 system in 2006–07 £6,300m
Costs of the Labour plans
New fee loan subsidies £800md
Increased maintenance loan subsidies £70me
Introduction of £1,500 grant £420mf
Net additional costs of the Labour plans £1,290m
Total costs of Labour system in 2006–07 £7,590m
Costs of the Conservative plans
Additional allocation towards fee replacement £1,350mg
Introduction of £1,500 grant £420mh
Gifting the Student Loan Book £380mi
Savings from the Conservative plans
Scrapping maintenance loan subsidies –£1,030mj
Net additional costs of the Conservative plans £1,120m
Total costs of Conservative system in 2006–07 £7,420m
Costs of the Liberal Democrat plans
Additional allocation towards fee replacement £1,680mk
Introduction of £2,000 grant £560ml
Net additional costs of the Liberal Democrat plans £2,240m
Total costs of Liberal Democrat system in 2006–07 £8,540m
Note: Figures are for public spending per year and are rounded to nearest £10 million.
a. Total taxpayer contribution in 2006–07 is based on Higher Education Funding Council for England (HEFCE) grant letter 2005, which allocates £4,817 million to HEFCE and the Teacher Training Agency (TTA) in recurrent resources in 2006–07 (i.e. does not include research or capital funding).
b. HEFCE grant letter 2005 shows expected public contribution to fees in 2005–06 was £434 million; we have uprated this to £450 million in 2006–07 prices (in line with inflation of 2.5%).
c. Based on student loans Resource Account Budget (RAB) charge of £1,026 million in 2005–06 from Department for Education and Skills (2004d, p. 26).
d. Costs estimated by Liberal Democrats at £800 million. The Liberal Democrats assume that all universities charge full top-up fees, resulting in total fee revenue of £2.13 billion. They assume 90% take-up of loans, and an average 40% subsidy, resulting in £770 million in fee loan subsidy. They estimate an additional £30 million for debt write-off after 25 years. See Appendix B for more details.
e. DfES estimate; see Appendix B.
f. Cost of £1,500 grant estimated by DfES at £420 million. Note that conversion of fee remission into Single Combined HE Grant, maximum value £2,700, is revenue-neutral compared with the 2003–04 system, so is not included here.
g. Authors’ calculation based on Conservative estimate, source below. This figure matches the £1.8 billion estimated revenue that would have been raised in 2003–04 if 75% of universities charged £3,000 and 25% charged just the basic fee, which was £1,125 in 2003–04, as set out in Department for Education and Skills (2004b, point 50), less approximately £450 million in fee remission which is already paid in the 2003–04 system (see note b).
h. Conservative estimate, source below. Conservative estimate of £420 million matches DfES costing (see note f). i. Conservative estimate, source below.
j. Matches student loans Resource Account Budget (RAB) charge of £1,026 million in 2005–06 from Department for Education and Skills (2004d, p. 26).
Notes to Table 4.1 continued
k. Provided by Liberal Democrats, source below. Calculated on same basis as Conservative allocation (see note g) but on the assumption that 100% of universities charged £3,000 as set out in Department for Education and Skills (2004b, point 50), less £450 million fee remission.
l. IFS calculation based on scaled-up cost of £1,500 grant (see note f): £560 million = 1.33333×£420 million.
Sources:
Conservatives: Conservative Research Department (2004). Key figures set out in Appendix B. Labour: DfES costings given to IFS in January 2004 and set out in Appendix B.
Liberal Democrats: Liberal Democrats (2004) and private correspondence with Liberal Democrats. See Appendix B.
Summarising the differences between the parties, this suggests that Labour’s and the Conservatives’ plans would cost a similar amount to the taxpayer, at around £1.1 billion per year under the Conservatives and around £1.3 billion under Labour, whilst the Liberal Democrats’ plans would cost about £1 billion more than this.
4.5 A circular flow of payments
Another way of understanding how the parties’ systems differ is to consider flows of payments from taxpayers and other parties to universities, students and graduates. We first set out the implied payments to and from universities, students, taxpayers and graduates of each of the systems (in Tables 4.2–4.5), before going on to examine the differences between them (Table 4.6).
Under the base system, set out in Table 4.2, universities are net gainers, both from direct taxpayer subsidies and fee remissions (around £5.3 billion) and from direct student contributions (around £500 million). Graduates also gain, from subsidies on maintenance loans, worth around £1 billion per year (these subsidies compare with total maintenance loan borrowing of around £2.7 billion each year, not shown on this table).
Taxpayers contribute the most to these gains, at around £6.3 billion, whilst student contributions make up just a small part of the total.
Table 4.2. Flows of funding between universities, students, taxpayers and graduates under the 2003–04 (base) system
Payment to →
Payment from ↓
Universities Students Taxpayers Graduates Gross
payments from
Universities - - -
Students £520ma - - - £520m
Taxpayers £5,270mb - - £1,030mc £6,300m
Graduates - - -
Gross payments to £5,790m - - £1,030m
Net payments to +£5,790m –£520m –£6,300m +£1,030m
Notes: Figures rounded to nearest £10 million and in 2006–07 prices.
Costs of the reforms
25
Table 4.3. Flows of funding between universities, students, taxpayers and graduates under Labour’s system
Payment to →
Payment from ↓
Universities Students Taxpayers Graduates Gross
payments from
Universities - £70ma - - £70m
Students - - - - -
Taxpayers £4,820mb £870mc - £1,900md £7,590m
Graduates £2,130me - - - £2,130m
Gross payments to £6,950m £940m - £1,900m
Net payments to +£6,880m +£940m –£7,590m –£230m
Notes: Figures rounded to nearest £10 million and in 2006–07 prices.
a. Cost of bursaries estimated at £300×0.33333×720,000 = £72 million, based on assumptions that all universities
charge the full top-up and that one-third of students assessed for fees, or around 240,000, are eligible. b. Total taxpayer contribution in 2006–07 of £4,817 million (as in note a to Table 4.1).
c. £420 million cost of £1,500 grant (see note f to Table 4.1), plus £450 million value of fee remission (see note b to Table 4.1) to be converted into grant.
d. Value of maintenance loan subsidy at £1,030 million (see note c to Table 4.1), plus estimated cost of new fee loan subsidies at £800 million and higher maintenance loans at £70 million.
e. Fees payable to universities if 100% charge full top-up, calculated on the same basis as note k of Table 4.1 but without subtracting fee remission.
The flows of funds implied by Labour’s proposed system are set out in Table 4.3. Universities again are net gainers in this system, but this time their income is made up of contributions from graduates and taxpayers rather than students and taxpayers, since all fees are now deferred. Students are also net gainers from this system, due to new bursaries and grants and the conversion of fee remissions into grants.
Graduates become net payers into this system, since they must now pay up to £2.1 billion in deferred fees (based on the assumption that all universities charge the full top-up). The taxpayer contribution to this system is around £7.6 billion, comprised of direct payments to universities and payments to students (grants) and graduates (loan subsidies).
Table 4.4. Flows of funding between universities, students, taxpayers and graduates under the Conservatives’ system
Payment to →
Payment from ↓
Universities Students Taxpayers Graduates Gross
payments from
Universities - - -
Students - - -
Taxpayers £7,000ma £420mb - - £7,420m
Graduates - - -
Gross payments to £7,000m £420m - -
Net payments to +£7,000m +£420m –£7,420m -
Notes: Figures rounded to nearest £10 million and in 2006–07 prices.
a. Total taxpayer contribution in 2006–07 of £4,817 million (as in note a to Table 4.1), plus £1,350 million
Conservative additional fee replacement (see note g to Table 4.1), plus £450 million existing fee remission (see note b to Table 4.1) and £380 million per year through gifting of Student Loan Book (see note i to Table 4.1).
Table 4.4 shows the flows of funds implied by the Conservative system. Universities are net gainers, but in this system all their payments come directly from the taxpayer. Students gain from the payment of the maintenance grant, but graduates no longer receive maintenance loan subsidies and so do not pay in, nor do they take money out of this system.
Table 4.5 shows that in the Liberal Democrat system, university funding again comes entirely from the taxpayer. Students gain from the payment of the maintenance grant, whilst graduates also receive maintenance loan subsidies; the taxpayer is hence the only net contributor to this system.
Table 4.5. Flows of funding between universities, students, taxpayers and graduates under the Liberal Democrats’ system
Payment to →
Payment from ↓
Universities Students Taxpayers Graduates Gross
payments from
Universities - - -
Students - - -
Taxpayers £6,950ma £560mb - £1,030mc £8,540m
Graduates - - -
Gross payments to £6,950m £560m - £1,030m
Net payments to +£6,950m +£560m –£8,540m +£1,030m
Notes: Figures rounded to nearest £10 million and in 2006–07 prices.
a. Total taxpayer contribution in 2006–07 of £4,817 million (as in note a to Table 4.1), plus £1,680 million Liberal Democrat additional fee replacement (see note k to Table 4.1), plus £450 million existing fee remission (see note b to Table 4.1).
b. Based on estimated cost of £2,000 student grant (see note l to Table 4.1). c. Cost of maintenance loan subsidy (see note c to Table 4.1).
Table 4.6 further synthesises the figures from Tables 4.2–4.5, comparing net payments under all three systems with the net payments in the base system (i.e. the bottom rows of Tables 4.2–4.5). This allows us to see more clearly how net flows to universities, taxpayers, graduates and students compare under all three systems. Reading along the rows, we can see that:
• Universities’ net position would improve under all three systems, by a very similar
amount, rising by between £1.1 billion and £1.2 billion under the proposed reforms, from £5.8 billion under the base system to around £6.9–£7 billion. For more on the implications for universities, see Chapter 5.
• In all three parties’ proposed systems, the overall taxpayer contribution to the costs of HE would rise compared with the base system. Compared with the taxpayer contribution of £6.3 billion under an unchanged 2003–04 system, the Conservatives’ proposals would require an additional £1.1 billion, or around £7.4 billion of taxpayer funds, Labour’s an additional £1.3 billion, or around £7.6 billion, and the Liberal Democrats’ an additional £2.2 billion, or around £8.5 billion (this was also shown in Table 4.1).
• Students would also be better off under the proposed systems – by the most under
Costs of the reforms
27
Table 4.6. Net gainers and losers from the three parties’ proposals, compared with the 2003–04 system
Labour Conservatives Liberal Democrats
Universities +£1,090m +£1,210m +£1,160m
Students +£1,460m +£940m +£1,080m
Taxpayers –£1,290m –£1,120m –£2,240m
Graduates –£1,260m –£1,030m -
Sums of gains and losses £0 £0 £0
Source: Authors’ calculations based on Tables 4.2–4.5.
• One major difference between the parties’ proposals is the position of graduates. They would be asked to contribute more both under Labour and under the Conservatives, by more than £1 billion in each case, but not under the Liberal Democrats. For more on the implications for graduates, see Chapter 7.
Table 4.6 also allows us to see who would pay for any gains within each party’s proposed system. Reading down the columns, the table shows that under all three parties, both universities and students are set to gain from the proposals, by varying amounts. However, who pays for these gains differs across the parties:
• Under Labour, the gains would be paid for in part by graduates, through higher fees, and in part by the taxpayer, through increased loan subsidies. These loan subsidies benefit lower-earning graduates the most.
• Under the Conservatives, the gains would again be paid for in part by graduates, this time through reduced loan subsidies (with their removal affecting the lowest-paid graduates the most), and in part by taxpayers, through bigger payments direct to universities.
• Under the Liberal Democrats, all the gains would be paid for by taxpayers, with no additional contributions from graduates at all.
Table 4.7. The balance between public and private contributions to tuition costs under the different systems
2003–04 base system
Labour Conservatives Liberal Democrats
Taxpayers £5,270m £5,620ma £6,970m £6,950m
% 91% 81% 100% 100%
Students £520m - - -
% 9% - - -
Graduates - £1,330m - -
% - 19% - -
Total £5,790m £6,950m £6,970m £6,950m
A final analysis allowed by these figures is of how the student, graduate and taxpayer contributions to HE fundin