2
This publication includes analysis of the National Pupil Database (NPD): https://www.gov.uk/government/collections/national-pupil-database
The Department for Education is responsible for the collation and management of the NPD and is the Data Controller of NPD data. Any inferences or conclusions derived from the NPD in this publication are the responsibility of the Education Policy Institute and not the Department for Education.
ISBN: 978-1-909274-54-9
Published June 2018 Education Policy Institute.
3
About the author
Jon Andrews is Director for School System and Performance and Deputy Head of Research at the Education Policy Institute. As well as publishing a number of reports on the expansion of the academies programme he has co-authored reports on free schools, grammar and faith schools, school funding, the disadvantage gap, and world class standards. Prior to joining EPI, Jon worked in the Department for Education from 2003 to 2016, most recently heading the Department’s Revenue Funding Analysis Unit.
About the Education Policy Institute
The Education Policy Institute is an independent, impartial, and evidence-based research institute that promotes high quality education outcomes, regardless of social background. We achieve this through data-led analysis, innovative research and high-profile events.
Education can have a transformative effect on the life chances of young people, enabling them to fulfil their potential, have successful careers, and grasp opportunities. As well as having a positive impact on the individual, good quality education and child wellbeing also promotes economic productivity and a cohesive society.
Through our research, we provide insight, commentary, and a constructive critique of education policy in England – shedding light on what is working and where further progress needs to be made. Our research and analysis spans a young person's journey from the early years through to entry to the labour market.
Our core research areas include:
▪ Benchmarking English Education
▪ School Performance, Admissions, and Capacity
▪ Early Years Development
▪ Vulnerable Learners and Social Mobility
▪ Accountability, Assessment, and Inspection
▪ Curriculum and Qualifications
▪ Teacher Supply and Quality
▪ Education Funding
▪ Higher Education, Further Education, and Skills
5
Contents
About the author ... 3
About the Education Policy Institute ... 3
Foreword ... 6
Executive summary ... 8
Results ... 9
Recommendations ... 11
Part 1: The policy context ... 13
The Labour governments of 1997-2010 ... 13
The Coalition Government of 2010-2015 ... 13
David Cameron’s Conservative government 2015-16 ... 13
Theresa May’s Conservative governments, 2016 onwards ... 14
The number of academies, academy trusts and their structure ... 15
Existing evidence on academy performance ... 16
Part 2: Methodology ... 17
Previous approaches to measuring academy chain and local authority performance ... 17
Mainstream schools ... 17
Special schools ... 27
Stability of cohorts ... 30
Part 3: Results ... 31
Mainstream primary schools (Key Stage 2) ... 31
Secondary schools (Key Stage 4) ... 37
Comparisons across key stages ... 42
Stability of cohorts ... 43
Performance of disadvantaged pupils ... 47
Provision for those with special educational needs and disabilities ... 49
Part 4: Policy implications ... 51
Recommendations ... 53
Annex 1: Complete tables at Key Stage 2 ... 55
Annex 2: Complete tables at Key Stage 4 ... 66
Annex 3: Pupils with special educational needs and disabilities – Key Stage 2 ... 76
6
Foreword
The Education Policy Institute is an independent, impartial and evidence based research institute which aims to promote high quality education outcomes for all, through analysis that both informs and influences the policy debate in England and internationally.
Over the last 20 years, one of the biggest changes in English education has been the growth of the academies programme. By the end of 2016/17 academic year, over two thirds of state-funded secondary schools and over a quarter of state-funded primary schools had academy status. A rigorous evaluation of the performance of the overall academies programme, and of individual academy operators, has generally lagged behind the growth of the programme. But over the last two years the Education Policy Institute has published analysis by its own researchers, and in partnership with the London School of Economics, which allows a much better understanding of the impact of the academies programme on pupil attainment – both at a system level and for each (larger) academy chain.
The system level research is clear that the early sponsor academies programme under the 1997-2010 Labour government was successful in raising attainment compared with a similar “control” group of schools. But the rapid expansion of the academies programme since 2010 seems to have had little material impact on overall attainment, measured against a control group of schools. This publication –“School Performance in Academy Chains and Local Authorities 2017” – does not explicitly seek to return to the comparative analysis of local authority schools and academy chains at a system level. Instead it seeks to fairly assess the performance of different groups of schools, in academy chains and in local authorities – building upon a similar EPI analysis carried out in 2016, but using an improved methodology.
The EPI research looks at both the current performance and rate of improvement of groups of schools, in order to establish the relative impact of different chains and local authorities. To ensure that comparisons between groups of schools are fair, EPI researchers have used a contextual measure of performance, which seeks to adjust for the different progress and outcomes of pupils with different characteristics. This ensures that what is measured is the impact of school quality, rather than the characteristics of school admissions.
As in 2016, this report shows the extent of variability of performance by academy chain and local authority. Academy chains and local authorities appear both at the top and the bottom of the performance tables. For students, it is more important to be in a high performing schools group, whether academy or local authority, than to be in an academy or local authority school in
general. At Key Stage 4, the average student in one of the top performing chains or authorities will achieve half a grade higher in each of their GCSEs than the average pupil in one of the lowest performing groups. The difference between the top and bottom performing groups at Key Stage 2 is equivalent to over a term’s progress.
7
However, this report suggests that many academy chains and local authorities at the bottom of the performance tables have been in this position for a number of years. This analysis could and should be used by policy makers to intervene more effectively against persistently underperforming school groups, as well as to learn any lessons from the highest performing school groups.
Rt. Hon. David Laws
8
Executive summary
Academies are state-funded schools that sit outside of the control of local authorities. The
introduction of academies (including free schools, university technical colleges and studio schools), has been one of the biggest changes to the English education system of the last few decades. In March 2016 the Department for Education announced that it intended that all schools should become academies, or be in the process of becoming one, by 2020. However, the wider political changes in that time and the challenges of passing the necessary legislation have contributed to a scaling back of this ambition, with a greater political focus on other structural reforms such as expanding academic selection and increasing the number of faith based schools.
Nevertheless, over two thirds of state-funded secondary schools and over a quarter of state-funded primary schools and special schools were academies by the end of the 2016/17 and those
proportions continue to increase. Three quarters of academies and free schools are part of a multi-academy trust. Our previous research has demonstrated that there is little difference in the performance of academies and local authority maintained schools when viewed at a system level. The early sponsored academies (opened under the Labour government) demonstrated
improvements equivalent to one grade in each of five GCSE subjects.1 However, the impact of later
sponsored academies was less conclusive with small improvements prior to opening (equivalent to one grade in one subject) continuing in the year after opening and then tailing off. Increases of one grade in one subject were also seen in schools rated as ‘outstanding’ that became converter
academies but there was no such increase seen in schools previously rated as ‘good’ or ‘satisfactory’. Such discussion about the performance of different school types taken at an aggregate level tells us little about the considerable variation in the performance of individual academy chains and local authority areas. This report sets out to do that. It provides the latest performance data at academy chain and local authority level utilising a new methodology, including presenting results for pupils in special schools for the first time.
Our headline performance measures for mainstream provision examine the outcomes that pupils achieve having controlled for differences in pupil intakes (for example, prior attainment and levels of disadvantage) and, crucially, the historic performance of the school.
Within this context, historic performance means the outcomes the school was achieving before it joined the school group in question.2 This enables us to examine the impact that these groups are
having on raising attainment in comparison to other groups.
1 J. Andrews et al, ‘The impact of academies on educational outcomes’, July 2017
2 If a school has been with the academy chain or local authority for more than four years at Key Stage 2 or five
9
Results
Our findings continue to demonstrate the wide range of outcomes that are being achieved in different academy chains and local authorities. It remains the case that what matters most is being in a high performing school group, not being in an academy rather than a local authority
maintained school or vice-versa. This means, consistent with our research at system level, neither a move to a fully academised system, nor a return to a system of local authority oversight (for the vast majority of schools), is likely to lead to an increase in school standards by itself.
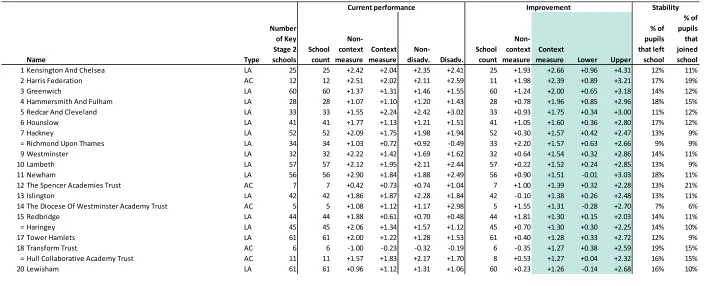
Amongst primary schools, pupils in high performing school groups achieve 2.2 more points on the new National Curriculum scale than pupils in low performing school groups, this is equivalent to
over a term’s progress.3 In fact, the very highest performing groups (those in the top 3) have scores
of +2.0 and above, meaning that pupils in those schools actually achieve a term’s more progress than they would in an averagely performing school group. Similarly, the very lowest performing groups (those in the bottom 3) have scores of -1.2 and below, meaning that pupils in those schools achieve half a term’s less progress than they would in an averagely performing school group. Local authorities make up 15 of the top 20 school groups at Key Stage 2. However, given the relative total number of local authorities and academy chains this means this is only slightly higher than would be expected. Authorities in London continue to outperform other areas of the country, with 14 of the 15 top local authorities being in the capital. Outside of London, Redcar and Cleveland was the highest performing local authority and was fifth overall. The highest performing academy chain is the Harris Federation with a score of +2.5. The Harris Federation was also the highest performing primary chain in our 2015 measures.
Amongst secondary schools, pupils in high performing school groups achieve the equivalent of half a grade more in each of their GCSEs than pupils in low performing groups.4 In fact, the very highest
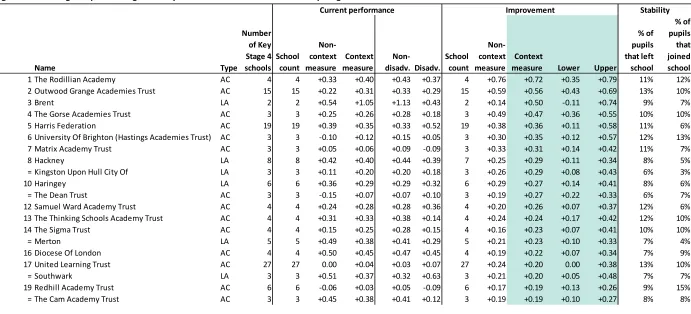
performing groups (those in the top 3) have scores of +0.5 and above, meaning that pupils in those schools actually achieve half a grade more in each GCSE subject than they would in an averagely performing school group. Similarly, the very lowest performing groups (those in the bottom 3) have scores of -0.4 and below, meaning that pupils in those schools actually achieve around two-fifths of a grade lower in each of their GCSE subjects than they would in an averagely performing school group. Academy chains are disproportionately found amongst the top 20 of secondary school groups. Fourteen of the top 20 are academy chains. Of the six local authorities that are in the top 20, five are in London. The highest performing academy chain is the Rodillian Academy. The highest performing large trusts are Outwood Grange and Harris. Outwood Grange was also in the top five on our 2015 measure.
This report highlights a number of cases of sustained underperformance amongst academy chains, as well as the now dynamic nature of governance arrangements, with schools moving between different academy chains.
3 Taken as being the school groups at the 5th and 95th percentiles. At Key Stage 2 this equates to the groups in
13th and 224th place.
4 Taken as being the school groups at the 5th and 95th percentiles. At Key Stage 4 this equates to the groups in
10
Since our previous report, the Department for Education (DfE) has continued the process of moving academies from underperforming academy chains through the process known as academy
rebrokerage. In some instances, this relates to individual academies. In others, a number of schools may be moved from an academy trust at one point, and in some cases the whole trust itself may be closed.
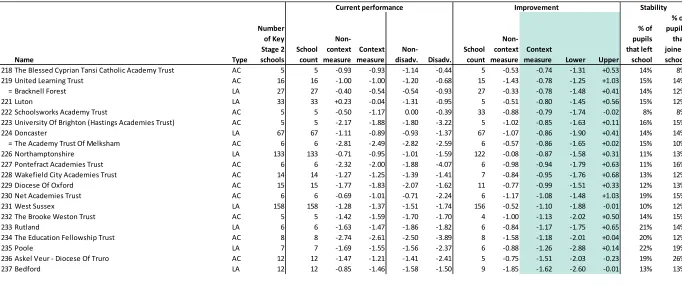
At Key Stage 2, the lowest performing academy chains include Wakefield City Academies Trust and the Education Fellowship Trust. Both of these trusts have subsequently relinquished all of their schools. The Education Fellowship Trust was in fact the lowest performing of any school group in our 2015 measures, and also amongst the lowest performers at Key Stage 4. The lowest performing group at Key Stage 4 was Bright Tribe, which in February of this year relinquished all but one of its schools in the north of England whilst keeping its schools in the south.5
The option to close down poorly performing trusts and move schools to new providers is one of the potential strengths of the academy system. It offers a flexibility that is not possible with a purely local authority based system with its inevitable geographical constraints.
However, in some cases the process of rebrokerage has been slow (in the case of the Education Fellowship Trust over a year), and such delays are likely to have a detrimental impact on schools in terms of teacher retention and recruitment and their admissions.
There is currently limited evidence on the performance of schools after rebrokerage. We will examine this as more data becomes available.
We find examples of trusts with sustained low performance where intervention has been more limited. For example, the Greenwood Academies Trust was the second lowest performing academy group at Key Stage 4 in 2015 and fourth lowest performing in 2017. In 2017 it was announced that two of its schools were to be rebrokered; to date only one has.6
We also find cases of sustained underperformance amongst local authorities.
The 2015 results identified a number of local authorities with particularly low performing schools at Key Stage 2. Amongst the bottom 10 groups were Kirklees, Dorset, Central Bedfordshire, Walsall, Rutland, and Poole.
In many cases, this under-performance continues. Out of 237 local authorities and academy chains, all but one of those local authorities that we previously identified as underperforming (Central Bedfordshire) still rank lower than 200th for school improvement.
It is a similar story at Key Stage 4. Nottingham, Newcastle-upon-Tyne and Wolverhampton – all previously in the bottom 10 – continue to appear towards the bottom of the rankings.
The levers available to the Department for Education to intervene in these local authority areas are limited. Having proposed measures to force academisation in local authority areas where performance was low in the 2016 white paper ‘Educational Excellence Everywhere’, the Department for Education dropped its proposals after political difficulties and changes. Intervention will remain at individual school level.
5 P. Allen-Kinross, ‘Bright Tribe relinquishes all but one of its northern schools’, Schools Week, March 2018.
11
Further work is required to understand the impact that academy chains and local authorities have on the quality of school places available to pupils with special educational needs and disabilities. This report highlights very wide variation in the Key Stage 2 and Key Stage 4 outcomes for these pupils across different school groups.
However, that in itself does not necessarily reflect variation in underlying effectiveness of those groups. Instead it could reflect wider variation in the type of provision being offered and the effect of individual pupils’ special educational need or disability on their educational outcomes.
Furthermore, a simple ‘league table’ of these results risks penalising those chains that are inclusive in nature whilst not providing results for those groups with low numbers of such pupils. We will continue to consider these measures further and have published the data we do have to encourage a wider debate.
Recommendations
Given the findings of this report, and our previous studies into the impact of academy chains and local authority schools, the Department for Education should:
1. Identify those academy chains where there is a significant risk of failure and build sponsor capacity in those geographical areas that are at risk from chain failure before it occurs
If the academy system is to function properly there needs to be a better understanding of where failure may happen in the future in order to ensure that capacity is available in other trusts before it occurs. The performance measures provided in this report, combined with measures beyond pupil outcomes (such as financial management), should provide a good basis for identifying such academy chains.
A simple data exercise will not necessarily be able to accurately predict the failure of an individual trust. However, by combining the results together it will be possible to identify areas of the country that are particularly vulnerable to failure – for example, by quantifying the number of school places that are in academy chains that may fail. Regional Schools Commissioners should focus on ensuring capacity is available in these areas should it prove necessary.
2. Allow capacity to be provided through high performing local authorities and allow them to take over schools from underperforming academy chains
Schools should continue to be allowed to remain within a local authority if they choose to do so. This is particularly the case where both the school and the local authority have been identified as high performing. This is a logical conclusion if we are to move away from full academisation. In some circumstances it may be appropriate for schools to return to local authority oversight in the same way that a school may be moved to a high performing academy chain. This would provide additional capacity within the system and would go some way to reducing the time taken for rebrokerage. 3. Challenge poorly performing local authorities and use school level interventions where possible
12
particularly how new single performance measures (in place of the dual floor standard and coasting school measure) might be constructed to reach those areas.
4. Continue to publish performance information at academy chain level and consider measures for local authorities too
If the system is to be effective it needs a good, and consistent, understanding of where high and low performance is occurring. The Department for Education is therefore right to continue to publish performance information at academy chain level.
However, given that we are now in a mixed system with a move away from a policy of full academisation, the Department for Education should reconsider its decision not to publish comparable information for local authorities (beyond published measures that include all schools, maintained and academy, within an area).
This should be developed further by:
▪ taking account of the context in which schools are operating, given the different intakes across different school groups;
▪ including results over a number of years so as to not immediately ‘reward’ school groups where poor performing schools are removed; and
▪ using historic measures that are relatively consistent over time even if they are not precisely what were used in performance tables in that year. This will give the Department greater flexibility in how it develops its measures and enable a longer time series to measure improvement over time.
13
Part 1: The policy context
Academies are state-funded schools that sit outside of the control of local authorities. The
introduction of academies (including free schools, university technical colleges and studio schools), has been one of the biggest changes to the English education system of the last few decades.
The Labour governments of 1997-2010
The first academies were opened in 2002, under Tony Blair’s Labour government. They were initially envisaged as raising educational standards in disadvantaged communities and areas of low
performance. By the end of the Labour government in May 2010, there were 203 academies in England. The vast majority of these had replaced previously failing local authority schools. Over this period some sponsors took on several schools, and so the emergence of multi-academy trusts began. By August 2010, seven sponsors (Ark, E-ACT, United Learning Trust, the Harris Federation, the Ormiston Trust, Oasis and the Academies Enterprise Trust) sponsored six or more academies. United Learning Trust sponsored the largest number, at 17 academies.7
The Coalition Government of 2010-2015
From 2010 the academies programme significantly expanded and evolved. The Academies Act 2010 enabled all primary, secondary and special schools to apply to become an academy, with schools rated as ‘outstanding’ by Ofsted to be considered first. Over time, this expanded to allow schools rated ‘good with outstanding features’ to convert and any school, irrespective of Ofsted grade, to convert if it partnered with an excellent school or a trust with a strong track record of improvement. The Coalition Government also continued with the forced academisation of low performing schools. In September 2014, eight Regional Schools Commissioners (RSCs) were appointed with responsibility to approve academy conversions in their region and to intervene in underperforming academies.8 During the five years of the Coalition government, and largely under Michael Gove’s tenure as Education Secretary, the number of academies increased from 203 to over 4,000 – with around 60 per cent of secondary schools, 15 per cent of primary schools, and 15 per cent of special schools having academy status. This included new free schools, studio schools, and university technical colleges.
David Cameron’s Conservative government 2015
-16
The push for academisation continued in 2015-16. The 2016 Education and Adoption Act was passed requiring any school deemed by Ofsted as ‘inadequate’ – meaning it has serious weaknesses or requires special measures – to be issued with an academy order. The Act also gave the Secretary of State, working through the Regional Schools Commissioners, the power to intervene in ‘coasting schools’. These were schools where, over a three-year period, results were not necessarily low but pupils were not making the progress that they should. These schools would not automatically face academisation and Regional Schools Commissioners were to consider the most appropriate response which could include:
7National Audit Office, ‘The Academies Programme’, September 2010, p.14.
14
▪ no further action if they were convinced the school was supporting its pupils well;
▪ additional support and challenge;
▪ forcing the governing body of the maintained school to enter into arrangements which will support the school to bring about sufficient improvement;
▪ adding governors or appointing an Interim Executive Board (IEB) to the school; or
▪ the school becoming a sponsored academy.
After the Education and Adoption Act received Royal Assent, the Department for Education set out its vision that every school should be an academy (or in the process of becoming an academy) by 2020.9 The Department also stated that most schools would form or join a multi-academy trust, with an expectation that there would be ‘many more’ MATs with oversight of around 10 to 15 academies.
The announcement requiring all schools to become academies was highly controversial and faced strong resistance in Parliament. As a result, in early May 2016, the then Secretary of State, Nicky Morgan, announced a U-turn on the universal conversion programme, stating that the Department would no longer seek to require all schools to become academies. Instead, it would introduce new legislative powers to trigger an area-wide conversion to academies if a local authority was deemed to be under-performing or if it was no longer financially viable for the authority to run its own schools (because a critical mass has already converted to academy status).10
Theresa May’s Conservative government
s, 2016 onwards
Academisation has been far less prominent under Theresa May’s leadership. The September 2016 consultation ‘Schoolsthat work for Everyone’ instead focused on the role of independent schools, faith schools, and, most controversially, selective schools in providing good school places. In October 2016, ministers formally announced that plans for the Education for All Bill – which would have introduced the legislation required to force area-wide conversion – had been dropped.11 That is not
to say that the plans did not affect the rate of academisation. Having been slowing for several years, the number of schools that converted to academy status during 2016/17 increased substantially, most likely in response to the overall direction of travel that had seemed to be in place.
However, the duties and powers from the Education and Adoption Act – designed to speed up the academisation process – do not appear to have had the transformative effect that was imagined. It emerged that schools rated as ‘inadequate’ were waiting many months to be taken over by an academy sponsor and there was rarely formal action in response to a school meeting the coasting schools definition.12,13 Perhaps reflecting this practical reality, the Secretary of State announced in
May 2018 that the Department for Education would “only enforce academy conversion, leadership change or changing the trust a school is part of when there has been an Ofsted Inadequate
judgement. So that means we will not be forcibly turning schools into academies unless there is that judgement.”
9 Department for Education, ‘Educational Excellence Everywhere’, March 2016, p.15.
10 Department for Education, ‘Next steps to spread educational excellence everywhere announced’, May 2016.
11R. Vaughan, ‘Government scraps Education for All Bill’, TES, October 2016
12 M. George, ‘Exclusive: Failure to find sponsors raises ‘serious’ questions over academisation law’, TES,
October 2017.
15
The number of academies, academy trusts and their structure
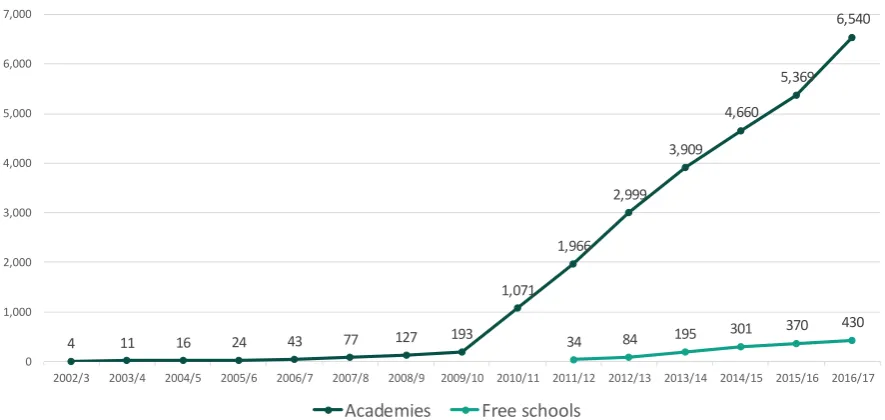
[image:15.595.75.518.181.391.2]By the end of the 2016/17 academic year (the year to which results in this report refer) there were 4,644 converter academies, 1,896 sponsored academies, and 430 free schools, UTCs and studio schools open in England. A quarter of funded primary schools, just over two thirds of state-funded secondary schools, and a quarter of state-state-funded special schools were academies.
Figure 1.1: Academies and free schools open in August 2017 by year of opening14
By the end of the 2016/17 academic year, three quarters of academies were operating within multi-academy trusts of which there were a total of 1,295. In 2017, the Education Policy Institute, working in partnership with Ambition School Leadership, examined the characteristics of multi-academy trusts.15 That analysis showed that:
▪ the vast majority are small starter or established trusts with a limited number of system leader trusts;16
▪ the majority have a mix of academy types or are predominantly converter academies and have a mix of phases;
▪ large system leader trusts are predominantly well-established academy sponsors rather than trusts of converter academies;
▪ nearly three-quarters of trusts are tightly clustered with all schools in the trust being within one hour’s travel time of all other schools in the trust, however there are some trusts where more than a fifth of schools are isolated. There is some evidence of school isolation being addressed over time;
▪ system-leader trusts and predominantly sponsored trusts have more pupils for whom English is an additional language (EAL), or who are eligible for the pupil premium, or who have low prior attainment than other trusts;
14 Excludes schools that have subsequently closed so, whilst overall trend is the same, this is not the number
open at each point in time.
15 Education Policy Institute and Ambition School Leadership, ‘Quantitative analysis of the characteristics and
performance of multi-academy trusts’, November 2017
16 As defined by the National Schools Commissioner based on pupil numbers: <1,200 starter trusts; up to
5,000, established trusts; up to 12,000, national trusts; more than 12,000, system leader trusts.
4 11 16 24 43 77 127 193
1,071 1,966
2,999 3,909
4,660 5,369
6,540
34 84 195 301 370
430
0 1,000 2,000 3,000 4,000 5,000 6,000 7,000
2002/3 2003/4 2004/5 2005/6 2006/7 2007/8 2008/9 2009/10 2010/11 2011/12 2012/13 2013/14 2014/15 2015/16 2016/17
16
▪ clustering and isolation of schools do not appear to be correlated with pupil characteristics and it is likely that any differences in characteristics relate to the types of schools and trusts rather than their location; and
▪ similarly, the phase mix of schools is not strongly correlated with pupil characteristics.
Existing evidence on academy performance
In July 2017, the Education Policy Institute published a report examining the impact of academies on educational outcomes, drawing on its own analysis and that produced in partnership with the LSE.17
It found that:
▪ the early sponsored academies, which opened under the Labour governments between 2002 and 2010, had, on average, a positive effect on pupils’ attainment at the end of secondary school. This was equivalent to one grade in each of five GCSE subjects;
▪ sponsored academies that were established between 2010 and 2014 under the Coalition Government showed an initial improvement in results in the year prior to the school
becoming an academy (equivalent to around one GCSE grade in one subject). This increased further in the year during which the school became a sponsored academy, but then that improvement tailed off over the following four years;
▪ the effects of converter academies on GCSE attainments was far smaller than the effects of the pre-2010 sponsored academies and is, in some cases, undetectable. Whilst there were, on average, improvements of one grade in each of two GCSE subjects in schools previously rated as ‘outstanding’, there was no positive effect in those schools previously rated as ‘good’ or ‘satisfactory’; and
▪ there was considerable variation in the performance of both multi-academy trusts and local authorities. Indeed, the variation within MATs and local authorities was far greater than the variation between the two groups.
Subsequent analysis of the relationship between multi-academy trust structure – such as size, mix of school type, and geographic spread – and performance found no clear and consistent relationship.18
Free schools are a type of academy and are often part of multi-academy trusts. At present, there is insufficient data to reach robust conclusions on the effectiveness – positive or negative – of free schools in terms of Ofsted outcomes and pupil attainment and progress. Such measures present a mixed picture and currently have serious limitations as to the extent to which they can be taken to be a measure of the effectiveness of the programme.19
17 J. Andrews et al, ‘The impact of academies on educational outcomes’, July 2017.
18 Education Policy Institute and Ambition School Leadership, ‘Quantitative analysis of the characteristics and
performance of multi-academy trusts’, November 2017.
17
Part 2: Methodology
Previous approaches to measuring academy chain and local authority performance
When considering measures for accountability purposes, simple aggregations of school level attainment measures (for example, the average Attainment 8 score) risk introducing perverse incentives. This is because an academy chain would have a disincentive to take on a low-performing school – since it would likely pull its average performance down – and an incentive to take on a high-performing school. Headline measures should therefore take account of a school’s starting point and capture the improvement that has occurred under the chain.
In our 2016 publication we adopted the same methodology that the Department for Education used in a statistical working paper of proposed measures of performance within academy chains and within local authorities that aimed to do this.20 We therefore had two measures:
▪ how well schools in a given chain or local authority are currently performing (based on current value-added scores);21 and
▪ how that performance has changed over time by looking at improvement in value-added scores.
The second of these relied on grouping schools together in a baseline year (typically the year the school opened as an academy) by their performance in that year. Their change in performance was then compared to the average change in performance of schools with a similar starting point. Scores for multi-academy trusts and local authorities were then the average of their school scores with weights applied according to how long a school had been with the trust or authority and the number of pupils.
Mainstream schools
This report applies the same overall principles as our previous report. For both Key Stage 2 and Key Stage 4 we have two measures of performance. In other words, we examine:
▪ how pupils within the academy chain or local authority are currently performing (as measured by the progress they make); and
▪ how results within that academy chain or local authority have improved over time. We continue to build chain and local authority scores by aggregating scores for the schools within each group. However, we have made a number of important changes to this year’s publication to better reflect the relative effectiveness of individual chains and local authorities and to allow for the changes that have been made to school accountability as set out below.
As ever, we invite comment and discussion of our methodology.
20 Department for Education, ‘Measuring the performance of schools within academy chains and local
authorities’, March 2015.
21 Value-added measures pupil performance, controlling for prior attainment. It is an estimate of school
18
Prior attainment
Our previous measures were derived from school level ‘value-added’ measures. Value-added measures capture the performance of pupils in comparison with pupils with similar levels of prior attainment. Prior attainment is a strong predictor of outcomes. For example, around half of the variation in outcomes at the end of secondary school is explained by outcomes at the end of primary.
As per our previous publication, our Key Stage 4 measures control for attainment at the end of Key Stage 2. Specifically, we use the average fine grade in English (the combination of reading and writing) and mathematics.22
We have made two significant changes for measures at Key Stage 2. We have previously controlled for prior attainment using outcomes at the end of Key Stage 1. However, this might be considered unfair on those schools that perform particularly well during Key Stage 1 (since they would have higher prior attainment and hence higher predicted outcomes at Key Stage 2). There are known systematic differences in the value-added outcomes of junior schools and all-through primary schools.
Instead, we use outcomes at age 5 from the Early Years Foundation Stage Profile (the total points in communication, language and literacy; and problem solving, reasoning and numeracy) as a control in our new measures for current performance.
Unfortunately, it is not possible to create a long time series of school scores in this way. This is because the necessary pupil level data was not collected until 2007 (prior to this the Department for Education collected a 10 per cent sample for monitoring purposes). This means the earliest measure that can be calculated is for 2013 – since there are six years between the end of the foundation stage and the end of Key Stage 2. In order to establish a reliable baseline, or starting point, for our improvement we need to go back further than this.
Therefore, we have taken the decision to not include prior attainment in our improvement measures at Key Stage 2. Given the importance of prior attainment in predicting outcomes this may seem unfair. However, there are two ways in which our headline measures allow for this. Firstly, as set out below, we are controlling for a range of other characteristics. Since these themselves are correlated with prior attainment they act as a proxy for it in the model.
Secondly, our improvement measures compare the outcomes of a school at two different points in time and so, in the absence of significant changes to a school intake, we are able to identify underlying improvements.
This does make an assumption that two schools with the same level of attainment have the same potential to demonstrate improvement. However, schools with similar outcomes can be in very different situations in regards to effectiveness (e.g. a school might be achieving very high results given the characteristics of pupils in the school and so would have a very high value-added score, a
22 See ‘Example of fine level calculation’ within DfE, ‘Secondary accountability measures’ for more information.
19
second school may be achieving the same outcomes but based on national averages might be expected to achieve much more highly. The potential to improve is likely to be higher in the second. Contextualised results
Our previous research has demonstrated that there are systematic differences in the outcomes achieved by groups of pupils with different characteristics. For example, pupils from economically disadvantaged backgrounds are around 19 months behind their peers by the end of Key Stage 4.23
Whilst prior attainment is the strongest predictor of outcomes, it alone does not explain this gap. In other words, a pupil from a disadvantaged background will, on average, make less progress than a non-disadvantaged pupil with the same level of prior attainment.
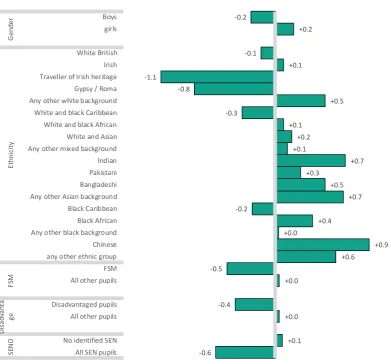
Current ‘value-added’ based measures such as Progress 8 fail to take this into account. This is seen in the national average Progress 8 scores for different groups of pupils (Figure 2.1). After controlling for prior attainment, disadvantaged pupils achieve nearly half a grade lower in each of their Progress 8 subjects than non-disadvantaged pupils. Similarly, pupils from black Caribbean, traveller of Irish heritage and gypsy and Roma backgrounds all achieve lower outcomes.
20
Figure 2.1: Average progress 8 score by pupil characteristics, 201724
The Department for Education made a conscious decision in 2010 to not take account of these factors.
Prior to that, measures of progress that controlled for these differences, known as contextual value-added, had been published for schools for a number of years. However, the Coalition Government of 2010-15 argued that such measures ‘[have] the effect of expecting different levels of progress from
different groups of pupils on the basis of their ethnic background, or family circumstances, which we think is wrong in principle. It is morally wrong to have an attainment measure which entrenches low
aspirations for children because of their background.’25
Whilst there are arguments for and against the inclusion of these factors, we believe that they improve our measures of effectiveness for academy chains and local authorities.26 Academy chains
have not expanded randomly and there are significant differences in the make-up of trusts. For example, they range from large sponsor-led trusts taking on underperforming schools to small trusts of high performing schools.
24 DfE, ‘Revised GCSE and equivalent results in England 2016 to 2017’, January 2018
25 DfE, ‘The importance of teaching – the schools white paper 2010’, November 2010.
26For further discussion of contextual value-added and its removal from performance tables see G. Leckie &
H. Goldstein, ‘The evolution of school league tables in England 1992–2016: ‘Contextual value‐added’, ‘expected progress’ and‘Progress 8’’, January 2017
-0.2 +0.2 -0.1 +0.1 -1.1 -0.8 +0.5 -0.3 +0.1 +0.2 +0.1 +0.7 +0.3 +0.5 +0.7 -0.2 +0.4 +0.0 +0.9 +0.6 -0.5 +0.0 -0.4 +0.0 +0.1 -0.6 Boys girls White British Irish Traveller of Irish heritage Gypsy / Roma Any other white background White and black Caribbean White and black African White and Asian Any other mixed background Indian Pakistani Bangladeshi Any other Asian background Black Caribbean Black African Any other black background Chinese any other ethnic group FSM All other pupils
Disadvantaged pupils All other pupils
No identified SEN All SEN pupils
21
Even amongst larger trusts there is wide variation meaning that, in some, around half of pupils are classified as disadvantaged whereas there are others in which less than a fifth are.27
Therefore, our headline measures control for:
▪ Pupil prior attainment28
▪ Pupil eligibility for free school meals
▪ Levels of disadvantage in pupil’s home LSOA29
▪ Pupil has an identified special educational need or disability
▪ Pupil has English as an additional language – separate factors for those that were in a state-funded school during Key Stage 1 and those who joined during Key Stage 2 – including interaction with prior attainment30
▪ Pupil ethnicity and interaction between ethnicity and level of disadvantage of pupil’s home postcode
There is no single ‘correct’ way of controlling for differences between schools, local authorities and academy trusts and the use of different factors can produce different results. We have however, used a set of controls that reflect the key drivers for differences in outcomes, that vary between different trusts and local authorities, and for which we have reliable and consistent data over a number of years. In order to see the impact of these contextual factors on the results we have included a non-contextualised measure. Contextualising results has less of an effect when considering improvement in results since, unless the intakes of schools change significantly over time, the systematic differences in results of different groups affects both the baseline and the outcome.
Outcome measures
In publications relating to the 2016 and 2017 data, the Department for Education has not included an improvement measure (though it plans to do so in future). This is because reforms to the school accountability system mean that outcome measures at both Key Stage 2 and Key Stage 4 are not directly comparable over time. Specifically, 2016 was the first year that pupils were assessed under the new national curriculum at the end of Key Stage 2 (and using scaled scores rather than levels) and Key Stage 4 saw the introduction of Progress 8 for all schools.31
It is not possible to apply these measures retrospectively. At Key Stage 2 the approach to assessment is different and is against a different underlying curriculum. At Key Stage 4, whilst it is possible to apply the logic of the Progress 8 calculation to earlier years it is unlikely to yield satisfactory results since the accountability measure in place in any given year is a significant driver of subject and
27 Education Policy Institute and Ambition School Leadership, ‘Quantitative analysis of the characteristics and
performance of multi-academy trusts’, November 2017.
28 Prior attainment is not included within the Key Stage 2 improvement measure. For further discussion see
‘Prior attainment’.
29 Lower layer super output areas, or LSOAs, are small geographic areas comprising between 400 and 1,200
households. There are around 33,000 LSOAs in England.
30 For a detailed discussion of the differences in outcomes of pupils for whom English is an additional language
see J. Hutchinson, ‘Educational outcomes of children with English as an additional language’, February 2018.
31 A value-added measure based on English, mathematics, three other EBacc subjects and three further
22
qualification choices. Put simply, historic Progress 8 scores are likely to reflect the very different curriculum choices that were made rather than relating to change in underlying effectiveness. Given the long time series involved for the improvement measure (preferably going back to 2008) it will not be possible to have a directly comparable time series for another eight years. There are therefore two options.
The first is to simply rely on a shorter time series than has previously been used. Currently this would mean just one year of improvement (2016 to 2017) and so is unlikely to properly demonstrate the changes that are being seen in a local authority or academy chain.
The second option is to construct a measure that is stable over time, even if it is not the exact measure that was in use. The key objective here is to find a measure that can be calculated for each year and is strongly correlated with the measure of accountability that was actually in use in that year.
At Key Stage 2 pupils have been assessed in reading, writing, and mathematics in each year over the period. Whilst there is no direct way of unpicking the effects of reforms in the national curriculum and assessment there is a strong correlation between schools that were high performing under the old and new arrangements (including earlier smaller reforms such as the move to make reading teacher assessed). The reforms mean that results are centred around a different average and have a different spread. We therefore base our model on a pupil’s performance across these subjects but first we standardise their scores so that nationally they have a mean of zero and a standard deviation of one in each year.
23
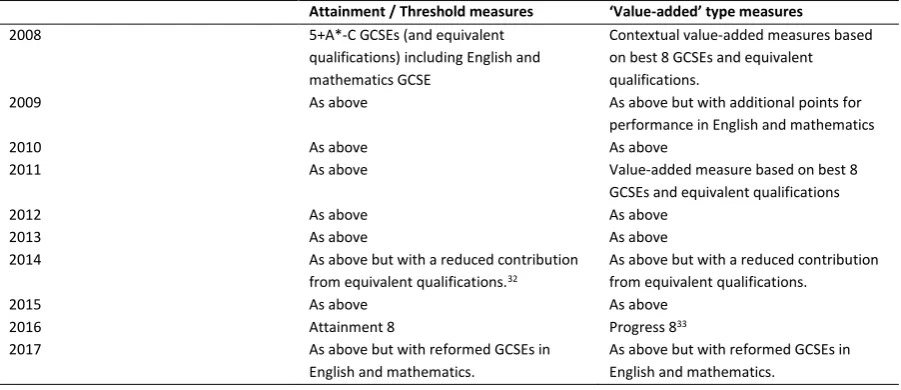
Figure 2.2: Attainment and value-added measures used in secondary school performance tables
Attainment / Threshold measures ‘Value-added’ type measures
2008 5+A*-C GCSEs (and equivalent
qualifications) including English and mathematics GCSE
Contextual value-added measures based on best 8 GCSEs and equivalent qualifications.
2009 As above As above but with additional points for
performance in English and mathematics
2010 As above As above
2011 As above Value-added measure based on best 8
GCSEs and equivalent qualifications
2012 As above As above
2013 As above As above
2014 As above but with a reduced contribution
from equivalent qualifications.32
As above but with a reduced contribution from equivalent qualifications.
2015 As above As above
2016 Attainment 8 Progress 833
2017 As above but with reformed GCSEs in
English and mathematics.
As above but with reformed GCSEs in English and mathematics.
Therefore, consistent over time is:
▪ The inclusion of GCSE outcomes in the measure
▪ A particular emphasis on English and mathematics in some way in every year. What is inconsistent over time is:
▪ The volume and value of equivalent qualifications
▪ The number of GCSEs that are included.
The simplest approach would be to just use a measure based on GCSE English and mathematics. However, this would produce misleading results for those schools that have had at some point a very narrow focus on those two subjects (for example, a school that previously focused on English and mathematics at the expense of other subjects but now achieves similar results across a broader range of subjects would appear to have not improved. Yet clearly the latter case provides a better, balanced curriculum and set of qualifications for an individual pupil.
At Key Stage 4 we therefore use a ‘best 5 GCSEs’ measure, consisting of English, mathematics and a pupil’s best results in three other GCSE subjects. This provides a balance between old measures including a wide range of subjects, and the more prescriptive approach of Progress 8. In each year the measure is correlated with the outcome measure that was in use at the time. In other words, the relative performance of schools is consistent across measures – a school that was previously rated as high performing would be high performing on this new measure.
32 From 2014 the range of equivalent qualifications that were included in Performance Tables was greatly
reduced. Those that remained had their size capped as being equivalent to one GCSE and a maximum of two non-GCSEs per pupil were included.
33 This was the first year that a value-added measure had been central to school accountability as it formed the
24
Structure of underlying pupil level models
Our measures for academy chains and local authorities are constructed from school level
performance measures. School-level scores are, in turn, generated from pupil-level data held within the National Pupil Database, using a multi-level modelling approach. This recognises the underlying structure of the data of pupils nested within schools.
In measures of current performance we control for prior attainment and, for the contextualised models, the additional pupil characteristics as set out above.34
We have constructed these models, and associated school scores for each year back to 2008. It is necessary to go back this far as these scores form the baseline needed to calculate an improvement measure.
The improvement measures follow a similar form to the current performance measures but include an additional control for the school’s value-added score in a baseline year. The baseline year is five years ago (at Key Stage 4, a cut off of four years is used for Key Stage 2) for schools with results published over that period and who have remained with the same school group during that time. In other circumstances it is:
▪ the final year as a predecessor school for schools that have become an academy more recently than five (or four) years ago; or
▪ the final year with the original academy chain for academies that have moved between academy chains more recently than five (or four) years ago; or
▪ the first year of results for new provision schools that had their first set of results within the last five (or four) years.
As with school performance tables, the status of a school in terms of its type and the group it is associated with, is taken as at September in the academic year to which results refer.
For example, for results in 2017:
▪ School A is an academy that converted from a local authority school in May 2013. Its baseline year is then 2013.
▪ School B is a free school that opened in September 2011 and first had results published in the 2016 performance tables. Its baseline year is 2016.
▪ School C became an academy in November 2012. In June 2015 it moved from its original academy trust to join a new sponsor. Its baseline year is 2015.
When calculating a school’s baseline value-added score:
▪ Results from predecessor schools are linked together with the current school in order to calculate a baseline. Where a school has multiple predecessors, the results from each predecessor are combined together.
▪ Where possible, the baseline score is a combination of three years of results (so a baseline of 2011 includes results from 2009, 2010 and 2011). This is to allow for volatility in measures at
34 Our prior attainment includes squared and cubic terms to allow for a curved relationship between prior
25
school level and for measures in an individual year being atypical as a measure of effectiveness for the school.
We calculate a separate improvement model for each possible baseline year (so for example, Key Stage 4 2017 has five models, 2012-2016). Rather than just include pupils at schools with the same baseline year, each model includes all schools with data for that year even if it is not the baseline year for that individual school. Calculating models based only on schools with the same baseline year would be likely to produce misleading results since the type of school converting to academy status is different each year, particularly earlier in the academies programme. Therefore, we are comparing a school’s results to all schools over the same period, not just those that share the same baseline year.
Grouping schools within academy chains and local authorities
Schools are grouped with a local authority if they are a community school, foundation school, voluntary aided school, or a voluntary controlled school.
Schools are grouped under an academy chain using the trust and sponsor information recorded on the Department for Education’s ‘Get information about schools’ service (formerly Edubase).35 Where
a trust appears under a sponsor we have taken this higher level as being the school grouping (so a chain may have multiple academy trusts within it).
This data provides a snapshot at the point of download (we have used an extract taken in August 2017) and does not record a change in school trust that did not result in a change of school identifier (known as the school URN). Therefore, we have supplemented this using published data on schools that have moved between trusts.36 However, this dataset does not cover all years and naming
conventions for trusts are inconsistent between datasets with no separate unique identifiers included.
Whilst we have made every reasonable effort to assign schools against the correct academy chain, the quality of the published data mean that in some instances some schools may not have the data of joining a chain correctly recorded, or may be incorrectly assigned to a particular chain. We believe this would affect only a very small minority of school groups.
Note that the published number of schools with performance data is often higher than that published by the Department for Education. Whilst both sets of analyses rely on schools that were open at the start of the academic year, the Department for Education measures apply an additional condition that the school must have been open for the previous two years.
Averaging results across several years
Our previous report referred to results in a single academic year. We adopted the same methodology as the Department for Education when determining which schools should be associated with each academy chain and local authority – schools were included if they were with the chain or local authority at the start of the academic year to which the results refer.
35 https://get-information-schools.service.gov.uk/
26
In this report we adopt a modified approach. We calculate the measures at school level for 2015, 2016, and 2017 using the same start of academic year cut off. We then combine all of these school results together (weighted by pupil numbers) to get an overall performance figure. Hence:
▪ A school that has three years of results will contribute its 2015, 2016, and 2017 results.
▪ A school that left an academy chain or local authority over that period will only contribute its results for the years it was there (so if it left, for example, in July 2015 it would contribute its 2015 results and no more).
▪ A school that joined an academy chain or local authority over that period will contribute for the years it was there (so if it joined in September 2015 it would contribute its 2016 and 2017 results).
▪ Therefore, schools that have been there the longest will continue to carry the greatest weight.
▪ A school that moved between chains or from a local authority to a chain would have some results assigned to the original organisation and later results to the receiving organisation. This last point is particularly important. If underperforming schools leave an academy chain (rebrokerage) or local authority (forced academisation), that poor performance continues to be reflected in the overall performance of a chain or local authority in subsequent years (with diminishing impact as time progresses). Chains cannot immediately become ‘high performers’ by losing schools that they were failing to improve. It also means that local authorities that lose high performing schools to become converter academies do not lose that performance immediately. We believe that such an approach better reflects the current dynamics of the academies programme where schools are now being moved between chains due to performance issues.
School groups are included if they have at least five (Key Stage 2) or three (Key Stage 4) schools with results in at least one year. The tables show the number of schools in 2017 and hence may
sometimes appear lower than this cut-off - for example a chain with Key Stage 4 results for four schools in 2015 would be included, even if that chain had now closed.
Measuring uncertainty in results
27
Results for disadvantaged pupils
We consider the current performance measure (i.e. not accounting for historic performance of the school) split by pupils who are economically disadvantaged versus other pupils. We take
disadvantaged to mean those pupils who are eligible for free school meals.37
Interpretation of results
Across our measures for mainstream schools the scores should be interpreted as:
▪ At Key Stage 2, a score of +/-1 means that, on average, pupils achieve one scaled score point higher/lower than similar pupils.38
▪ At Key Stage 4, a score of +/-1 means that, on average, pupils achieve one grade higher/lower in each subject at GCSE than similar pupils.
Special schools
By April 2018 there were just over 300 special academies and free schools. The majority of these are part of a multi-academy trusts. To date, neither we, nor the Department for Education, have
included them in results at academy chain level.
As with mainstream schools, the results of special schools are published in the school performance tables using the same measures. Given the reasons that pupils might attend a special school it is not surprising to see that results, on average, are far lower than in mainstream schools.
In 2017, the average Attainment 8 score of a pupil attending a state-funded mainstream school was 47.1 points – equivalent to a grade C in each of eight subjects; in state-funded special schools the average was 2.7 points – equivalent to a grade G in just three subjects.39 Similarly, pupils in special
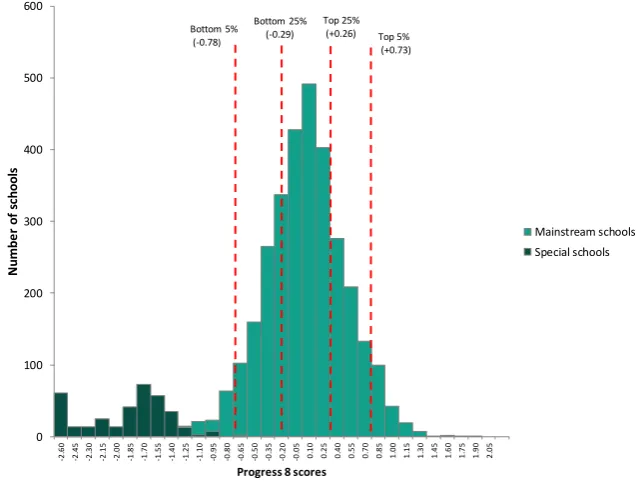
schools have an average Progress 8 score of -1.7. So even after controlling for prior attainment these pupils achieve nearly two grades lower in each GCSE subject than pupils in mainstream schools. This is reflected in the school level Progress 8 scores of special schools and mainstream schools. Nearly all of the former have scores that are below -1.0, nearly all of the latter have scores that are above that point (Figure 2.3).
37 Note that in most of our work, we use a broader definition of disadvantage, namely pupils that have been
eligible for free school meals at any point in the last six years (Ever6). We use the narrower definition here as our underlying models control for FSM status rather than Ever6 and so the results are easier to interpret. We would expect the patterns to be broadly the same if instead we used Ever6 in both the underlying model and the breakdown.
38 Unlike the previous national curriculum point scale there is no direct relationship between scaled point score
and amount of progress in terms of amount of schooling. However, we estimate that on our measures, one scaled point is broadly equivalent to around half a term.
28
Figure 2.3: Distribution of progress 8 scores for state-funded mainstream and special schools
If we were to include special schools on exactly the same basis as mainstream schools it is likely to be detrimental to those academy chains that have special schools within them – the most highly effective special schools on this measure would still be behind the least effective mainstream schools.
One approach would be to construct similar models to those used for mainstream schools, using the same outcome measure, but deriving them from pupils that attend specials. This is not without weaknesses, including:
▪ Trusts and local authorities employ different policies for special provision. For example, some areas will make greater use of specialist units within mainstream schools than others.
▪ Schools, trusts and local authority areas that include pupils within mainstream schools rather than in specialist provision will see those pupils assessed against the mainstream model (with pupils expected to achieve higher results on average).
▪ Many pupils recorded as being at the end of Key Stage 4 are not entered for any GCSEs or equivalent qualifications. Nationally, only a third of pupils are.
▪ Many special schools do not have school results published due to small numbers of pupils or poor coverage (less than half of their pupils being included in value-added measures). In 2017, only around half of special schools had a Progress 8 score published.
▪ The relationship between contextual factors and outcomes is less clear for pupils who attend special schools.
Applying exactly the same measures to special schools is therefore unlikely to produce reliable results. However, there is still clearly a need to see how academy chains and local authorities are affecting the results of all of their pupils.
We have therefore made the following decisions when calculating these models.
0 100 200 300 400 500 600 -2 .6 0 -2 .4 5 -2 .3 0 -2 .1 5 -2 .0 0 -1 .8 5 -1 .7 0 -1 .5 5 -1 .4 0 -1 .2 5 -1 .1 0 -0 .9 5 -0 .8 0 -0 .6 5 -0 .5 0 -0 .3 5 -0 .2 0 -0 .0 5 0 .1 0 0 .2 5 0 .4 0 0 .5 5 0 .7 0 0 .8 5 1 .0 0 1 .1 5 1 .3 0 1 .4 5 1 .6 0 1 .7 5 1 .9 0 2 .0 5 N u m b e r o f sc h o o ls
Progress 8 scores
Mainstream schools Special schools
Bottom 5%
(-0.78) Top 5%
(+0.73) Bottom 25%
(-0.29)
29
Pupils included
In order to allow for the differing provision for pupils with special educational needs, we include:
▪ all pupils with a statement of special educational needs or an education, health and care plan (EHCP) in mainstream schools;
▪ all pupils within SEN units or resourced provision; and
▪ all pupils in special schools.
This means that we have measures for academy chains and local authorities in which we measure the performance of all pupils with SEND above additional support in mainstream classes.
No measures for individual schools
The coverage set out above and the inherently small cohorts mean that measures for individual institutions will not be directly comparable and are likely to be particularly volatile. The small numbers also mean that many scores would be supressed. An academy chain or local authority may have a large number of relevant pupils but because they are spread over a number of schools no individual school, and hence the group as a whole, would have a score published. Therefore, we calculate a score for each academy chain or local authority directly, without an intermediate step for school measures. We have used a simple Ordinary Least Squares (OLS) model in order to do this. Current performance measure only
Because we do not calculate scores for individual schools there is no directly comparable way of measuring improvement. Therefore, at this stage we are presenting a measure of current performance only.
Outcome measure
Many pupils in special schools are not entered for any GCSEs. Therefore, our measure of ‘best 5 GCSEs’ will be zero for large numbers of pupils. We have therefore included the wider range of equivalent qualifications that are used in performance tables.
Interpretation of measure
On this measure a score of +/-1 means that on average, pupils achieved one grade higher/lower in one of their GCSEs (or equivalent qualifications) than pupils with similar prior attainment.40
Applying caution to interpretation
Whilst we have made efforts to provide a fairer comparison than that provided by results alone, there is still considerable, and uncontrolled for, variation in the nature of provision offered by different school groups. The results may in part reflect that variation rather than variation in
underlying effectiveness. We have therefore taken the decision not to publish lists of the highest and lowest performers. Instead we have illustrated the spread of results within the main body of the report and provided a list of results (in alphabetical rather than outcome order) in an Annex.
40 Note that this interpretation is different from that used for mainstream schools which is based on average
30
As ever, we welcome comment and discussion of our proposed methodology.
Stability of cohorts
Consistent with school performance tables, our measures reflect the outcomes of pupils that were in a school at the end of Key Stage 2 or Key Stage 4 and assume that all of the progress made between key stages is attributable to that school. In other words, we assume that they were in the same school throughout.
The reality is of course far more complex. Pupils may have joined a secondary school in year 7 but left, for whatever reason, before they took their GCSEs. Similarly, a pupil taking their GCSEs may have only recently joined the school. Most schools are likely to experience some pupils moving in this way but the extent to which schools – or academy chains and local authorities – are affected will vary.
In this report we present two measures of the stability of cohorts within each academy chain and local authority:
▪ The percentage of pupils who joined the school at the ‘usual time’ who then left before the end of Key Stage 2 or Key Stage 4 (outflow); and
▪ The percentage of pupils who were in the school at the end of Key Stage 2 or Key Stage 4 who did not join the school at the ‘usual time’ (inflow).
When calculating these measures, we only include those pupils that completed Key Stage 2 and Key Stage 4 in 2017 and were recorded in the National Pupil Database. Therefore, in the first measure we are not able to measure the effects of pupils that have left the state-funded school system, or who completed the Key Stage in a different year. In addition, neither measure takes account of pupils who were never admitted to the school.
We will be carrying out a more detailed study later in the year to examine movements out of schools.
It has been necessary to estimate the usual start point for each school (i.e. at what point would a Key Stage 2 or Key Stage 4 pupil have expected to join the school). This is because we do not have reliable longitudinal data on the legal age ranges covered by schools (these can change over time, particularly in local authorities that have moved from a three-tier school system) nor how
admissions have worked in practice.