The spatial ecology of dugongs: applications to conservation management
274
0
0
Full text
(2) The Spatial Ecology of Dugongs: Applications to Conservation Management. Thesis submitted by James Kendal SHEPPARD. for the degree of Doctor of Philosophy School of Earth & Environmental Sciences James Cook University Townsville Australia. i.
(3) "No seaman ever sailed his black ship past this place without listening to the sweet voice that flow from our lips, and none that listened has not been delighted and gone on a wiser man" [The SIRENS to Odysseus. Homer, Odyssey 12.184]. ii.
(4) STATEMENT of ACCESS. I, the undersigned, author of this work, understand that James Cook University will make this thesis available for use within the University Library and, via the Australian Digital Theses network, for use elsewhere. All users consulting this thesis will have to sign the following statement: “In consulting this thesis I agree not to copy or closely paraphrase it in whole or in part without consent of the author and to make proper written acknowledgement for any assistance which I have obtained from it.” I understand that, as an unpublished work, a thesis has significant protection under the Copyright Act and I do not wish to place any further restriction on access to this work.. Signature _________________________ Date_________________ James K. Sheppard. iii.
(5) STATEMENT of SOURCES DECLARATION. I declare that this thesis is my own work and has not been submitted in any form for another degree or diploma at any university or other institution of tertiary education. Information derived from the published or unpublished work of others has been acknowledged in the text and a list of references is given.. Signature _________________________ Date _______________ James K. Sheppard. iv.
(6) STATEMENT on the CONTRIBUTION of OTHERS Research funding: • Australian Research Council • CRC Reef Research Centre Student Grant • Sea World Research and Rescue Foundation • CRC Reef Postgraduate Travel Award • James Cook University Postgraduate Research Award & CRC Reef top-up • Society of Marine Mammals • Rothwell Wildlife Preservation Trust • Norman Wettenhall Foundation • Great Barrier Reef Marine Park Authority Augmentative Grant • Ian Potter Foundation • Norman Wettenhall Foundation • CRC Reef Completion Scholarship • MacRoberston Girls High School • Townsville Grammar School • Anonymous Donor Research in-kind support: Queensland Parks & Wildlife Service CSIRO Australian Institute of Marine Science Baymap Ltd. Australian Hydrographic Office Royal Australian Defence Force Hervey Bay - Fraser Island Air Adventures Wondunna/Butchulla Aboriginal Corporations. • • • • • • • •. Supervision: Professor Helene Marsh, School of Earth & Environment Science, James Cook University Dr. Ivan Lawler, School of Earth & Environment Science, James Cook University Professor Rhondda Jones, School of Tropical Biology, James Cook University. • • •. Statistical and analytical support: Professor Helene Marsh, School of Earth & Environment Science, James Cook University Dr. Ivan Lawler, School of Earth & Environment Science, James Cook University Professor Rhondda Jones, School of Tropical Biology, James Cook University Dr Mike Steele, School of Mathematics, Physics and IT, James Cook University Professor Danny Coomans, School of Mathematics, Physics and IT, James Cook University Dr Steve Delean, Australia Institute of Marine Science Mark S. Handcock, Centre for Statistics and the Social Sciences, University of Washington Dr Rohan Arthur, NCF India. • • • • • • • •. Editorial support: Dr Anthony Preen Scott Whiting Dr Chloe Schauble Prof. Iain Gordon Len McKenzie. • • • • •. v.
(7) Acknowledgments I extend the deepest gratitude to my supervisory committee: Professor Helene Marsh, Dr Ivan Lawler and Professor Rhondda Jones. A PhD student could not ask for a better team. I thank Helene Marsh for putting her faith in me and for her constant and steady guidance and unwavering support. Your inestimable experience, wisdom and sagacity represent for me the touchstone characteristics of a marine mammalogist and your dedication to sirenian conservation is truly inspiring. Ivan Lawer, I am proud to be your first PhD student. Your gentle guidance, affability and erudition kept me focused and enthused, even when technology, weather and dugong gods conspired to make my project seemingly impossible. I thank Rhondda Jones for being my analytical fairy godmother and for her contagious zeal for good science. Statistical and analytical advice was provided by Dr Mike Steele, Professor Danny Coomans and Steve Delean. I am grateful to John Marzluff and Mark S. Handcock for providing access to their RUF technique program and advice on its implementation and interpretation. I am extremely grateful to the following funding agencies that provided generous support for this project: Australian Research Council, CRC Reef Research Centre, Sea World Research and Rescue Foundation Society of Marine Mammals, Rothwell Wildlife Preservation Trust, Norman Wettenhall Foundation, Great Barrier Reef Marine Park Authority, Ian Potter Foundation, Norman Wettenhall Foundation. In-kind support and assistance was kindly provided by: CSIRO, Australian Institute of Marine Science, Baymap Ltd., Australian Hydrographic Office, the Royal Australian Defence Force, Hervey Bay - Fraser Island Air Adventures, Wondunna/Butchulla Aboriginal Corporations, Queensland Parks & Wildlife Service, (particularly Steve Winderlich, Michael Ford, Wayne & Bill, Bill and Stan Mann, Col and Duncan Limpus, Glenn Irwin, Kathy Gatley and John Meech), Kirstin Dobbs and Tony Stokes of GBRMPA, and Stan Tomkiewicz of Telonics Inc. This project required a truly enormous and demanding field component. I am eternally grateful to the following field assistants, dugong wranglers and seagrass surveyors without whom this project would not have been possible: Thomas Stevens (Dugong-catching machine), Guido Parra (Colombian magic), Jody Kruger (Silver fox), Pam Quayle, Rachel Groom, Amanda Hodgson, Rachel Maitland, Allison Palley, Cedric Desloires, Conrad Speed, Fredrik Petersson, Marco Perrig, Ian Berry, Eric Peterson, Armagan Sabetian, Dean Miller, Joshua Cinner, Marie Kospartov, Dan Pedersen, Dean Richards, Mark Hamann, Ryan Hodgson, Samantha Birch, Alice Hurlbatt, Ameer Abdulla, Ivan Lawler, David Feary, Elisabeth Laman Trip, Juanita Bité, Simon Kerville, David Foster, Brad Chainey. I thank you all for your dedication, intrepidness, patience and damn hard work under physically, mentally and spiritually trying circumstances. And also for making it fun. I thank the following JCU staff for their help with all things administrative, electronic and cartographic: Rob Scott, Clive Grant, Jody Kruger, Adella Edwards, Beth Moore, Sue Knight, Sue Bird, Barbara Pannach, Tina Langford. I salute my fellow JCU marine mammalogists: Guido Parra-Vergarra, the first correct choice I made after starting this PhD was selecting your office to share – thank you for your invaluable advice with all things marine and mammalian and for your friendship throughout this journey; Isobel Beasley, your laughter, enthusiasm and dedication to conservation in the face of adversity is truly inspirational; Dipani Sutaria, thanks for all the artistic and philosophical diversions and great homemade curries; Amanda Hodgson, we shared the common bond of slugging through dugong research in spite of seemingly endless technical setbacks, thanks for showing me that perseverance does indeed pay off; Alana Grech, you are my GIS Goddess, thanks for your friendship and for always having the time to advise me on all things spatial; Rachel Groom, your amazing energy while driving 1000’s of km and conducting the most mundane field and lab work preserved my sanity and my enthusiasm; B. Louise Chilvers, thank you for introducing me to JCU and Townsville; Adrian McMahon and Jillian Grayson, cheers for the friendship and support and good luck with it all.. vi.
(8) My flatmates and friends during my PhD, thank you all for the camaraderie, support, advice and moralboosting beers, BBQs and bonhomie: Melanie Ironside, James Moloney, Joshua Cinner, Dean Miller, Neil Young, David Feary, Rohan Arthur, Alice Hurblatt, Kelly Scaramozzino, Tim Prior, Karin Buchler, Ameer Abdulla, Sean Connolly and Christine, Diane Walker, Mariana Fuentas, Anne Cailluad, Jeanine and Glenn Almany, Pam Quayle, Oliver Floerl, Mark Hamann, Anna Lashko, Mathew Curnock, Faith Foster, Nadine Marshall, Tony Dell, Jos Hill, Tom Coughlin, Armagan Sabetian, Heidi Schuttenberg, Katya Abrantes, Kath Larsen, Rob Scott, Nicola Doss, Sally Bushnell, Juanita Bite, Stuart Campbell, Helena Safavia, Sam Birch, Sula Blake, Thomas Stevens, Steve Sutton, Jody Kruger, Ann Ferguson, The Woodies Gang, The Aotearoa Crew. JSB. Special thanks to Elisabeth Laman Trip, for all her love, support and fine French cuisine and to Vanessa Valdez Ramirez, for all her love, support and Mexican spice. Thank you for teaching me about life and love; for supporting me on the tough days and for sharing the joy on the great days, of which there were so many of both. To my Family, Mum and Dad, Simon and Nicholas, thank you for your unending support, encouragement, advice and love. I dedicate this thesis in loving memory to my Grandmother,. Muriel Nisbett.. vii.
(9) PUBLICATIONS ASSOCIATED with this THESIS Information from this thesis has been published or is currently in preparation to be submitted to peer-reviewed journals. Chapters 4 and 5 have been published as: Sheppard, J.K., Preen, A.R., Marsh, H., Lawler, I.R. Whiting, S.D., Jones, R.E., 2006. Movement heterogeneity of dugongs, Dugong dugon (Müller) over large spatial scales. Journal of Experimental Marine Biology and Ecology. 334: 64-83. Sheppard, J.K., Lawler, I.R., Marsh, H., 2007. Seagrass as pasture for seacows: landscape–level dugong habitat evaluation. Estuarine, Coastal & Shelf Science. 71: 117-132.. Information from Chapters 6 and 7 has been included in the following publication: Maitland, R.N., Lawler, I.R. and Sheppard J. K., 2007. Assessing the risk of boat strike on dugongs (Dugong dugon) at Burrum Heads, Queensland, Australia. Pacific Conservation Biology. 12: 321-327.. A manuscript based on Chapter 6 is in review in the Journal of Wildlife Management as: Sheppard, J.K., Jones, R.E., Marsh, H., Lawler, I.R. In Prep. Effects of tidal and diel cycles on dugong spatiotemporal use of habitat.. A manuscript based on Chapter 7 is about to be submitted to the Journal of Animal Ecology as: Sheppard, J.K., Marsh, H., Lawler, I.R., Jones, R.E., In Prep. Food Resource Selection by a Large Marine Mammal Grazer: The Influence of Diel and Tidal Cycles on Dugong Foraging.. Research findings from Chapters 3 and 5 have been incorporated into the following In Press book chapters: Marmontel, M. Sheppard, J.K., Morales, B., Reid, J. Sirenian tagging and tracking. In: Sirenian conservation: Issues and strategies in developing countries. E. Hines editor. In Press. Marmontel, M. Morales, Sheppard, J.K., Delineating sirenian habitat. In: Sirenian conservation: Issues and strategies in developing countries. E. Hines editor. In Press.. viii.
(10) ABSTRACT Dugongs are large primary consumers of seagrass communities, and thereby shape the diversity, structure, and dynamics of these extensive ecosystems. The dugong is listed as vulnerable to extinction at a global scale. Because dugongs are seagrass specialists, understanding the interaction between dugongs and their seagrass habitats is crucial to their conservation. Habitat use by dugongs is beginning to receive greater attention by managers and ecologists, but a spatially-explicit model capable of predicting usage by dugongs based on attributes of those habitats is lacking. Studying the interaction between dugongs and their seagrass food requires knowledge of the movements and diving behaviour of dugongs at scales relevant to both dugongs and managers. Information is needed on dugong spatial patterns, including movement behaviours and habitat use, across domains of scale. Multi-scale approaches to dugong research have not been possible in the past because of the difficulties in observing dugongs directly and the low resolution of telemetric equipment. My project capitalised on recent technology incorporating accurate GPS technology into tracking equipment to monitor the habitat use of wild animals at very high resolution (<10 m). Advances in geographic information systems (GIS) and spatial modelling enabled habitat selection by satellite-tracked dugongs to be analysed in a high-resolution, spatially explicit manner. I used hierarchical scales of spatial analyses to assess the relative importance of different seagrass meadows and parts of meadows to dugongs at scales that are suitable for informing policy concerning the management of human activities. My central research hypotheses were that: (1) dugongs forage like terrestrial mammalian grazers in that they prefer habitats where their foraging efficiency is greatest and (2) patterns of dugong movements and habitat use across spatial scales are intimately linked to the availability and distribution of quality seagrass forage. I investigated the mechanisms that produce the large-scale distribution and movement patterns of dugongs by reanalysing the results of historical aerial surveys and satellite tracking conducted by earlier researchers in combination with new data from my GPS telemetry of 20 dugongs in sub-tropical and tropical waters of Queensland and the Northern Territory, Australia. The mean patch size supporting high relative density (> 0.1 dugongs/km2) of dugongs over 20 years along the urban coast of Queensland was 77 km2 (± 4 s.e.). Hence, at regional and landscape scales (> 100 km2) dugongs select habitat at the level of individual bays along the coast. The tracked dugongs were followed for periods ranging from 15 to 551 days and exhibited a large range of individualistic movement behaviours; 26 individuals were relatively sedentary (moving < 15 km) while 44 made large-scale movements (> 15 km) of up to 560 km from their capture sites. Male and female animals, including cows with calves, undertook large-scale movements (LSM; > 15 km).. ix.
(11) At least some of these movements were return movements to the capture location, suggesting that such movements were ranging rather than dispersal movements. Large-scale movements included macro-scale regional movements (> 100 km) and meso-scale inter-patch local movements (15 ≤ 100 km) and were qualitatively different from tidally-driven micro-scale commuting movements between and within seagrass beds (< 15 km). Large-scale movements were rapid and apparently directed. Tracked dugongs rarely travelled far from the coast (mean max distance = 12.8 ± s.e. 1.3 km). Dive profiles from the timedepth recorders suggest that dugongs make repeated deep dives while travelling rather than remaining at the surface. Some animals caught in the high latitude limits of the dugongs’ range on the Australian east coast in winter apparently undertook long distance movements in response to low water temperatures, similar to the seasonal movements of Florida manatees. A 24 km2 seagrass meadow in Hervey Bay, Queensland, Australia was confirmed as important dugong habitat on the basis of the tracking data. Marine videography, Near-infrared Spectroscopy (NIRS) and Geographic Information Systems (GIS) were used to survey, analyse and map seagrass species composition, nutrient profile and patch structure of the meadow at high resolution (200 m). Five species of seagrass covered 91 % of the total habitat area. The total above and below-ground seagrass biomass was estimated to be 222.7 ± s.e. 19.6 t dry-weight. Halodule uninervis dominated the pasture (81.8 %, 162.2 t), followed by Halophila ovalis (35.3 %, 16.5 t), Zostera capricorni (15.9 %, 22.2 t), Halophila spinulosa (14.5 %, 21.9 t), and traces of Halodule pinifolia. Because the distributions of the various seagrass species overlapped, their combined percentage totalled > 100 % of the survey area. The seagrass formed a continuous meadow of varying density. For all seagrass species, the above-ground component (shoots and leaves) possessed greater total nitrogen than the below-ground component (roots and rhizomes), which possessed greater total starch. Because of the relatively low intraspecific variation in nutrient composition, nutrients were concentrated according to seagrass biomass density. H. uninervis was the most nutritious seagrass species because of its higher whole-plant nitrogen (1.28 ± s.e. 0.05 % DW) and starch (6.42 ± s.e. 0.50 DW %) content. H. uninervis formed large, clustered patches of dense biomass across the pasture and thus nitrogen and starch were concentrated where H. uninervis was prevalent. These survey and analytical techniques enabled me to rapidly, economically and accurately quantify and characterise seagrass habitat at scales relevant to a large forager. I used GIS and spatial statistics to identify the role of physical environmental characteristics in determining the activity patterns and fine-scale space-use of dugongs tracked in coastal and deepwater seagrass habitats using GPS telemetry. A seagrass meadow was defined as a core dugong habitat if more than 10 days of satellite location fixes were obtained from an individual animal occupying an area <100 km2. Habitats were categorised as inshore/intertidal or offshore/subtidal depending on their distance to the shore and the water depth. Inshore/intertidal habitats had a shallow component that was exposed at lowx.
(12) tide. Offshore/subtidal habitats were at least 5 km from the nearest mainland and were at least 3 m deep at mean low water spring tide (MLWS). Location fixes acquired from dugongs tracked in coastal habitats exhibited significant circadian rhythms, with fewer locations during the morning than during late afternoon/night. GPS location fixes could only be acquired when the transmitter was at the surface. Such periods are typically brief, as when the animal surfaces to breathe. More GPS locations were acquired from inshore/intertidal dugongs that were foraging in the intertidal zone than from animals in the subtidal zone. This telemetric artefact provided an indication of when the animals were moving across shallow intertidal waters. More locations were received at night when the animals were generally closest to the shore and in shallow water and fewer locations were received during the day when animals were further subtidal in deeper waters. Hence, the average depth of water experienced by dugongs and their distances from the shore may have been significantly underestimated, especially when fix success was low, since animals that were in shallower water were more likely to be sampled. Consequently, my estimates of the diel patterns of dugong space use were more conservative than the actual situation and probably underestimated the strength of the tidal patterns. Dugongs were in deeper water more often during the morning than during late afternoon/night. There was no effect of tide height on the actual depths in which dugongs occurred. Dugongs in coastal habitats were furthest from the shore between 6:00am and 12:00pm and closest between 3:00pm and 12:00am. Dugongs were closer to the shore during high tide than during low tide. Physical environment variables had little or no effect on the spatial patterns of dugongs tracked in deep water. The movement speeds of the coastal and deepwater dugongs increased marginally between 9:00am and 3:00pm, from an average of 200 to 300 m/hr. Seven dugongs were GPS tracked at a fine spatial scale (< 10m) within the Burrum seagrass habitat in winter. Resource selection within the habitat was modelled by comparing the dugongs’ use of space with the distribution of their seagrass food resources within an area defined using the combined space-use of the tracked animals. The association of dugongs with seagrass quantity (biomass) and quality (nutrients) was analysed within six time/tide combinations to examine the influences of tidal periodicity and the diel cycle on resource selection. I used resource utilisation functions (RUFs) to relate a probabilistic measure of each individual dugong’s space-use in each time/tide combination in a utilisation distribution (UD) (dependent variable) to the spatial landscapes of the resource variables (independent variables) using multiple regression. The RUF models indicated that dugong space-use was consistently centred over seagrass patches with high nitrogen concentrations, except during the day at low tides when their space-use was centred over high seagrass biomass and away from seagrass with high starch concentration. Dugong association with seagrass high in starch was positive during both day and night high tides when dugongs could access intertidal areas where the seagrass biomass was generally low. Patterns of association with seagrass xi.
(13) species were less definite. Estimates of the intensity of dugong space-use in relation to available seagrass resources may be confounded by the differentiation of fix probability by depth and speed. Because my estimates of dugong space-use in relation to subtidal seagrass may have been more conservative than the data suggested, the positive association of dugongs with patches of high biomass seagrass and avoidance of patches containing H. spinulosa and Z. capricorni in the subtidal zone may have been over-estimated by this sampling bias. I posit that dugong habitat selection and resource use occur hierarchically, across (at least) three different domains of scale: (1)at a regional-scale (> 10 000 km2) dugongs select habitat at the level of individual bays along the Queensland coast; (2) at a landscape-scale (< 10 000 km2), dugongs select seagrass pastures within bays along the Queensland coast comprised of nutritious plant species; (3) at a local-scale (< 10 km2) within seagrass pastures that are within bays along the Queensland coast, dugongs select seagrass patches on the basis of their nutrient concentrations. I recommend that the appropriate scales at which to manage dugong populations and their seagrass habitats be co-ordinated within and across the hierarchical scales of habitat use indicated by my analysis. My finding that dugongs frequently undertake large-scale moves has implications for management at a range of scales, and strengthens the aerial survey and genetic evidence for management and monitoring at ecological scales that cross jurisdictions. The capacity of large-scale monitoring programs to detect trends in dugong numbers at scales of even thousands of km2 is confounded by the dugongs' tendency to undertake large-scale moves. With movement between bays a common occurrence, estimates of population size and trends can only be meaningfully made at regional scales. The tendency for dugongs to track the bottom on large-scale movements may increase their vulnerability to incidental capture in bottom set gill nets. In addition, if dugongs transfer their spatial knowledge of the location of quality food resource patches to their offspring, then local depletions will lead to loss of this knowledge. Areas of high quality seagrass may thus become unknown to dugongs. In the absence of grazing pressure such areas may become less valuable as dugong habitat if the early seral stage species of seagrass preferred by dugongs convert to more fibrous species. My research suggests that dugongs actively select seagrass habitats comprised primarily of H. ovalis and H. uninervis, based on the high starch and nitrogen content of these species. Bays containing these quality food resources comprise an interlinked network of core habitats between which dugongs frequently move. Accordingly, bays along the Queensland coast with seagrass meadows dominated by H. ovalis and H. uninervis should be afforded a high level of protection as potential quality dugong habitat. Bays with extensive intertidal meadows of H. uninervis should also receive enhanced protection, even if the seagrass biomass is low. Even though they have low seagrass biomass, thermoregulatory habitats play an. xii.
(14) important role in maintaining dugong populations and should be included in dugong habitat protection strategies.. xiii.
(15) TABLE of CONTENTS CHAPTER 1.. 1. A SPATIAL APPROACH TO ENHANCING THE ECOLOGICAL BASIS FOR THE CONSERVATION MANAGEMENT OF DUGONGS. 1. 1.0. The dugong: An introduction 1.0.1. Ecology 1.0.2. Conservation management issues. 2 2 2. 1.1.. 4. Wildlife spatial ecology: An introduction. 1.2. Dugong spatial ecology – what we know… 1.2.1 Dugong movement behaviour 1.2.2. Dugong socio-biology 1.2.3. Dugong habitat use. 5 5 6 6. 1.3.. 7. Dugong spatial ecology – what we need to know…. 1.4. Research aims and hypotheses 1.4.1. Primary research aims 1.4.2. Central research hypotheses:. 8 8 8. 1.5.. 8. Research objectives and thesis structure. CHAPTER 2.. 12. RESOURCE USE AND FORAGING IN LARGE MAMMALIAN GRAZERS: A REVIEW WITHIN THE CONTEXT OF DUGONG/SEAGRASS ECOLOGY 12 2.0.. Herbivore nutritional ecology and diet selection. 13. 2.1. Grazer spatial ecology and foraging strategies 2.1.1. Foraging challenges 2.1.2. Coping with food patchiness 2.1.3. Foraging optimally 2.1.4. Foraging in groups. 14 14 15 16 16. 2.2.. Foraging constraints. 17. 2.3.. Limitations of classic foraging theory. 19. 2.4.. Marine mammal grazers – seacows grazing seagrass meadows. 20. 2.5. What we know about dugongs as large marine grazers 2.5.1. Dugong food resources 2.5.2. Dugong nutritional ecology and feeding processes 2.5.3. Dugong foraging dynamics 2.5.4. Dugong foraging constraints. 20 20 22 23 24. 2.6.. 26. What we need to know about dugongs as large marine grazers. CHAPTER 3.. 29. THE HERVEY BAY STUDY SITE AND METHODS FOR THE CAPTURE, TAGGING AND TRACKING OF WILD DUGONGS 29 xiv.
(16) 3.0. 3.0.1. 3.0.2. 3.0.3.. Hervey Bay study site General physiognomy Hervey Bay dugong population Rationale for study site selection. 30 30 30 31. 3.1. Techniques Used for the Capture and Tagging of Wild Dugongs 3.1.1 General safety and conservation issues. 32 32. 3.2. Personnel and equipment required for dugong capture and tagging 3.2.1. Personnel 3.2.2. Boats and general equipment 3.2.3. Dugong satellite tag 3.2.4. Dugong tether and harness 3.2.5. Dugong time-depth recorder. 33 33 35 35 36 37. 3.3. Dugong capture and tag deployment. 38. 3.4. Tracking, ground-truthing and tag recovery. 41. CHAPTER 4.. 44. MOVEMENT HETEROGENEITY OF DUGONGS OVER LARGE SPATIAL SCALES. 44. 4.0.. Introduction. 45. 4.1. Materials and Methods 4.1.1. Determining the scale of dugong population patchiness 4.1.2. Dugong telemetry 4.1.3. Accuracy and frequency of fixes 4.1.4. Data processing and analysis. 46 46 47 48 48. 4.2. Results 4.2.1. The scale of the patchiness of dugong populations along the urban coast of Queensland 4.2.2. Defining large-scale movements (LSMs) 4.2.3. Frequency of large-scale movements 4.2.4. Nature of large-scale movements 4.2.5. Relationship between movement and sea temperature 4.2.6. Diving behaviour during long distance movements 4.2.7. Home range size. 53 53 53 56 57 59 62 63. 4.3. Discussion 4.3.1. Heterogeneity of large-scale movements of dugongs 4.3.2. Nature of dugong long distance movement behaviour 4.3.3. Stimuli for long distance movement behaviour 4.3.5. Spatial memory of foraging patch distribution 4.3.6. Implications for management. 65 65 65 67 69 71. 4.3.7. Chapter summary. 71. CHAPTER 5.. 76. A SEAGRASS MEADOW AS PASTURE FOR SEACOWS: LANDSCAPE–LEVEL DUGONG HABITAT EVALUATION. 76. 5.0.. Introduction. 77. 5.1. 5.1.1. 5.1.2. 5.1.3.. Methods: Study site Sampling design Field methods and survey equipment. 80 80 81 82 xv.
(17) 5.1.4. Nutrient analysis 5.1.5. Point pattern spatial analysis 5.1.6. Spatial analysis of surface patterns 5.2. Results 5.2.1. Physiography 5.2.2. Species composition of the seagrass pasture 5.2.3. Biophysical configuration of the seagrass pasture 5.2.4. Nutrient analysis 5.3. 5.3.1. 5.3.2. 5.3.3. 5.3.4. 5.3.5. 5.3.6.. Discussion Characterising the Burrum Heads seagrass pasture Evaluation of the Burrum Heads pasture as dugong habitat Rankings of the nutritional quality of seagrass Foraging efficiency within the Burrum pasture Base carrying capacity of the Burrum Heads pasture Conclusions. CHAPTER 6.. 84 85 85 87 87 88 91 94 95 95 100 103 104 105 105. 110. PHYSICAL HABITAT CORRELATES OF THE BEHAVIOUR OF A MARINE MAMMAL GRAZER: THE EFFECTS OF TIDAL AND DIEL CYCLES ON DUGONG SPACE USE 110 6.0. Introduction. 111. 6.1. Methods 6.1.1. Dugong GPS telemetry 6.1.2. Characterising physical attributes of core habitats 6.1.3. Linking dugong space-use to physical habitat variables 6.1.4. Summarising & stratifying the telemetry data 6.1.5. The General Linear Model. 114 114 114 115 115 117. 6.2. Results 6.2.1. Patterns of location fix acquisition across the diel and tidal cycle 6.2.2. Influence of physical variables on the spatial patterns of dugongs. 118 119 121. 6.3. Discussion 6.3.1. Summarising the spatial responses of dugongs to physical habitat attributes 6.3.2. Explaining the spatial responses of dugongs to tidal and diel cycles 6.3.3. Comparisons with manatees 6.3.4. Comparisons with terrestrial mammalian grazers 6.3.5. Sampling artefacts 6.3.6. Conclusion 6.3.7. Chapter summary. 127 127 128 130 131 131 132 133. CHAPTER 7.. 140. FOOD RESOURCE SELECTION BY A LARGE MARINE MAMMAL GRAZER: THE INFLUENCE OF DIEL AND TIDAL CYCLES ON DUGONG FORAGING. 140. 7.0. Introduction. 141. 7.2. Methods 7.2.1. Study site 7.2.2. Satellite tracking dugongs 7.2.3. Defining dugong home ranges and available food resources 7.2.4. Dugong space-use as an indicator of resource selection – the RUF technique 7.2.5. Relating dugong UDs to seagrass nutrient resources across tide and diel cycles. 143 143 143 144 145 149. 7.3. Results. 153 xvi.
(18) 7.3.1. 7.3.2. 7.3.3. 7.3.4. 7.3.5.. Attributes of the tracked dugongs Change in the dugong’s foodscape across tide zones Effects of tide and diel cycle on dugong use of the study habitat Patterns of dugong food resource selection Effects of tide and diel cycle on dugong use of the food resources. 153 153 154 155 158. 7.4. Discussion 7.4.1. Patterns of dugong food resource selection across tide and diel cycles: 7.4.2. Explaining dugong food resource selection patterns: 7.4.3. Are dugongs nitrogen optimisers? 7.4.4. The food quantity vs. quality dichotomy 7.4.5. The unique foraging strategy of the dugong as a large mammalian grazer 7.4.6. Assumptions/limitations of my approach 7.4.7. Evaluating the RUF technique. 159 159 160 161 162 166 167 170. 5.0. Conclusions. 170. 6.0. Chapter summary. 171. CHAPTER 8.. 178. GENERAL DISCUSSION AND SYNTHESIS: CONSERVATION MANAGEMENT OF DUGONGS ACROSS HIERARCHICAL SCALES OF HABITAT USE. 178. 8.1. Thesis conceptual overview. 179. 8.2. Review of research objectives, methods and findings. 180. 8.3. Implications for dugong and large mammalian grazer ecological theory 8.3.1. Contributions to dugong ecology 8.3.2. The dugong as a large mammalian grazer 8.3.3. Research synthesis: Dugong hierarchical habitat use. 183 183 185 188. 8.4. Implications for conservation management 8.4.1. Management implications of large-scale moves 8.4.2. Implications for dugong habitat protection 8.4.3. Hierarchical scales of dugong management. 189 189 190 194. 8.5. Management Outputs and Outcomes from My Research to Date… 8.5.1. Great Sandy Strait Marine Park 8.5.2. Great Sandy Region Marine Aquaculture Management Plan. 196 196 198. 8.6. Future research directions 8.6.1. Comparing dugong behaviours in different habitats and seasons 8.6.2. Analysing dugong spatial behaviours with emerging technologies. 198 198 202. REFERENCES. 207. APPENDIX. 243. xvii.
(19) LIST of FIGURES Figure 1.1: Schematic diagram of thesis structure. This schema will be repeated at the beginning of each chapter to provide the reader with quick reference of the location of the chapter within the conceptual framework of my thesis. ……………………………………………………..……...……p11 Figure 3.1. A: Map of Hervey Bay and the Great Sandy Strait, with the Burrum Heads field site marked by the black rectangle. The corner insert shows the location of Hervey Bay relative to the Queensland coastline. B: Google Earth™ aerial image of the Burrum Heads field site, showing the Burrum River mouth. …………………………………………………………...………………...…p34 Figure 3.2. A: Dugong satellite tag with tether and harness. B: Corroding backup release. The shackle on the left has been recovered from the field after a 2.5 month deployment in temperate seas – note the thinness of the corroded zinc bolt compared to the new shackle on the right…………………………p37 Figure 3.3. A: a primary jumper launching from the prow of a catch boat onto the tail of a dugong that has surfaced for a breath in deep water (> 3m) - a secondary jumper is following with a padded tail rope to secure the animal; B: a dugong being captured in shallow water (< 1.5m); C: attaching a satellite tag to a dugong’s tail in deep water (> 3m) alongside the catch boat while field assistants keep the animal restrained and closely monitor its wellbeing; D: underwater water shot of a captured dugong safely restrained in a padded flotation cradle which is tucked under its flippers; E: a dugong that has been tagged and released is gently guided out of its restraints and away from the catch boat by field assistants……………………………………………………………………………………………….p42 Figure 4.1. Sample of the Queensland coastline and the Southern Urban GBRWHA, from Shoalwater Bay to Cleveland Bay. Overlaid is the Grech and Marsh (2007) aerial survey model of dugong population density based on aerial survey data over 20 years. Inset frequency histogram of the model grid cells shows how the model was arbitrarily divided into low-density 1 km2 cells of <0.1 to 0.1 dugongs and high-density 1 km2 cells of 0.1 – 9.9 dugongs. Areas of highest dugong density per km2 created discrete population patches (indicated on the map by red patches). Inset square is a close up of the model in the Shoalwater Bay Dugong Protection Area-A (light-blue striped polygon) with the population spatial model (red 2 x 2 km2 blocks) and a representative bimodal kernel home range of a dugong that was satellite-tracked for 136 days with 294 GPS………………………………………...p52 Figure 4.2: (A) Location fixes, meso-scale movement patterns and harmonic mean grid for Bul'la, a 2.9m-long male tracked in Hervey Bay, Queensland during July-August 2004. Note the clusters of location fixes in the lower mean proportion cells. (B): Kernel home range contours calculated using the fixes identified in the core habitat circled in figure A. (C): Histogram of distance between consecutive location fixes for Bul'la, tracked using GPS (note log-scale on y-axis) (D): Plot of Correlated Random Walk (CRW) test for Bul'la's movement path showing CRW behaviour, implying that this dugong’s movements are random. Dashed line represents predicted values, dotted line observed values. Upper and lower solid lines represent 95% confidence intervals. (E): Fractal Mean D of Bul'la's movement path. (F): Plot of correlations of successive cosines for Bul'la's movement path, which compares correlation of tortuousities of adjacent path segments versus scale. Note discrete disjunctions in plots E & F around the 8000m mark indicated by a vertical line. On a small scale (<8km), this dugong moved with the tortuous correlated random walk shown in plot D as it foraged around core habitat areas, giving an increasing Distance2 and Fractal D. On a larger scale (>8km), it travelled with a straighter path, giving a decreasing D (plot E) and a correlation of cosines tending back towards zero (plot F). Hence, a transition between two domains of scale occurs at the discontinuity of 8km, where the animal moved out of its core foraging area during a long distance move………………………….…………p55 Figure 4.3: Map of the Queensland and Northern Territory coast of Australia, showing tagging sites (circled) and examples of macro-scale moves from three dugongs: (A). "Doreen" a female who moved from her capture site at Borroloola 335 km east to Forsyth Island in 1994. (B). "MT" a female who. xviii.
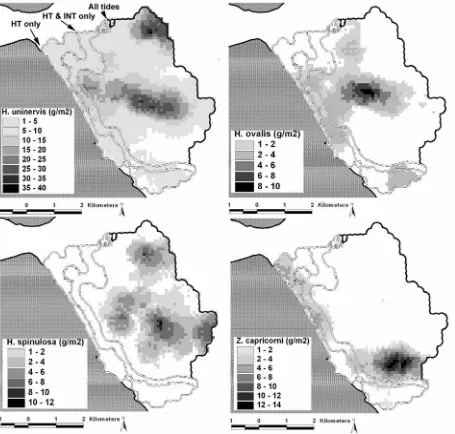
(20) moved from the capture site around Hinchinbrook Island 560 km north to Princess Charlotte Bay in 1997. (C). "Wunai" a 1.9 m male who moved from the capture site in Hervey Bay 513 km north to become resident around Clairview in 2003…………………………………………………..………..p57 Figure 4.4: A. Plot of maximum move time for each individual dugong against maximum move distance grouped according to telemetry type. B. Plot of total number of location fixes received for each individual dugong against total number of days tracked grouped according to telemetry type……….p58 Figure 4.5: (A.) Burando, a 2.7m male tagged in Hervey Bay during July 2003, made this 79.1km, 4.2day meso Large Scale Movement (LSM) from the capture site at Burrum Heads to Sandy Cape. The move is superimposed over Sea Surface Temperature (SST) measurements for Hervey Bay from a NOAA thermal imaging satellite at the start of the move (note temperature gradient across the Bay and the lack of location fixes between start and end points). (B.) Projected bathymetric profile of the move if the animal followed a straight-line trajectory from start to end fix across the Bay. (C.) Maximum dive depth and temperature profile of the LSM as recorded by the TDR. (D.), (E.) & (F.) The LSM, SST and dive characteristics of the return trip back to Burrum Heads. Note the position of 15 fixes obtained during the return move marked as A and B on Figures (D.) and (F.).Figure 4.6: Sample of dugong Bumkaman's dive profile (4.5 hours) during his 284 km Large Scale Movement from Burrum Heads to Great Keppel Island……………………………………………………………..……………………..p61 Figure 4.6: Sample of dugong Bumkaman's dive profile (4.5 hours) during his 284 km Large Scale Movement from Burrum Heads to Great Keppel Island. Note repeated 5-minute dives to > 21 m…..p63 Figure 4.7: Mean ± 95% kernel home range sizes for all dugongs organised according to home range location and transmitter type……………………………………………………………………….….p64 Figure 5.1. A: Survey perimeter and sampling grid of 557 points. B: Nutrient sampling points…....p82 Figure 5.2. Videoquadrat used to take photographs of the benthos. The marine videocamera was bolted to a height-adjustable steel frame and quadrat, allowing it to sit flat on the seafloor and transmit images of the benthos within the quadrat via cable to the monitor……………………………………....……p83 Figure 5.3. The bathymetry surface of the survey area interpolated using Kriging from the tide-adjusted depths at each sampling point. Depth is in metres below mean sea level (MLWS)……….………….p88 Figure 5.4. Frequency plots of seagrass cover % for (A) the raw quadrat data from the survey point grid, (B) the Kriged interpolated surfaces comprised of 10m-2 grid cells of contiguous seagrass species type plotted on the same scale and (C) the Kriged surface data at full resolution. Note how the interpolated data in (C) is more spread out across the range with a lower maximum cover % than the raw data in (A). ………………………………………………………………………………………..p90 Figure 5.5. Kriging interpolations of the mean percent coverages of each seagrass species at the study site in the context of 1 m bathymetry contours: A. H. uninervis; B. H. ovalis; C. Z. capricorni; D. H. spinulosa.…………………………………………………………………………………………..…..p92 Figure 5.6. Relationships between percent mean patch cover values for the four species of seagrass found within the survey area and: A. patch mean nearest neighbour; B. mean patch size; C. number of patches; and D. total area of the patch. A patch was defined as contiguous 10 m-2 grid cells of the same (mean percentage cover) value of the same species of seagrass. ………………………………....…..p93 Figure 5.7. Mean whole-plant % dry matter biomass nutrient and fibre profiles separated into intertidal and subtidal fractions with standard errors. N = Total nitrogen; OM = Organic matter; NDF = Neutral detergent fibre; Lig = lignin; IVDMD = In-vitro dry-matter digestibility. …………………………...p96. xix.
(21) Figure 5.8. Maps of A: spatial distribution and abundance of nitrogen and B: associated standard error. Nutrient masses are represented as g DW per m2 which were calculated from the combined biomasses and nutrient profiles of the four seagrass species present in the survey area……………………...…..p97 Figure 5.9. Maps of A: spatial distribution and abundance of starch and B: associated standard error. Nutrient masses are represented as g DW per m2 which were calculated from the combined biomasses and nutrient profiles of the four seagrass species present in the survey area. …………………….…..p98 Figure 6.1. A: Map of the Queensland coastline showing the location of the Clairview, Gladstone and Hervey Bay dugong habitats. B: Close up map of Hervey Bay from the insert box in Figure 1A showing the location of three inshore/intertidal (Burrum Heads, Turkey Island and Kauri Creek) and three offshore/subtidal (Woodgate, Point Vernon and Fork Bank) dugong habitats………………………p117 Figure 6.2. Schematic diagram of the analytical methodology used to summarise the dugong location data for the factorial General Linear Model. …………………………………..…………….………p118 Figure 6.3. Stacked circular histograms comprised of parallel-sided bars that show the number of observations within each class. A. The range of location fixes acquired from seven dugongs tracked in the Burrum habitat for an average of 32 days during winter 2003 – 04. The temporal distribution of fix acquisition was non-uniform with a night bias. The total mean location time was midnight (red line with 95% C.I.). B. Circular frequency plot of location fixes acquired from three dugongs tracked in the Kauri Creek habitat for an average of 28 days during the same period. The temporal distribution of fix acquisition had the same non-uniform pattern and night bias as the Burrum dugongs, with a mean location time around 11:00am. C. Circular frequency plot of location fixes acquired from three dugongs tracked in the subtidal habitats for an average of 31 days during the same period. The temporal distribution of fix acquisition was more uniformly distributed, although the mean location time was similar to that of the intertidal dugongs (00:20). D. Plot of Position Dilution of Precision (PDOP) values during the GPS tracking period. PDOP is a measure of satellite geometry and is determined by the availability of satellites to the receiver: lower DOP values indicate more accurate GPS positions. A DOP value of 4 or less yields excellent positions. A DOP between 5 and 7 is acceptable; a DOP of 7 or more is poor. Only 1.3% of DOP values during the tracking period were >4. The DOP values did not show consistent patterns, indicating that the diel patterns of location acquisition variation for dugongs cannot be explained by GPS sampling accuracy or by satellite availability. …………………..……p119 Figure 6.4. Box plots showing the median (black line), inter-quartile range (box) and 10 – 90 % range (whiskers) of A: Distance to the shore for the seven dugongs tracked within the Burrum inshore/intertidal habitat, B: Distance to the nearest deep water (> 3m MLWS), C: The actual water depth the animals were in (bathymetry + tide height), and D: Minimum speed. The y-axis for all plots is the hour of the day in blocks of three hours. ………………………………………………...………p122 Figure 6.5. An example of the proximity to the shore exhibited by the dugongs tracked at the Burrum inshore/intertidal habitat is indicated by this aerial photograph. Each dot represents a separate GPS location fix from the satellite tag attached to one of four dugongs. All fixes were recorded at night during high tide in July (2003 for Kalba and Narawi; 2004 for Kurui and Yinmai). At high tide this area was < 1.5 m deep and at low tide it was completely exposed. Note how the animals were < 300 m from the houses in the top left corner. …………………………………..………………………...………p124 Figure 6.6. Circular histograms of the bearings of the movements of the dugongs in the Burrum habitat stratified into AM incoming and outgoing tides (top row), and PM incoming and outgoing tides (bottom row). The red line from the centre indicates the total mean angle of the combined locations of the dugongs in the Burrum habitat to the nearest coast and the perpendicular red line indicates the approximate angle of the coastline. The plots were split into morning and afternoon/evening fractions because this division captures the periods when the animals are leaving the intertidal zone for the subtidal zone at low tide and the subtidal zone for intertidal zone at high tide, making the biases in the bearings of the movements clearer. Note the directional bias to the southeast subtidal water in the. xx.
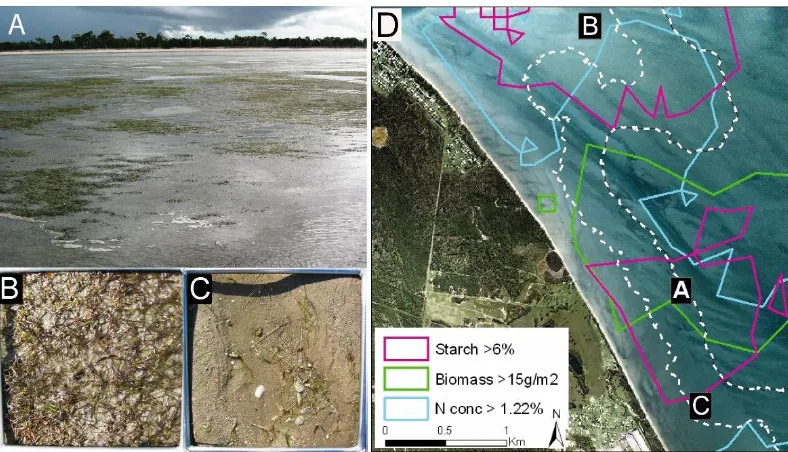
(22) morning during an outgoing-tide (top right) when fewer location fixes were acquired because the animals were in deeper water. During the afternoon/evening in an incoming-tide (bottom left), the directional bias shifted northwest and onshore into intertidal water when greater location fixes were acquired from animals in shallower water. The northwest and southeast movements were approximately equal when the tide was incoming during am and outgoing during pm. The northwest-southeast directional bias of dugong movements at an angle to the shore coincides with the aspect of the bathymetric slope from deeper to shallower water and the angle of deep water channels and gutters from the subtidal up into the intertidal zone (see Figure6.1.C)…………..………………………..…p126 Figure 7.1. Kriging interpolated landscapes of A: Total combined dry-weight seagrass biomass in grams per square metre; B: mean starch concentration % dry-weight and; C: mean nitrogen concentration % dry-weight per square metre within the Burrum dugong habitat. Starch and nitrogen are the nutrients considered most limiting in dugong populations. The resolution of each nutrient landscape metric is 100 m2. The black outer boundary of the nutrient landscapes demarcate available habitat resources to the dugongs used in the RUF procedure. The white double lines within the habitat indicate the boundary of the intertidal zone at mean low water springs and the approximate area of the intermediate and high tide zones (INT = intermediate tide, HT = high tide). …………..…...………p146 Figure 7.2. Kriging interpolated landscapes of the four seagrass species present in the Burrum habitat. Seagrass density is measured in dry-weight biomass (g/m2). The black outer boundary of the nutrient landscapes demarcate available habitat resources to the dugongs used in the RUF procedure. The white double lines within the habitat indicate the boundary of the intertidal zone at mean low water springs and the approximate area of the intermediate and high tide zones (INT = intermediate tide, HT = high tide). …………………………………..……………………………………..………………………p147 Figure 7.3. A: View from the edge of the low-tide mark looking west toward the shore. Note the extensive patches of dense H. uninervis that would be unavailable to a foraging dugong at this time. C: A dense patch of Z. capricorni that was avoided by the seven tracked dugongs and had no evidence of feeding trails. B: A sparse patch of intertidal H. uninervis with the roots and rhizomes exposed by a feeding trail. D shows the location of figures A, B and C relative to the densest patches of seagrass biomass and starch and nitrogen concentrations. The white dashed line indicates the boundaries of the low and intermediate tide zones. …………………………………..………………………...………p148 Figure 7.4. Steps for calculation of a RUF for a dugong within the Burrum habitat. A. The location fixes of an animal (colour-coded dots) were subdivided into tide and day/night categories from which kernel UDs were calculated. All UDs were clipped within a minimum convex polygon generated using the animal’s entire location fix dataset (banded line) to include areas that were available to the animal but which were used less often. B. The height of each UD was then matched with the values of underlying seagrass biomass, starch and nitrogen concentration landscapes. The peaks of the UD contours represent greater intensity of space-use. The green layer in B. represents total seagrass biomass projected into 3-D using the underlying bathymetry; the red contours represent the height of the animal Bunda’s UD during the day at low-tide. …………………………………..…………..…p151 Figure 7.5: Relationship between total seagrass biomass and seagrass starch and nitrogen concentration across the Burrum habitat. Starch and nitrogen concentrations initially increased with seagrass biomass, and then decreased at high biomass densities greater than 30 g/m2 dry-weight. Consequently, high biomass seagrass patches were lower in nutrients than more sparse patches. ………………………p154 Figure 7.6. An example of the intra-animal variation of dugong resource selection across tide and diel cycles is provided by these kernel home ranges calculated from the location fixes from the individual dugong ‘Wurraman’ in Figure 7.3. The animal’s movement data was sub-divided into tide and daynight treatments. The black rings represent the outer 95% boundary of each kernel range. The striped polygons represent 100m2 contiguous patches of highest starch concentration (> 6%) in the Burrum habitat. The dark grey polygons represent 100m2 patches of highest total seagrass biomass (> 15g DW/m2). The dashed line demarcates the boundary of the intertidal zone at low tide (MLWS) and the. xxi.
(23) approximate area of the intermediate tide zone. The stippled area represents the high tide zone. Note how the animal’s space-use is centred over the densest biomass patch in the subtidal zone at low tide during both day and night. As the tide height increases from left to right the space-use centre shrinks and moves over the patches of high starch concentration in the intertidal zone during both day and night. …………………………………..…………………………………………………………..…p157 Figure 7.7. The individual differences in kernel home range sizes of the observed dugongs is indicated by this aerial photo of the Burrum habitat with the largest recorded range (‘Narawi’ 833 hectares, day high-tide, generated using 82 fixes) and smallest range (‘Bulla’ 10 hectares, night intermediate-tide, generated using 138 fixes) superimposed. The dashed line demarcates the boundary of the intertidal zone at low tide (MLWS) and the approximate area of the intermediate tide zone (INT = intermediate tide, HT = high tide). The spatial patterns of the animal ‘Bulla’ were different from other dugongs: its ranges were very small at night and overlapped with none of the other tracked animals (Table 7.3).p159 Figure 7.8. Histogram of the relative percent of depths (m MLWS) of high biomass seagrass (>15g/m2 dry-weight) and low biomass seagrass (<15g/m2 dry-weight) throughout the Burrum habitat. The dashed line at the top of the graph indicates the extent of the subtidal zone. Note how a dugong foraging for high biomass seagrass at low-tide would not need to move into the deepest part of the habitat (>4 m). Because more location fixes are receieved from tags in shallower water, this shallow distribution of high biomass seagrass in the subtidal zone could introduce a sampling bias that indicates preference for high biomass patches at low-tide. ………………………………………..………..…p163 Figure 7.9. Factorial ANOVA conducted on individual standardised RUF coefficients for A: Total seagrass biomass; B: Nitrogen concentration, and; C: Starch concentration. LT = low tide, INT = intermediate tide and HT = high tide (± standard error). Tide status and Day/Night were categorical factors. Tide had a significant effect on dugong spatial association with biomass and nitrogen and starch concentration. Dugong use of areas containing high seagrass biomass occurred during low tide, particularly during the day. Conversely, dugong association with areas of high starch concentration was higher during the night and greatest at high tide. Dugong space-use coincided with areas high in nitrogen concentration relative to available nitrogen in the Burrum habitat, except during low tide..p165 Figure 7.10. Factorial ANOVA conducted on individual standardised RUF coefficients for the biomass of the four seagrass species found in the Burrum habitat. LT = low tide, INT = intermediate tide and HT = high tide (± standard error). …………………………………..……………………….………p168 Figure 8.1. The three hierarchical domains of dugong habitat use identified by the historical aerial survey and telemetry data analysed in this study: A: Regional-scale (>10 000 km2) map of Queensland showing the Hervey Bay dugong tagging site (dashed box) and the network of core habitats along the coast used by tracked dugongs that made macro-scale (> 100 km) moves along the coast. B. Landscapescale (10 - 10 000 km2) close-up of Hervey Bay showing the interlinked network of core habitats used by the tracked dugongs within the bay. Black polygons represent the location and size of dugong core habitats. Black lines represent the macro and meso-scale (15 – 100 km) movement paths between habitats. C. The Burrum Heads seagrass habitat at a local-scale (< 10 km2) showing the location fixes of a dugong delineated into low-tide, intermediate-tide and high-tide categories. Underlying the location fixes are one-metre bathymetry contours and a kriging interpolation of total combined seagrass biomass. …………………………………..………………………………………...……………..…p187 Figure 8.2. Schematic diagram of the five domains of dugong conservation management scale based on the hierarchical habitat use of dugongs identified in this study. The scale decreases from top to bottom, from global conservation measures such as international treaties to local seagrass habitat monitoring by community volunteer groups. …………………………………..…………………………………....p193 Figure 8.3. An example of regional-scale dugong protection is provided by the network of Dugong Protection Areas that was established in 1998 to enhance the protection of dugongs and their seagrass habitats along the Queensland coast……………………………………………………………….…p197. xxii.
(24) Figure 8.4. An example of landscape-scale dugong conservation management is provided by the Great Sandy Marine Park zoning that was legislated in 2006. Areas of high dugong conservation significance that were identified from my satellite telemetry data, including core seagrass habitats and possible travel corridors, were provided to senior EPA managers during the planning phase. Note how all but one of the dugong habitats (Point Vernon deepwater habitat, see Chapter 6) in Figure 8.1.B now occur within Protection Zones, including the Sandy Cape thermoregulatory habitat which is almost devoid of seagrass food resources. Within any of these three management zones, professional fishing, aquaculture and extractive development activities cannot occur without permission from the Queensland State Government. …………………………………..…………………………………………………..…p199 Figure 8.5. An example of local-scale dugong conservation management is provided by the designated go-slow zones (dotted areas) in the Great Sandy Marine Park that were defined using the core seagrass habitats identified from my dugong tracking study (Figure 8.1.B.). These zones require boats to remain off a planing mode to reduce the risk of collision with dugongs in the A. Burrum, B. Big Woody Island and C. Poona and Kauri Creek core seagrass habitats………………………………….…..……..…p202 Figure 8.6. Spatial model of relative dugong population density in Hervey Bay that was calculated with 20 years of historical aerial survey data using the methodology of Grech and Marsh (2007). The model will provide the Queensland Environmental Protection Agency with a tool to determine the effectiveness of legislation in protecting areas that are important to dugongs. Note the centres of high relative dugong density around Burrum Heads, Sandy Cape and the southern Great Sandy Strait – all areas that were frequented by the dugongs that I tracked (see Chapters 4, 5, 6 and 7). ……….....…p203 Figure 8.7. Schematic diagram of the factors that can theoretically influence the foraging dynamics of dugongs. The diagram also identifies potential topics for future studies of dugong ecology. Grey arrows indicate direction of the influence. Factors in red boxes are least known and data deficient. Factors in orange boxes have been investigated to some degree but require further research. Factors in green boxes have been studied more intensively than the other boxes, but also require further research, particularly with comparisons across different seagrass habitats. ………………………….……..…p205 Figure A1. Circular histograms of the bearings of the movements of the dugong (‘Wunai’) in the Clairview inshore/intertidal habitat stratified across the tidal cycle. LT = Low-tide, INT = intermediatetide and HT = High-tide. The parallel line indicates the approximate angle of the coastline. .……..p243 Figure A2. Circular histograms of the bearings of the movements of the dugong (‘Wunai’) in the Clairview inshore/intertidal habitat stratified across the diel cycle. The parallel line indicates the approximate angle of the coastline. …………………………………….………………….……..…p243 Figure A3. Circular histograms of the bearings of the movements of the dugong (‘Yuangan’) in the Fork Bank offshore/subtidal habitat stratified across the tidal cycle. LT = Low-tide, INT = intermediate-tide and HT = High-tide. …………………………………………….……….……..…p244 Figure A4. Circular histograms of the bearings of the movements of the dugong (‘Yuangan’) in the Fork Bank offshore/subtidal habitat stratified across the diel cycle. ……………………………..…p244 Figure A5. Circular histograms of the bearings of the movements of the dugong (‘Gulawa’) in the Point Vernon offshore/subtidal habitat stratified across the tidal cycle. LT = Low-tide, INT = intermediate-tide and HT = High-tide. …..…………………………..………………………………p245 Figure A6. Circular histograms of the bearings of the movements of the dugong (‘Gulawa’) in the Point Vernon offshore/subtidal habitat stratified across the diel cycle. ……………………..………p245. xxiii.
(25) Figure A7. Circular histograms of the bearings of the movements of the dugong (‘Yarrilee’) in the Woodgate offshore/subtidal habitat stratified across the tidal cycle. LT = Low-tide, INT = intermediatetide and HT = High-tide. ………………………………………………………………….…………p246 Figure A8. Circular histograms of the bearings of the movements of the dugong (‘Yarrilee’) in the Woodgate offshore/subtidal habitat stratified across the diel cycle. …………………………...……p246. xxiv.
(26) LIST of TABLES Table 4.1. Capture location, transmitter and incidences of large-scale movements (LSMs) for the 70 dugongs satellite tracked in seven sites in Queensland (QLD) and the Northern Territory (NT), Australia between 1986 – 2004. …………………………………..……………………………….….p73 Table 4.2. Correlation matrix of potential behavioural interactions characteristic of dugong large-scale moves (LSMs). …………………………………..…………………………………………..……..…p74 Table 4.3. Dive profile characteristics of 22 large-scale moves recorded from nine individual dugongs. …………………………………..……………………………………..………………………………p75 Table 5.1. Cover and biomass attributes of seagrass species found within the survey area at Burrum Heads. …………………………………..……………………………………………………………p108 Table 5.2. Mean % nutrient values for above and below ground plant fractions of each species of seagrass at Burrum Heads. …………………………………..………………………………………p108 Table 5.3. Mean total whole-plant biomass and mean, minimum and maximum total nitrogen and starch in dry-weight grams per square metre across the Burrum Heads survey area. Values are calculated from the kriging interpolations of seagrass patches, with a patch defined as contiguous 10 m2 grid cells of the same (mean percentage cover) value of the same species of seagrass. For example, the maximum nitrogen concentration value represents the weight in grams of that nutrient per m2 across a 10 m2 patch of the highest cover of that seagrass within the survey area. …………………p109 Table 6.1. Attributes of the twelve satellite-tracked dugongs that expressed high site fidelity to the eight habitats in Table 6.2 and were used in the fine-scale analysis of location. Two animals (Bulla and Wurraman) were resident at the Burrum habitat at the start of the tracking period and then made mesoscale LSMs (15 – 100 km) to become resident at the Kauri Creek habitat. Wurraman also made a macro-scale LSM (>100 km) to become resident at the Gladstone habitat. The animal Narawi made meso-scale LSMs to become resident at both the Burrum and Turkey island habitats. ………….…p135 Table 6.2. Attributes of eight habitats and two habitat types used intensively by the 12 tracked dugongs (Table 1) that were used in the fine-scale modelling of dugong location. ……………………..……p136 Table 6.3. Summary of significant tide, diel and animal effects on the spatial patterns of combined and individual dugongs in the Burrum inshore/intertidal habitat. ……………………………….………p137 Table 6.4. Summary of significant tide, diel and animal effects on the location variables for individual dugongs in the Kauri Creek, Clairview, Turkey Island and Gladstone inshore/intertidal habitats. …p138 Table 6.5. Summary of the potential costs and benefits of intertidal and subtidal foraging by dugongs. …………………………………..……………………………………………………....……………p139 Table 7.1. An evaluation of the assumptions inherent in and limitations to the approach used in this chapter. …………………………………..………………………………………………..…………p173 Table 7.2. Attributes of the seven dugongs that exhibited high site fidelity to the Burrum habitat and were used in the RUF analysis. ………………………………………………………...……………p174 Table 7.3: Distribution and biomass of the component seagrasses across the study area in July 2004 for the three tidal regimes. …………………………………..………………………………..…………p174. xxv.
(27) Table 7.4. Percentage overlap of the 95% kernel home range of the seven dugongs tracked in the Burrum habitat, divided into day/night categories. All values are read in the direction of the vertical column across the horizontal row, e.g., the range of ‘Wurraman’ during the day overlapped with 72% of the range of ‘Yinmai’ while the range of ‘Yinmai’ overlapped with 39% of the range of Wurraman. The animals ‘Narawi’ and ‘Kalba’ are compared only with each other because they were tracked in a different year (2003) from the other five dugongs (2004). …………………………………..……p175 ^. Table 7.5. Estimates of standardised RUF coefficients ( β ) for the seven dugongs within the Burrum habitat from the multiple regressions relating resource use at each grid cell (response) to seagrass biomass, seagrass nitrogen content and seagrass starch content (independent variables). Separate regressions were performed for each dugong and each diel/tidal phase combination. Positive coefficients indicate that use increases with increasing values of the nutrient resources. Relative ^. importance of the nutrient resources is indicated by the magnitude of β .Consistency in resource ^. selection across individual dugongs is indicated by the significance of β (significant (p<0.05) differences from 0 are bolded) and the number of dugongs whose space-use was either positively or negatively associated with each seagrass landscape metric (the + and – signs)……………………..p176 ^. Table 7.6. Mean standardised RUF coefficients ( β ) for the seven dugongs within the Burrum habitat from the multiple regressions relating resource use at each grid cell (response) to biomass of the four seagrass species at this location (independent variables). Separate regressions were performed for each dugong and each diel/tidal phase combination. Positive coefficients indicate that use increases with increasing values of the nutrient resources. Relative importance of the species is indicated by the ^. magnitude of β .Consistency in resource selection across individual dugongs is indicated by the ^. significance of β (significant (p<0.05) differences from 0 are bolded) and the number of dugongs whose space-use was either positively or negatively associated with each seagrass landscape metric. …………………………………..………………………………………………..…………………..p177 Table 8.1. Comparison of dugong life history parameters with terrestrial hind-gut fermenter analogues. …………………………………..………………………………………………..…………………..p206 Table 8.2. Potential sites for future dugong and seagrass habitat research in Australia………….…p206. xxvi.
(28) CHAPTER 1. A Spatial Approach to Enhancing the Ecological Basis for the Conservation Management of Dugongs. Dugongs are large primary consumers of seagrass communities, and thereby shape the diversity, structure, and dynamics of these extensive ecosystems. The dugong is listed as vulnerable to extinction at a global scale. Australia, with the world’s most significant dugong population, has an international obligation to ensure the continued survival of dugongs in the wild. Studying the interaction between dugongs and their seagrass food requires knowledge of the movements and diving behaviour of dugongs at scales relevant to both dugongs and managers. Multi-scale approaches to dugong research have not been possible in the past because of the difficulties of directly observing dugongs and the low resolution of telemetric equipment. Because dugongs are difficult to study in the wild, information on dugong behaviour is lacking. I describe how this project has capitalised on recent developments incorporating accurate GPS technology into tracking equipment to monitor the habitat use of wild dugongs at very high resolution. Telemetric advances have provided the capacity to model and map dugong habitat use in the inshore waters of the Great Barrier Reef and adjacent Hervey Bay and to assess the relative importance of different seagrass meadows and parts of meadows to dugongs at scales that are suitable for informing policy on the management of human activities. The overall aim of this thesis was to characterise dugong movement patterns and quantify dugong resource use by applying recent advances in spatial analyses and foraging models to telemetric data remotely acquired from wild dugongs. In this chapter I outline the rationale for my thesis in the context of mammalian foraging ecology, and describe the major objectives of my study and the structure of my thesis.. 1.
Figure


+7


Outline
Grazer spatial ecology and foraging strategies
Dugong foraging constraints
Hervey Bay study site
Dugong capture and tag deployment
Data processing and analysis
Defining large-scale movements (LSMs)
Characterising the Burrum Heads seagrass pasture
Evaluation of the Burrum Heads pasture as dugong habitat
Explaining the spatial responses of dugongs to tidal and diel cycles
Conclusion
Related documents
Basic demographics of the respondents in this study indicate that Korean international students entering the Pharm.D program in average have spent 5.0 ± 2.8 years in the
Using the 3 9 untranslated region as a probe in hybridisation studies, the expression of this gene is localised to the small muscle fibres of adult growing carp, which are believed
Vamos a instalar además JACK para permitir que múltiples aplicaciones de audio puedan usar la tarjeta de sonido, y vamos a instalarla de tal forma que las aplicaciones que usen
Optical Films Protective Cover Films Cover Glass Replacement Diamond Guard™ Display Films EMI/RFI Shielding Specialty Sensors Touch Panel
The Fire Patchiness Paradigm Leasie Felderhof Landscape fire patterns within the Mount Isa Inlier were examined using remote sensing, together with field surveys, to
De- tailed analyses of transmission assays associated with PERV- null animals indicated that the inability to infect porcine cells was not due to failed mitogen stimulation, as,
Teleportation, the standard Star Trek form of transportation from the Starship Enterprise to a planet’s surface, has become a staple of science ction and popular culture: ‘Beam me
'The Great Tradition and the Little in the Perspective of Sinhalese Buddhism.' Journal oj Asian Studies.. 'The Buddhist Pantheon in Ceylon and its Extensions.' In Manning
