Greenhouse implications of water reuse in the Upper Pumpanga River Integrated
Irrigation System, Philippines
Tek Narayan Marasenia1, Shahbaz Mushtaqa, Mohsin Hafeezb, Jerry Maroulisa
a
Australian Centre for Sustainable Catchments, University of Southern Queensland, Toowoomba, Qld 4350, Australia
b
International Centre of Water for Food Security, Charles Sturt University, LMB 588, Wagga Wagga, NSW 2678, Wagga Wagga
Abstract
With increasing demand being placed on water resources the efficient use of water is inevitable to increase rice productivity. The availability of water through a catchment can vary significantly with some water being used in upstream irrigation activities, for environmental flows, groundwater and infiltration movements, all resulting in challenges and costs for irrigators accessing water for their production systems. The use of tubewells, dams and groundwater extraction to access available water requires substantial capital investments. In addition, the production, transportation and application of pumps and pipes, and the associated fuels and oils needed to run them emit significant quantities of greenhouse gases (GHG). In this study, we analysed the GHG and water productivity implications of water reuse through pumping groundwater and creek water and compare this with canal irrigation systems under gravity-fed irrigation in the Upper Pumpanga River Integrated Irrigation System, in the Philippines. The results show that around 30% of total surface water applied was reused by internal check dams and pumping from shallow groundwater. The analysis indicates water reuse contributes significantly to water productivity; however, it does increase GHGs through pumping. The total amount of GHG emissions from pump irrigation system (with water reuse) is around 1.47 times higher than that of canal irrigation systems (without water reuse). Based on the finds, high priority on water reuse should be given only to the areas where water scarcity is a serious issue.
Key words: water productivity, greenhouse gas, canal irrigation systems, tubewell irrigation systems
1
61-7-1. Introduction
Rice, grown under flooded or submerged conditions, is one of the largest users of the world‟s developed freshwater resources (Tuong and Bouman, 2003). Bouman (2007a) estimated that 34-43% of the total world‟s irrigation water is used for rice. Given these large water inputs, the water productivity of rice compared to other cereal crops is quite low (Tuong et al., 2005). Additionally, increasing water scarcity and malfunctioning irrigation systems, now threatens the viability and sustainability of rice production (Rijsberman, 2006). The strong interdependence between water use in rice production and the operation of irrigation facilities for water services highlights the need for improving the performance of rice production systems (Bhuyan, 1996). Rijsberman (2006) advocates that water scarcity problems can be addressed through improved water productivity.
The effective recycling of drainage water and conjunctive use of groundwater poses a challenging question: should investment focus on the development and applicability of water saving irrigation practices such as alternate wetting and drying and aerobic rice or should investment be made in recycling outlets to increase water productivity (Tuong et al., 2005).
The recapture and reuse of water involves additional investments and operation costs, such as pumping or the building of dams (Guerra et al., 1998). Moreover, the production, transportation and application of pumps and pipes, and also fuels and oils to run them emit significant amounts of greenhouse gas (GHG) emissions (Maraseni et al., 2007). For example, delivering the 10 million litres of water needed by 1 hectare of irrigated corn from surface water sources requires the expenditure of ~ 880 kWh of fossil fuel (Batty and Keller, 1980). In contrast, when groundwater is pumped from a depth of 100 m, the energy required increases to 28,500 kWh, or more than 32 times the cost of surface water (Gleick et al., 2002). The choice obviously depends on the relative cost-effectiveness of the strategies. However, Dawe (2005) argued that while greater water productivity will almost certainly be necessary to reduce the negative impacts of future water scarcity, increasing water productivity in some instances does not necessarily result in increased benefits to society. For example, interventions may raise water productivity only at the expense of using more fossil fuels resources and increasing GHG, with the net effect being a reduction in economic efficiency.
compared these with canal gravity-fed irrigation systems of the Upper Pumpanga River Integrated Irrigation System (UPRIIS), Philippines
2. GHG emissions from farm inputs
Farm inputs include agrochemicals (fertilisers, herbicides, pesticides, insecticides and fungicides), fuels and oils, machinery, labour and farm yard manure. Energy consumption in agriculture is directly related to the development of technology and the level of production from a system (Hatirli et al., 2006; Ozkan et al., 2004). However, reuse technologies increase the use of farm input; resulting in increases in GHG emissions.
Compared to the 1950s, the global use of fertilisers in 1999 has increased substantially with 23 times more nitrogen (N), almost eight times more phosphorus (P) and >4 times more potassium (K) since the 1950s (Smil, 1999). Nitrogen fertiliser is a significant concern as >50% of applied N is either lost through leaching or released to the atmosphere as N gases including nitrous oxide (N2O) (Verge et al., 2007), which has 296 times more global
warming potential than CO2. From 1990 to 2002, N2O emissions from N fertilizer increased
by 18.7% to 444 Mt CO2e (Verge et al., 2007). The worldwide use of agricultural pesticides
has increased by an average of 3%/yr from an equivalent value of US$20.5 billion in 1993 to US$27.5 billion in 2003, resulting in substantially increased GHG emissions (Vlek et al., 2003).
type. However, GHG emissions from agrochemicals at the farm level and due to water reuse technologies have been largely ignored.
Emission associated with farm machinery is another area of concern. Of the total energy used in world agriculture, about 51% goes into farm machinery manufacture and 45% into the production of chemical fertiliser (Helsel, 1992). Around 83.7 MJ of energy is required to produce 1 kg of farm machinery (Stout, 1990), yet the GHG emissions from the production of farm machinery has not been reflected in the literature. More importantly, water pumping and reuse may exacerbate the salinity problem. Sodic soils which are less permeable to water and air, require more energy for tillage (Guarnieri et al., 2005), and thus more tractor hrs/ha is needed to till the farm. Some differences in GHG emissions in pumping and canal irrigation systems may be presented, but they have not been researched.
Similarly, many land use activities such as the production, transportation and utilisation of different land use products need fuels and oils. The production, transportation and combustion of fuels emit significant amounts of GHGs, but the emissions associated with these activities are again not properly accounted for (Gower, 2003). This study considers all these factors and compares the GHG emissions from farm inputs for pump and canal irrigation systemsin the Upper Pumpanga River Integrated Irrigation System, Philippines.
3. Study area
by Diversion Canal No. 1, which gets water from the Pantabangan Reservoir; and the TRIS main canal, which gets its water from the Talavera River through a run-off-the-river diversion dam. The major direction of water flow is from northeast to southwest. The TRIS main canal first supplies water to an irrigation system north of, and contiguous to, District I, called TRIS-Upper. The area is quite flat with elevations of around 20 m above sea level. Soils are Vertisols, Entisols, and Inceptisols, and have typically silty clay, silty clay loam, clay loam, and clay textures. The climate is characterized by two pronounced seasons, dry from November to April, and wet for the rest of the year. The average annual rainfall is about 1900 mm, of which 90% falls in the wet season (Tabbal et al., 2002). Our study was conducted in the 2000-2001 dry season, which started with the first release of water into the main canals on November 19, 2000, and ended with the harvest of the last rice crop on May 18, 2001.
In the upper part (northeast) of District I, comprising 10,512 ha, canal water is used for irrigation. The more southwest we go the more people irrigate rice with reused water. In the lower (southwest) part of District I, where only 51% of rice area is grown using canal water, 49% area is irrigated using pump water. There are a total of 1,154 pumps in use. The survey data of both canal and pump irrigation and detailed information about the different farms inputs (machinery, agrochemicals, fuels and oils) are given in Appendix 1 and 2.
4. Water accounting and reuse estimation
4.1 Estimation of water reuse
percolation rate within the rice fields. The volumes of extracted water were compared with estimates of water that percolated into the shallow aquifers. When the volume of pumped water was less than the amount of water percolated from upstream, the pumped water was classified as reused within the system. When the pumped water exceeded upstream percolation, it was classified as a net output in the system.
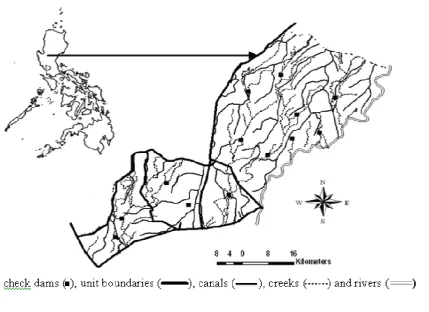
The UPRIIS was designed to reuse surface water by building check dams in creeks and drainage ways within the irrigated area. Farmers have contributed to water reuse by constructing small dams themselves that have been „sanctioned‟ by the irrigation system management. There are a total of 15 formal check dams in District 1, which are operated and maintained by either National Irrigation Administration (NIA) or by groups of farmers. These check dams have structures for releasing water to supply additional water to the downstream canals for irrigation purposes. Water flows at inlets were calculated at nine of the 15 check dams to obtain flow volumes from the established rating curves (Hafeez, 2003).
4.2 Water accounting and balance
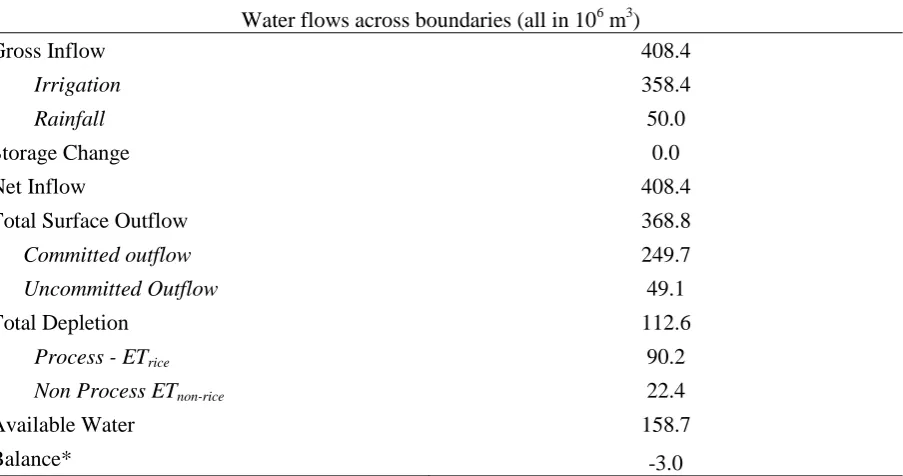
The water accounting focussed on surface water with net flows of water across the lower boundary (rootzone) being computed separately. All water flows were aggregated as seasonal totals from November 19, 2000 until May 18, 2001. The gross inflow was rainfall plus all surface irrigation water. The net inflows being the difference between gross inflows and the changes in water stored at the surface (mainly in the canals) and in the rootzone of the crops from beginning to end of the cropping season. Since canals were dry before the start of the season and after harvest of the last crop, the change in surface water storage was zero. The change in stored soil water in the rootzone was negligible since the dry season crop followed straight after a wet season crop. Consequently, we assumed that the amount of soil water available was the same after a harvested wet–season crop as after a harvested dry– season crop. Therefore, the net inflow was the same as the gross inflow. All surface outflows were considered “committed” when they flowed into a neighbouring spatial unit or further downstream in the irrigated area of District I. All water flowing out of District I was considered “uncommitted” since there was no immediate major water user downstream of District I. The only outflow considered “depletion” was evapotranspiration (ET) since no water percolated to irretrievably deep or saline groundwater. As the main purpose of UPRIIS is to irrigate rice, only rice ET was considered as “process depletion,” and all non-rice ET as non-process depletion (following Loeve et al., 2004). The transpiration from non-rice crops is a beneficial water use, but no data on non-rice crops were available for this study, so water use for these crops could not be quantified. Further details on the water balance and associated measurements are given by Hafeez (2003).
4.3 Water performance indicators
combination of the two. The WP indicators were calculated for gross inflow, available water and ETrice with and without water reuse following the procedures presented by Molden
(1997). Rice yield was obtained from the NIA who kept track of the yield of each farmer as
reported to the Farmer Irrigation Associations (FIA) in the area from which total rice production was calculated.
5 GHG estimation
5.1 Estimation of GHG emissions from farm machinery2
Farm machinery is an essential farm input in modern agriculture. On average, approximately 12.8 kgCO2e of GHG is emitted to produce 1 kg of farm machinery (Wells,
2001). Some GHGs would be emitted while transporting tractors from manufacturing sites to the rice farms, however it is negligible on a per ha basis and is thus not considered in this study. The life span of a tractor (12,500 hr), tractor accessories (2000 hr) and pumps (12,000 hr) were taken from Harris (2004) while the weight of tractor and tractor accessories3 was obtained from the manufacturing company (Kubota, Philippines, 2008). The lifespan of farm machinery used for rice farming was derived from farmers‟ survey data (Appendix 1 & 2). From that information, the following equation by Maraseni et al. (2007) was used to estimate the GHG emissions attributed to tractor during rice production:
GHGs emission (kgCO2e) = Weight of tractor (kg) x 12.8 kgCO2e/kg x Proportion of lifespan
of farm machinery used for rice production………(1)
2 In rice cropping, farm machinery includes tractors and tractors‟ accessories, pumping machines and pipes. 3
5.2 Estimation of GHG emissions from agrochemicals
Kim and Dale (2003) estimated the global warming impact (GWI) value (gm CO2
equivalent/kg) of most agrochemicals (Table 1). The GWI value included all three GHGs (CO2, CH4 and N2O) and their impact due to their production, packing, transportation and
application.In addition,GWI also considered the emission of N2O during the process of
de-nitrification after applying nitrogen fertilisers (Kim and Dale, 2003) As it covers broad impact, we used these values for the estimation of GHG emissions by agrochemicals. However, GWI for insecticides, fungicides, herbicides and molluscides is not available in their estimation. These values for insecticides, fungicides and herbicides were taken from Barber (2004) and for molluscides, which was not available even in Barber‟s study, on average of all three was used.
5.3 Estimation of GHG emissions from fuels and oils
Production, transportation and combustion of diesel and oil produce significant amount of GHG emissions. For this study 3.8 kgCO2e of GHG emissions per litre of diesel
(Flessa et al., 2002) and 2.68 kgCO2e/L oil (EIA, 2008) was used. The amount of fuels and
oil consumed by pumps and tractors in different phases of rice production is derived from farm surveys (Appendix 1 and 2).
6. Results and discussions
Detailed site characteristics about District 1 in the UPRIIS are provided in Table 2.
6.1 Water accounting
Results for water balancing and water accounting for District 1 are shown Table 3.
Due to limited rainfall during dry seasons, irrigation comprised 88% of all surface water inflows. Out of all surface water outflows, only 4.9 x10⁷ m3 was uncommitted as it flowed directly into the Talavera River. All other outflows were committed and flowed into the downstream irrigated area of District I. On a per unit area basis, the average rice ET was 665 mm for the whole season and 3.7 mm/d. The non-rice ET was 503 mm for the whole season and 2.8 mm/d.
6.2 Quantification of water reuse
The total volume of water derived from check dams, groundwater and creeks in District 1 is about 2.71 x 10⁷ m3, which is 38% of the percolation volume (7.0 X 10⁷ m3) (Table 4). As the percolation volume is greater than the pumping volume, groundwater pumping represents the reuse of percolated water. Hafeez et al. (2008) reported that the reuse of surface water through check dams was well distributed across the area and increased linearly with 4.6 x 10⁶ m3 per added 1,000 ha. At the District I level, the reuse of surface water was 22% of the applied surface water and 57% of the available water. Also, the water reuse by pumping was 7% of the applied surface water and 17% of the available water. The total amount of reused water from pumping (2.8 x 10⁷ m3) being equivalent to 30% of the water consumed through rice evapotranspiration (9.0 x 10⁷ m3) during the dry season in 2001 (Tables 3 and 4).
6.3 Water productivity indicators
respect to gross inflow (WPgross) without water reuse is 0.15 kg grain/m3 water but it rose to
0.19 kg grain/m3 with the reuse of water, indicating the critical role of water reuse in enhancing water productivity. Similarly, water productivity with respect to evapotranspiration of rice (WPETrice) without water reuse was 0.67 kg grain/m3 water.
However, when we consider water reuse, the WPETrice was 0.86 kg grain/m3, which was
considerably higher than WPETrice without water reuse. Also, water productivity with respect
to available water (WPavailable) without water reuse was 0.38 kg grain/m3 water while
WPavailable with water reuse was 0.49 kg grain/m3. This highlights that capturing of water
reuse plays a very significant factor in improving water productivity at the system level.
6.4 GHG emissions from pump and canal irrigation systems
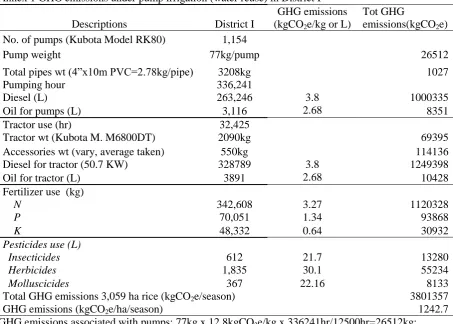
The analysis indicated that there are significant differences in GHG emissions in pump (with water reuse) and canal (without water reuse) irrigation systems due to the application of various farm inputs. The total amount of GHG emissions from pump irrigation is around 1.47 times that of the canal irrigation system. In total, for each hectare, 1242.7 kgCO2e will be emitted into the atmosphere from each season‟s rice crop from pump
irrigation system, and 844.5 kgCO2e from canal irrigation systems (Table 6). There are two
seasons of rice farming in the research area. So, if we assume similar emissions in the other season, the pump and canal irrigation systems would emit 2485 kgCO2e/ha/yr and 1689
kgCO2e/ha/yr, respectively.
Canal irrigation does not need pumps, pipes, fuels and oils, but pump irrigation needs these farm machineries to run water pumps. Therefore, pump irrigation involves additional GHG emissions (338.7 kgCO2e/ha/season) through the use of these machineries. Both canal
kgCO2e/ha/season from canal irrigation systems. The slightly higher GHG emissions from
pump irrigation systems is probably due to salinity problems emerging from water reuse in the pump irrigation systems. Since sodic soils become less permeable to water and air, they require more energy for tillage (Guarnieri et al., 2005), more tractor time is required (107.5 hr/ha in pump irrigation and 103.4 hr/ha in canal irrigation) and thus emit more GHGs.
The total amount of GHG emissions from agrochemical usage under pump irrigation is 432.2 kgCO2e/ha/season and canal irrigation is 390.4 kgCO2e/ha/season (Table 6). The
higher amount of emissions associated with agrochemicals in pump irrigation is due to higher use of all three fertilisers (N = 112kg/ha vs 100kg/ha; P = 22.9kg/ha vs 20kg/ha; and K = 15.8kg/ha vs 15.3 kg/ha) than that from canal irrigation. This is because salt-affected soils have limited nutrients in the soils and higher amounts of fertiliser are needed to compensate them (Stephens et al., 1995).
5. Conclusions
Increasing water productivity is often recommended as a path to address water scarcity problems. However, increasing water productivity through the use of energy intensive technology and heavy use of energy inputs could increase dependency on fossil energy, which not only threaten the environmental sustainability of the practice, but could increase competition for energy uses among different sectors. The rice-based surface irrigation system was analysed to explore the water productivity and GHG emissions implications of water reuse in the Upper Pumpanga River Integrated Irrigation System (UPRIIS) in Central Luzon, Philippines.
water from pumping is equivalent to 30% of the water lost through rice evapotranspiration during the dry season 2001. Water performance indicators with and without water reuse can point to possibilities to further increase the general efficiency of water use. We indicate that the quantification of the amount of water reuse is crucial for understanding and finding water use efficiency at the irrigation system level.
Results indicate that water reuse contributes significantly to water productivity. However, it does increase GHGs due to pumping. Achieving high water productivity would require additional use of fossil energies, which in turn could increase the energy use competition and can result in a decrease in economic results. Given the increasing concerns on climate change and sustainable energy use, an optimal combination of water and energy use is essential.
6. Acknowledgements
We would like extend our thanks to the International Rice Research Institute, Philippines for supplying rice invaluable data and the Australian Centre for Sustainable Catchments, University of Southern Queensland, for logistical and other support.
References
Barber A. (2004) Seven Case Study Farms: Total Energy & Carbon Indicators for New Zealand Arable & Outdoor Vegetable Production, AgriLINK New Zealand Ltd.
Batty, J. C. and Keller, J. (1980) Energy requirements for irrigation. In Handbook Of Energy Utilization in Agriculture. D. Pimentel (ed.), Boca Raton, FL: CRC Press. pp. 35-44. Bouman, B.A.M, Tuong, T.P. (2001) Field water management to save water and increase its
productivity in irrigated rice. Agric. Water Manage. 49:11-30.
Cabangon, R.J., Tuong, T.P., Castillo, E.G., Bao, L.X., Lu, G., Wang, G.H., Cui, L., Bouman, B.A.M., Li, Y., Chen, C., Wang, J. (2004) Effect of irrigation method and N-fertilizer management on rice yield, water productivity and nutrient-use efficiencies in typical lowland rice conditions in China. Rice Field Water Environ. 2:195-206. Dong, B., Molden, D., Loeve, R., Li, Y.H., Chen, C.D., Wang, J.Z. (2004) Farm level
practices and water productivity in Zanghe Irrigation System. Rice Field Water Environ. 2:217-226.
EIA (Energy Information Administration) (2008) Fuel and energy source codes and emission coefficients, Energy Information Administration, Department of Energy, US Government, accessed 22 July 2008 from http://www.eia.doe.gov
Flessa H., Ruser R., Dorsh P., Kamp T., Jimenez M.A., Munch J.C. & Beese F. (2002) 'Integrated evaluation of greenhouse gas emissions (CO2, CH4, N2O) from two farming
systems in southern Germany', Agriculture, Ecosystems & Environment, 91; pp 175-189. Gleick, P.H., Wolff, E.L. and Chalecki, R.R. (2002) The New Economy of Water: The Risks and Benefits of Globalization and Privatization of Freshwater. Oakland, CA: Pacific Institute for Studies in Development, Environment, and Security. 48 pp.
Guarnieri, A., Fabbri, A. and Molari, G (2005) Influence of Sodicity and Salinity on the Mechanical Properties of two Italian Soils Biosystems Engineering, vol 91 (2), pp239-243
Guerra, L. C., Bhuiyan, S. I., Tuong, T. P. and Barker, R. (1998) Producing more rice with less water from irrigated system. SWIM paper 5. IWMI/IRRI, Colombo, Sri Lanka. Hafeez, M., B.A.M. Bouman, N. D. Giesen, S. Mushtaq, P. Vlek and Khan S. (2008) An
Estimation of Water Re-use, Cost of Pumping at Different Spatial Scales in a Gravity Irrigation System in Philippines. Physics and Chemistry of the Earth 33 (2008) 115– 126
Hafeez, M.M. (2003) Water accounting and productivity at different scales in a rice irrigation system: a remote sensing approach. Ecology and Development Series, No. 8, University of Bonn, Germany.
Harris, G (2004) Farm machinery cost for broadacre cropping. Department of Primary Industries and Fisheries, Toowoomba, Australia.
Hatirli, S., Ozkan, B., Fert, C. (2006) Energy inputs and crop yiueld relationship in greenhouse tomato production. Renewable Energy, 31, 427-438.
Helsel, Z. (1992) Energy and alternatives for fertiliser and pesticides use (Chapter 13). In Energy in World Agriculture; Elsevier, Fluck, RC; 177-201
Kubota Philippines (2008) Different brochures, specifications, manuals and literatures. Kubota, http://www.kubota.com.ph, accessed from 12/01/06 to 3/04/06
Maraseni, T.N., Cockfield, G & Apan, A (2007) A comparison of greenhouse gas emissions from inputs into farm enterprises in Southeast Queensland, Australia, Journal of Environmental Science and Health, Part A, Vol 42 pp 11-19.
Ozkan, B., Akcaoz, H., Fert, C. (2004) Energy input-output analysis in Turkish agriculture. Renewable Energy, 29, 39-51.
Rijsberman, F. R. (2006) Water scarcity: Fact or fiction? Agricultural Water Management. 80, 5–22.
Singh H, Mishra D, & Nahar N.M. (2002) Energy use pattern in production agriculture of a typical village in arid zone, India - part I. Energy Conversion and Management, 43, 2275-2286.
Smil, V. (1999) Global population and the nutrient cycle. Sci. American 277, 58–63.
Stephens, D.B., Beyrouty, C.A., Gbur, E.E. and Norman, R.J. (1995) Salt effect on K influx by two rice cultivars differing in salinity tolerance, a book chapter in Root demographics and their efficiencies in sustainable Agriculture, grasslands and forests ecosystems, Proceeding of the fifth symposium of the International Society of Root research held 14-18 July 1996 at Madren Conference Centre, South Carolina, USA Stout, BA. (1990) Handbook of Energy for World Agriculture London: Elsevier Applied
Science;
Tabbal, D.F., Bouman, B.A.M., Bhuiyan, S.I., Sibayan, E.B., Sattar, M.A. (2002) On-farm strategies for reducing water input in irrigated rice: case studies in the Philippines. Agric. Water Manage. 56:93-112.
Tuong, T. P., Bouman, B. A. M. (2003) Rice production in water scarce environments. In “Water Productivity in Agriculture: Limits and Opportunities for Improvement” (J. W. Kijne, R. Barker, and D. Molden, Eds.), pp. 53–67. CABI Publishing, Wallingford, UK.
Tuong, T.P., Bouman, B.A.M., Mortimer, M. (2005) More rice, less water: integrated approaches for increasing water productivity in irrigated rice-based systems in Asia. Plant Prod. Sci. 8:231-241.
Verge, X.P.C., Kimpe, C.D. and Desjardins, R.L. (2007) Agricultural production, greenhouse gas emissions and mitigation potential, Agricultural and Forest Meteorology vol 142 pp 255–269
Vlek, P., Rodriguez-khul, G. & Sommer, R. (2003) Energy use and CO2 production in
tropical agriculture and means and strategies for reduction and mitigation. Environment Development and Sustainability, 6, 213-33.
Figure 1 Location of the District 1 of the UPRISS, Philippines Table 1Global warming impact (GWI) (kgCO2e/kg) of agrochemicals
Source: 1Kim and Dale (2003) and 2 Barber (2004)
Table 2 Main characteristics of District I, UPRIIS
Descriptions District I
Total area (ha) 18,003
Rice area (ha) 13,571
Upland crop (ha) 1,629
Rest (ha) 2,803
Canal Rice area (ha) 10512
Pump Rice area (ha) 3059
Rice Yield (t ha-1) 5.31
FIA‟s (number) 66
Farmers (number) 9,910
Pumps (number) 1,154
Pump users (number) 1586
Check Dams (number) 15
Chemicals GWI1 Chemicals GWI2 Chemicals2 GWI
Nitrogen 3.270 Insecticides 21.7 Molluscides 22.16
Phosphorus 1.340 Herbicides 30.10
[image:17.595.67.532.520.705.2]Table 3 Water accounting components in District I, UPRIIS
Water flows across boundaries (all in 106 m3)
Gross Inflow 408.4
Irrigation 358.4
Rainfall 50.0
Storage Change 0.0
Net Inflow 408.4
Total Surface Outflow 368.8
Committed outflow 249.7
Uncommitted Outflow 49.1
Total Depletion 112.6
Process - ETrice 90.2
Non Process ETnon-rice 22.4
Available Water 158.7
Balance* -3.0
[image:18.595.67.528.388.510.2]* Calculated as net inflow – total surface outflow (committed and uncommitted) – total depletion (Rice ET and non-rice ET)
Table 4 Volume of percolation, and water reuse from groundwater, creek and check dams for District I
Descriptions District I
Rice irrigated area by pumps (ha) 3,059
Groundwater pumping (106 m3) 25.93
Pumping from creek (106 m3) 1.15
Total pumping (106 m3) 27.07
Water reuse from check dams (106m3) 89.69
[image:18.595.66.531.536.635.2]Percolation (106 m3) 70.06
Table 5. Water productivity indicators with and without water reuse for District I Descriptions Water Productivity (kg grain m-3 water) -
Without Water Reuse With Water Reuse
Rice area (ha) 10512 13571
WPgross 0.15 0.19
WPriceET 0.67 0.86
Table 6 GHG emissions (KgCO2e/ha/season) from different farm inputs in rice farming from pump
and canal irrigation systems
Sources
Pump irrigation (with water reuse)
Canal irrigation (without water reuse)
Pumps, pipes, fuels and oils 338.7 NA
Tractors, accessories, fuels & oils 471.8 454.1
Agrochemicals 432.2 390.4
Total 1242.7 844.5
Annex 1 GHG emissions under pump irrigation (water reuse) in District I
Descriptions District I
GHG emissions (kgCO2e/kg or L)
Tot GHG
emissions(kgCO2e)
No. of pumps (Kubota Model RK80) 1,154
Pump weight 77kg/pump 26512
Total pipes wt (4”x10m PVC=2.78kg/pipe) 3208kg 1027
Pumping hour 336,241
Diesel (L) 263,246 3.8 1000335
Oil for pumps (L) 3,116 2.68 8351
Tractor use (hr) 32,425
Tractor wt (Kubota M. M6800DT) 2090kg 69395
Accessories wt (vary, average taken) 550kg 114136
Diesel for tractor (50.7 KW) 328789 3.8 1249398
Oil for tractor (L) 3891 2.68 10428
Fertilizer use (kg)
N 342,608 3.27 1120328
P 70,051 1.34 93868
K 48,332 0.64 30932
Pesticides use (L)
Insecticides 612 21.7 13280
Herbicides 1,835 30.1 55234
Molluscicides 367 22.16 8133
Total GHG emissions 3,059 ha rice (kgCO2e/season) 3801357
GHG emissions (kgCO2e/ha/season) 1242.7
GHG emissions associated with pumps: 77kg x 12.8kgCO2e/kg x 336241hr/12500hr=26512kg;
GHG associated with pipes = 3208kg x 12.8kgCO2e/kg x 6mon/240mon= 1027kg;
GHG emissions associated with tractors: 2090kg x 12.8kgCO2e/kg x 32425hr/12500hr=69395kg;
[image:19.595.74.528.196.520.2]Annex 2 GHG emissions under canal irrigation (without water reuse) in District I
Descriptions District I
GHG emissions (kgCO2e/kg or L)
Tot GHG emissions (KgCO2e)
Tractor use (hr) 107,222
Tractor wt (Kubota M. M6800DT) 2090kg 229472
Accessories wt (vary, average taken) 550kg 377421
Diesel for tractor (50.7 KW) 1087231 3.8 4131478
Oil for tractor (L) 12869 2.68 34489
Fertilizer use (kg)
N 1,051,200 3.27 3437424
P 210,240 1.34 281722
K 160,834 0.64 102934
Pesticides (L)
Insecticides 3,048 21.7 66142
Herbicides 6,307 30.1 189841
Molluscicides 1,156 22.16 25617
Total GHG emissions10,512 ha rice (kgCO2e/season) 8877781
GHG emissions (kgCO2e/ha/season) 844.5
GHG emissions associated with tractor: 2090kg x 12.8kgCO2e/kg x 107222hr/12500hr=229472kg;