E
d
u
ca
tio
n an
d T
rainin
g
Growing Up In Scotland Study
GROWING UP IN SCOTLAND STUDY
GROWING UP IN RURAL SCOTLAND
Lynn Jamieson
Centre for Research on Families and Relationships,
University of Edinburgh
with
Paul Bradshaw and Rachel Ormston
Scottish Centre for Social Research
It should be noted that since this research was commissioned a new Scottish government has been formed, which means that the report reflects commitments and strategic objectives
conceived under the previous administration. The policies, strategies, objectives and commitments referred to in this report should not therefore be treated as current Government
policy.
This document was published by Education Analytical Services, Scottish Government, Victoria Quay, Edinburgh, EH6 6QQ.
If you have any enquiries about these reports please contact the Dissemination Officer on 0131-244-0894;
Or by e-mail on [email protected] or visit our website www.scotland.gov.uk/insight
ACKNOWLEDGEMENTS
First and foremost, the authors of the report would like to thank all the families who have given up their time to take part in the study and have supported it continuously sweep by sweep.
The Growing Up in Scotland study is very much a collaborative venture. We owe a huge debt of gratitude to our colleagues in NatCen’s operations and computing departments and to our team of interviewers and supervisors for conducting the interviews with such dedication and professionalism.
We would also like to thank Sharon Davidson, Amanda Carty and Euan Dick at the Scottish Government, and the study’s Policy Advisory Group, for their informed direction of the study.
CONTENTS
EXECUTIVE SUMMARY 1
Family circumstances of urban and rural babies and toddlers 1 Health and wellbeing of rural babies and toddlers 1
Child friendly areas? 2
Service use 2
Conclusion 3
CHAPTER ONE INTRODUCTION 4
About the Growing Up in Scotland (GUS) study 4
Policy background 4
Structure of the report 6
Defining urban and rural areas 6
Key issues in analysis of urban-rural differences 7
CHAPTER TWO FAMILY CIRCUMSTANCES OF URBAN AND RURAL BABIES AND
TODDLERS 8
Introduction 8
Age of mother 8
First child? 9
Family structure 10
Parents’ education 11
Parents’ employment 12
Family income and resources 14
CHAPTER THREE HEALTH AND WELL-BEING OF RURAL BABIES AND CHILDS 17
Introduction 17
Birth weight 17
Reported health problems or disabilities 17 Contact with NHS for health problems 18 Parental concerns about child’s development 18
Health-influencing behaviour 19
Conclusion 21
CHAPTER FOUR CHILD FRIENDLY AREAS? 23
Introduction 23
Access to grandparents 23
Access to informal support and advice 24
Contact with other children 26
Conclusion 27
CHAPTER FIVE SERVICE USE 28
Introduction 28
Ante-natal classes 28
Information and advice during pregnancy 29
Childcare 30
Awareness of government initiatives 33
CHAPTER SIX CONCLUSION 34
LIST OF TABLES
Table 1 Number of Live Births per 1000 women 2001 by area urban-rural classification (source: Registrar General) ...6 Table 2 Relative proportions of Scottish children across urban-rural areas:
Growing Up in Scotland (GUS) sample and census data ...7 Table 3 Age of mother at birth of first child by urban-rural ...9 Table 4 Mothers/respondents who were first time mothers by urban-rural ....10 Table 5 Family structure by urban-rural ...10 Table 6 Respondents/main carers’ educational qualifications by urban-rural 12 Table 7 Children in households with no parent or carer working by
urban-rural ...13 Table 8 Mothers working status by urban-rural...14 Table 9 Children living in households in different income bands by
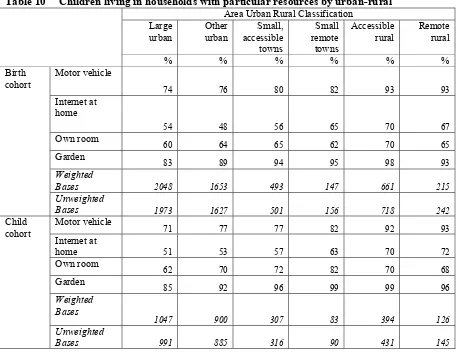
urban-rural ...15 Table 10 Children living in households with particular resources by urban-rural
...16 Table 11 Percentage of babies with low birth weights by urban-rural...17 Table 12 Percentage who had one or more accidents involving medical
attention by urban-rural...18 Table 13 Percentage of children for whom no concerns are reported concerning their development or behaviour by urban-rural ...19 Table 14 Percentage of respondents saying they planned to breast feed before
the baby was born by urban-rural...19 Table 15 Percentage of respondents saying they ever breastfed by urban-rural
...20 Table 16 Percentage of respondents/main carers who smoke by urban-rural...20 Table 17 Percentage of babies and toddlers with few books (0-10 books) for
them at home by urban-rural...21 Table 18 Percentage of babies and toddlers who did not watch any TV in the past week by urban-rural...21 Table 19 Percentage of children with at least one grandparent within a 20-30
minute drive by urban-rural ...24 Table 20 Percentage of children reported as having a close or very close
relationship with at least one grandparent by urban-rural...24 Table 21 Who mothers or main carers would call on first when needing help.25 Table 22 Percentage of respondents/main carers who has any friends or family with medical knowledge or training from whom they would feel comfortable asking for advice...26 Table 23 Frequency of toddlers being taken to visit friends with young children
...26 Table 24 Percentage who have regularly attended a mother toddler group in the last year ...27 Table 25 Percentage of first-time mothers in the birth cohort who did not attend any ante-natal classes by urban-rural ...28 Table 26 Reasons for non-attendance given by first-time mothers in the birth
cohort who did not attend any ante-natal classes by urban-rural ...29 Table 27 Percentage of mothers (birth cohort, excluding first time mothers)
Table 28 Percentage of respondents/main carers who get help with childcare on a regular basis from any of a list of the main formal and informal sources of help...31 Table 29 Percentage of mothers/main carers, birth cohort, who do not get help with childcare on a regular basis giving various reasons for not using childcare ...31 Table 30 Percentage of families in the birth cohort who are using childcare,
who currently use various types of childcare...32 Table 31 Percentage of families in the child cohort who are using childcare
who currently use various types of childcare...32 Table 32 Percentage of mothers/carers citing child-centred reasons for use of
1
EXECUTIVE SUMMARY
This report uses data from the Growing up in Scotland (GUS) study to explore what is distinctive about growing up in rural, remote and small-town Scotland in comparison with urban Scotland. Findings are based on the first sweep of GUS, which involved interviews with the main carers of 5,217 children aged 0-1 years old and 2,859 children aged 2-3 years old, carried out between April 2005 and March 2006.
Family circumstances of urban and rural babies and toddlers
The overview report on sweep 1 of GUS highlighted many significant differences in the lives and experiences of young children and their families depending on their socio-demographic circumstances. Analysis of the circumstances of families in urban and rural areas highlights that, although there is variety in each kind of area, children in rural areas are somewhat more likely to be born into relatively more advantaged situations. In particular, babies and toddlers in rural areas are:
• more likely than those in urban areas to be born to older mothers (in the birth cohort, 11% of mothers in remote rural areas were teenagers when their first child was born compared with 18% of mothers in large urban areas)
• less likely to live in lone parent households (just 7% of babies living in accessible and remote rural areas live in lone parent households, compared with 23% in large urban and 24% in other urban areas)
• more likely to be born to mothers with degree-level qualifications and less likely to be born to mothers with no qualifications (15% of mothers of toddlers in large urban areas have no qualifications compared with just 4% in remote rural areas)
• less likely to live in households where neither parent/carer works (fewer than 10% of rural children live in households with nobody in employment in comparison to nearly a quarter in large urban areas in both cohorts and around a fifth in other urban areas and accessible small towns)
• less likely to live in low income households (around a third of children in large or other urban areas live in households with incomes less than £15,000 a year in comparison to around one in five in accessible and remote rural areas)
• more likely to live in households with access to a car, home internet and a garden.
Rural children are also:
• less likely to have been born as a result of an unplanned pregnancy (16% of babies in remote rural areas compared with 26% in large urban areas), and
• less likely to be their mothers’ first child (52% of mothers of babies in large urban areas were becoming a parent for the first time, compared with just 43% of mothers in remote rural areas).
Health and wellbeing of rural babies and toddlers
2
subjective (e.g. reported use of NHS services) measures. Rural babies and toddlers are no more likely than their urban counterparts to have a low birthweight, have a long-term health problem or disability (as reported by their main carer), or have contacted the NHS about general problems or because of an accident. There were also few differences in the extent to which parents engage in activities with their child (like drawing, painting, playing games, etc.) which may improve their child’s educational development and/or well-being by area.
However, concerns about toddlers’ development were somewhat lower in remote rural areas – 90% have no concerns, compared with between 78% in small accessible towns and 84% in small remote towns. At the same time, parental reporting of positive health influencing behaviours like breast feeding was somewhat higher in rural areas – for example, 75% of mothers in remote rural areas breastfed their child, compared with 60% in large urban areas. Mothers in rural areas were less likely to smoke than their urban counterparts (17% of mothers of babies in remote rural compared with 28% in large urban areas), while babies (but not toddlers) in rural areas were less likely to watch any television than their urban counterparts. Many of these differences in parental health influencing behaviour by area are attributable to differences in the characteristics of parents between areas – in particular, the fact that mothers in rural areas tend to be older and better educated.
Child friendly areas?
The GUS data so far does not suggest dramatic differences in the child friendliness of urban versus rural environments in terms of the social networks and informal support available to young children and their families. While fewer children in rural areas have a grandparent living nearby (74% of babies in remote rural areas, compared with 84% of babies in large urban areas), a majority of parents across all areas say their child has a close relationship with at least one grandparent (albeit slightly lower in remote rural areas). In terms of other support, mothers in rural areas were somewhat more likely than mothers in urban areas to say they would turn to friends and neighbours if they needed help with childcare at short notice (13% in accessible and 18% in remote rural areas, compared with 9% in large urban areas). However, there was little difference in how easy or difficult mothers in different areas said they would find it to arrange such help. Moreover, there is some evidence that children in rural areas may have more ‘child rich’ social lives, with 70% of toddlers in remote rural areas compared with just 60% of children in large urban areas taken to visit friends with other young children at least weekly and mothers in remote rural areas almost twice as likely to regularly take their toddlers to mother and toddler groups as their counterparts in large urban areas (67% compared with 36%).
Service use
Many of the differences in service use by family type, household income and maternal age noted in the overview report on GUS sweep 1 (Anderson, Bradshaw et al, 2007) persist within urban and rural areas. However, we did find some potentially important differences in service use between areas. First, although there was no consistent variation in the proportion of first-time mothers attending ante-natal classes between
3
access problems – including lack of knowledge/awareness of classes, no classes available, or travel problems – stood out as a particular problem for mothers in rural areas (32% in remote and accessible rural areas (combined) mentioned at least one of these reasons, compared with just 18% in large urban areas).
In terms of other sources of advice during pregnancy, mothers in remote rural areas were the most likely to use books, magazines or newspapers and to use the Ready, Steady, Baby booklet. Urban/rural differences were more marked among mothers who already had children than among first-time mothers, which may suggest that rural mothers are more likely than their urban counterparts to continue consulting such print-based sources after their first child.
In respect of childcare services, families in remote rural areas and small remote towns are less likely than families in urban areas to make regular use of any help looking after their babies (48% in remote rural areas compared with 61% in large urban areas). However, this difference was not apparent for toddlers. Rural mothers were no less likely to be in paid employment, but they were less likely to be lone parents. Thus it is possible this difference is partly explained by the fact that the option of sharing child care between two parents may be more feasible for rural families.
Rural families also used different types of childcare, reflecting established differences in the childcare mix available in different areas. In particular, parents in rural areas and remote small towns were more likely than parents in large urban areas to use childminders (16% in remote rural areas, compared with 7% in large urban areas), and
less likely to use nursery or crèche provision (20% in remote rural areas and just 10% in small remote towns, compared with 35% in large urban areas).
Conclusion
Sweep 1 of GUS provides some evidence that children in rural areas may be more likely to live in favourable socio-economic circumstances than their urban counterparts. This is associated with greater exposure to positive parental behaviours, such as breastfeeding, among rural babies. However, in many other respects the early experiences of children in urban and rural areas in terms of service use, health problems and contact with significant others are not very different. Moreover, other evidence suggests that families in rural areas may be relatively disadvantaged in respect of easy access to ante-natal classes and having grandparents living nearby, for example.
4
CHAPTER ONE
INTRODUCTION
1.1 This report uses the first sweep of the Growing up in Scotland (GUS) study to explore what is distinctive about growing up in rural, remote and small-town Scotland in comparison with urban Scotland.
About the Growing Up in Scotland (GUS) study
1.2 The Growing Up in Scotland study (GUS) is an important new longitudinal research project aimed at tracking the lives of a cohort of Scottish children from the early years, through childhood and beyond. Its principal aim is to provide information to support policy-making, but it is also intended to be a broader resource that can be drawn on by academics, voluntary sector organisations and other interested parties.
1.3 GUS is based on a cohort or longitudinal design involving the recruitment of a 'panel' of children (and their families) who will be revisited on a number of occasions over an extended period of time. Members of the panel were identified in the first instance from Child Benefit records. Focusing initially on a cohort of 5,217 children aged 0-1 years old and a cohort of 2,859 children aged 2-3 years old, the first wave of fieldwork began in April 2005 and finished in March 2006.
1.4 For the first year of the study, interviewers sought to contact the ‘main carer’ of the child named in the Child Benefit records. In virtually all cases (99%), this proved to be the child’s natural mother. The first interview collected data on a wide range of topics, including: pregnancy, birth and early parenting, childcare, formal and informal sources of support for parents and children, child health and development, and parental health.
1.5 This report is one of a series of three exploring findings from the first sweep of the survey on topics of particular interest to policy makers, practitioners and others. Other reports in this series examine informal care and support networks used by families with young children, and the characteristics and experiences of families living in advantaged compared with disadvantaged areas of Scotland. In addition, an overview report is available which provides key findings across all the topics included in the first sweep of the GUS study (Anderson, Bradshaw et al, 2007).
Policy background
5
areas, and their differing patterns of service use. The overview report on the first sweep of data for GUS started to examine this in respect of childcare, noting differences in patterns of use, costs and perceptions of the degree of choice available to families in urban and rural areas. In this report, we revisit and expand on some of this analysis, as well as exploring use of ante-natal services and information and advice used during pregnancy by area.
1.7 Second, in terms of targeting policies and services to meet the needs of families across Scotland, there is a clear policy interest in understanding whether children growing up in different areas experience better or worse outcomes in terms of their health, safety and well being. The notion of the ‘rural idyll’ as an ideal place to bring up healthy, happy children persists in popular discourse. By tracking babies and toddlers over time GUS will allow us to explore whether any evidence for this romanticised notion of rural life actually exists, and will enable us to provide more concrete information on the specific needs of rural families to inform policies for these areas. However, even at this first sweep we can start to explore whether there are any differences in the health and well-being of babies and toddlers in urban and rural areas of Scotland, and in parental behaviours like breastfeeding and smoking which may have an impact on the current and future health of their children.
6
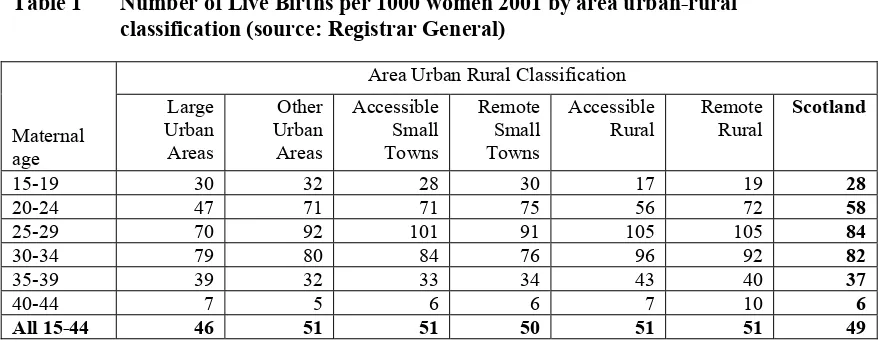
Table 1 Number of Live Births per 1000 women 2001 by area urban-rural classification (source: Registrar General)
Area
Area Urban Rural Classification
Maternal age
Large Urban Areas
Other Urban Areas
Accessible Small Towns
Remote Small Towns
Accessible
Rural Remote Rural Scotland
15-19 30 32 28 30 17 19 28
20-24 47 71 71 75 56 72 58
25-29 70 92 101 91 105 105 84
30-34 79 80 84 76 96 92 82
35-39 39 32 33 34 43 40 37
40-44 7 5 6 6 7 10 6
All 15-44 46 51 51 50 51 51 49
Structure of the report
1.9 In the remainder of this introductory section, we describe the definition of urban, rural and remote areas used in this report and note some key issues affecting our analysis. The main body of the report begins by comparing the characteristics of families with babies and toddlers across the urban-rural classification. We then examine measures of the health and well-being of babies and toddlers, including parental behaviours like smoking and breastfeeding which may impact on child health. We explore whether rural or urban children are experiencing more or less ‘child friendly’ environments by looking at the social worlds of babies, toddlers and parents. The paper ends by looking at service use, focusing particularly on childcare services.
Defining urban and rural areas
1.10 The Scottish Government uses an urban-rural classification which reflects the distinctive geography of Scotland in terms of rural and remote settlements. Under this classification, settlements of 3,000 or less people are defined as ‘rural’ while those over 10,000 are classified as ‘urban’, with settlements between 3,000 and 10,000 defined as ‘small towns’. Small town and rural settlements are classified as ‘remote’ if they are more than 30 minutes drive time from settlements of 10,000 or more people.
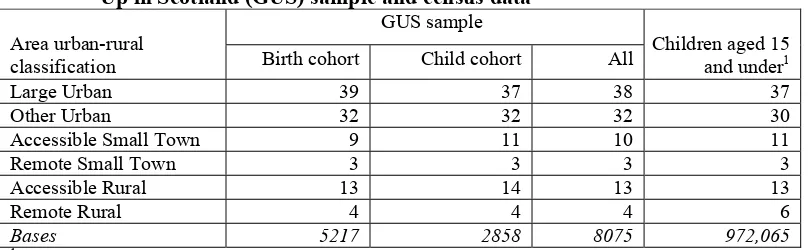
1.11 At the time of the 2001 Census, 22% of children aged 15 or under lived in rural or remote settlements and a third lived in rural or small-town settlements (Table 2).1 The proportions of babies and toddlers in the GUS sample who live in rural and remote areas are very close to these Census figures for all children (Table 2 again).
7
Table 2 Relative proportions of Scottish children across urban-rural areas: Growing Up in Scotland (GUS) sample and census data
GUS sample Area urban-rural
classification Birth cohort Child cohort All Children aged 15 and under1
Large Urban 39 37 38 37
Other Urban 32 32 32 30
Accessible Small Town 9 11 10 11
Remote Small Town 3 3 3 3
Accessible Rural 13 14 13 13
Remote Rural 4 4 4 6
Bases 5217 2858 8075 972,065
1 Source: General Register Office for Scotland (2003) (based on the 2001 Census).
Key issues in analysis of urban-rural differences
1.12 The sample for the GUS survey sample reflects the geographic dispersal of babies and toddlers across Scotland. At over 5,000 babies and just under 3,000 toddlers, it is sufficiently large that we will be able to pick up many significant differences (where they exist) between rural and remote areas. In this report, any differences between urban and rural areas reported in the text are statistically significant unless otherwise stated. However, even with a sample of 8,000 we are limited in the extent to which we can perform more complex analysis of sub-groups. For example, it is not possible to present tables comparing the experiences of lone parents in urban and rural areas due to the small numbers of lone parents in some categories (notably remote rural and small remote towns).
1.13 Another key issue is whether or not differences in the experiences of children and families in urban and rural areas actually reflect ‘area-level’ characteristics (such as quality of life, service availability, etc.), or whether in fact they are explained by differences in the types of families living in those areas. In the next section of the report, we note that there are in fact significant differences in the circumstances of urban and rural babies and toddlers in terms of the family type, parental education, parental employment and other factors.
[image:13.595.85.489.93.218.2]8
CHAPTER TWO
FAMILY CIRCUMSTANCES OF
URBAN AND RURAL BABIES AND
TODDLERS
Introduction
2.1 The overview report on the first results from the GUS study demonstrates the impact that variations in socio-demographic circumstances can have on the experiences of young children and their families. Of particular importance were:
• The age of the mother at the time the child was born. For example, younger mothers (under 20) were less likely than older mothers to have planned the pregnancy, attended ante-natal classes, breastfed or attended mother and toddler groups, while they were more likely to have higher levels of support from the child’s grandparents, and to find it difficult to know who to ask for help with parenting.
• Family structure. Lone parents were slightly more likely than those in a couple family to report that their child had a long-term health problem or disability and that the child had been admitted to hospital as an in-patient. They were also more likely to have concerns about their child’s development, learning and behaviour and to say they found it very difficult to pay for childcare.
• Parents’ education. Mothers with higher levels of educational qualifications were more likely than those with no qualifications to breastfeed (at all and at 6 months), to have more children’s books in the house and to engage in educational activities (like reading and looking at books) with the child more often.
• Parents’ (particularly mother’s) employment. Use of childcare was higher among families where one parent was working, and especially high when the mother was working.
• Family income. Children in families in the lowest income group are slightly more likely to have a long-term illness and less likely to have many children’s books in their home, while their parents are more likely to say they find it difficult to pay for childcare and that they had little or no choice over their childcare provider(s).
2.2 In this chapter, we use GUS data to compare the circumstances of children and families in urban and rural areas across a range of socio-demographic factors.
Age of mother
9
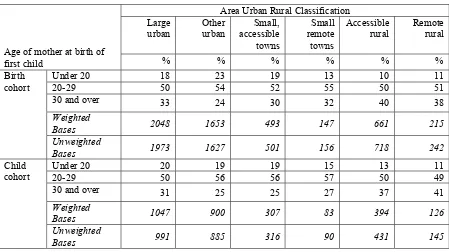
had been teenage mothers. For example, in the birth cohort, 11% of mothers in remote rural areas were teenagers when their first child was born compared with 18% of mothers in large urban areas. Moreover, a larger proportion of mothers in rural areas were aged over 30 when their first child was born – 41% in remote rural areas in the toddler cohort, compared with 31% in large urban areas.
Table 3 Age of mother at birth of first child by urban-rural
Area Urban Rural Classification Large
urban Other urban accessible Small, towns
Small remote towns
Accessible rural
Remote rural Age of mother at birth of
first child % % % % % %
Under 20 18 23 19 13 10 11
20-29 50 54 52 55 50 51
30 and over 33 24 30 32 40 38
Weighted
Bases 2048 1653 493 147 661 215
Birth cohort
Unweighted
Bases 1973 1627 501 156 718 242
Under 20 20 19 19 15 13 11
20-29 50 56 56 57 50 49
30 and over 31 25 25 27 37 41
Weighted
Bases 1047 900 307 83 394 126
Child cohort
Unweighted
Bases 991 885 316 90 431 145
2.4 Consistent with the fact that a somewhat larger proportion of rural mothers are older, fewer rural children were completely unplanned (16% of babies in remote rural areas compared with 26% in large urban areas).
First child?
[image:15.595.86.535.176.428.2]10
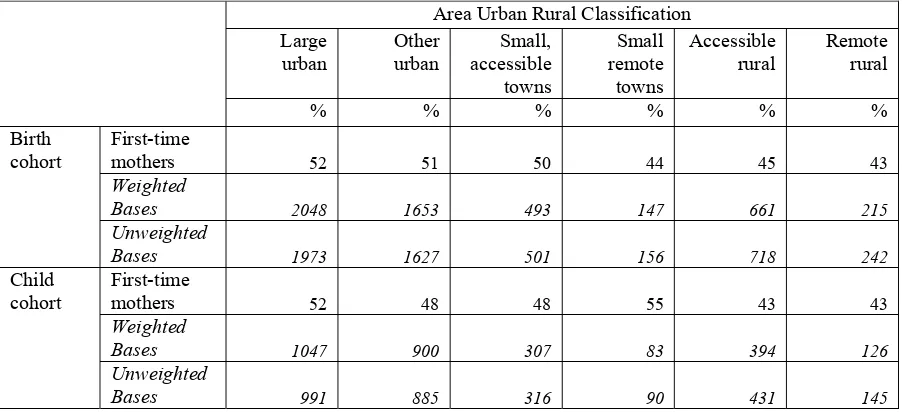
Table 4 Mothers/respondents who were first-time mothers by urban-rural
Area Urban Rural Classification Large
urban Other urban accessible Small, towns
Small remote towns
Accessible
rural Remote rural
% % % % % % First-time
mothers 52 51 50 44 45 43
Weighted
Bases 2048 1653 493 147 661 215
Birth cohort
Unweighted
Bases 1973 1627 501 156 718 242
First-time
mothers 52 48 48 55 43 43
Weighted
Bases 1047 900 307 83 394 126
Child cohort
Unweighted
Bases 991 885 316 90 431 145
Family structure
2.6 In terms of the experience of the child, one of the most significant differences between urban and rural areas is the smaller proportion of rural babies and toddlers living in a one parent household. Just 7% of babies living in accessible and remote rural areas live in lone parent households, compared with 23% in large urban and 24% in other urban areas. For toddlers, the proportion in lone parent families (28%) is also higher in small accessible towns relative to either remote (10%) or accessible rural areas (14% - Table 5), while remote small towns are intermediate between urban and rural areas. As demonstrated in the overview report, being in a lone parent household is often associated with material and other kinds of disadvantage for parents and children.
Table 5 Family structure by urban-rural
Area Urban Rural Classification Large
urban Other urban accessible Small, towns
Small remote towns
Accessible
rural Remote rural
% % % % % %
Lone parent 23 24 19 16 7 7
Couple family 77 76 81 84 93 93
Weighted base 2048 1653 493 147 661 215
Birth cohort
Unweighted base 1973 1627 501 156 718 242
Lone parent 28 26 28 21 14 10
Couple family 72 74 72 79 86 90
Weighted base 1047 900 307 83 394 126
Child cohort
Unweighted base 991 885 316 90 431 145
[image:16.595.87.536.507.719.2]11
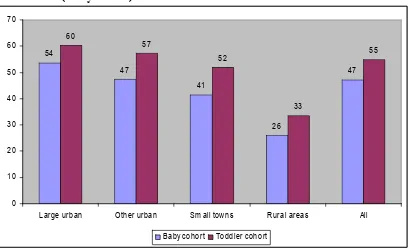
[image:17.595.94.503.207.457.2]lone parent families. However, interestingly this appears to be less true of children born to young mothers in rural compared with urban areas. Figure 1 shows that in rural areas (accessible and remote combined), just a quarter of mothers in the birth cohort who had a child when they were under 20 are now lone parents, compared with 54% in large urban areas. The pattern was broadly similar for the toddler cohort, with 60% of teenage mothers in large urban areas now lone parents, compared with 33% in rural areas.2
Figure 1 Percentage of (current/past) teenage mothers who are lone parents by urban-rural (% by cohort)
54
47
41
26
47 60
57
52
33
55
0 10 20 30 40 50 60 70
Large urban Other urban Sm all towns Rural areas All
Baby cohort Toddler cohort
Base = All mothers who had a child when they were 20 or under
Sample size – Birth cohort: Large urban = 374, Other urban = 377, Small towns (remote and accessible combined) = 111, Rural (remote and accessible combined) = 92, All = 955
Sample size – Child cohort: Large urban = 179, Other urban = 155, Small towns = 71, Rural = 62
Parents’ education
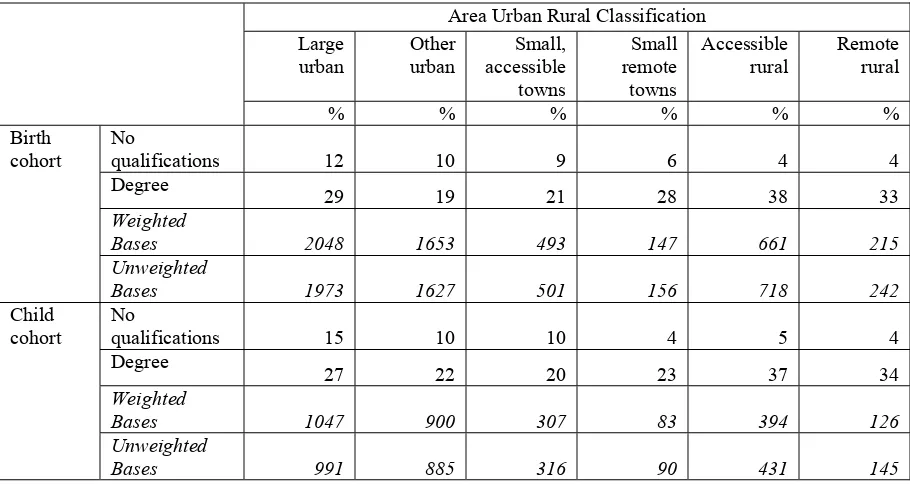
2.8 Respondents (usually the mother) in rural areas (particularly accessible rural areas) tend to be somewhat better qualified than those in urban areas (Table 6). For example, in our birth cohort 38% of mothers in accessible rural areas had degree-level qualifications, compared with 29% in large urban and just 19% in other urban areas. They are also less likely to have no qualifications at all – 15% of mothers of toddlers in large urban areas have no qualifications compared with just 4% in remote rural areas.
12
Table 6 Respondents/main carers’ educational qualifications by urban-rural
Area Urban Rural Classification Large
urban Other urban accessible Small, towns
Small remote towns
Accessible
rural Remote rural
% % % % % % No
qualifications 12 10 9 6 4 4 Degree
29 19 21 28 38 33
Weighted
Bases 2048 1653 493 147 661 215
Birth cohort
Unweighted
Bases 1973 1627 501 156 718 242
No
qualifications 15 10 10 4 5 4 Degree
27 22 20 23 37 34
Weighted
Bases 1047 900 307 83 394 126
Child cohort
Unweighted
Bases 991 885 316 90 431 145
Parents’ employment
13
Table 7 Children in households with no parent or carer working by urban-rural
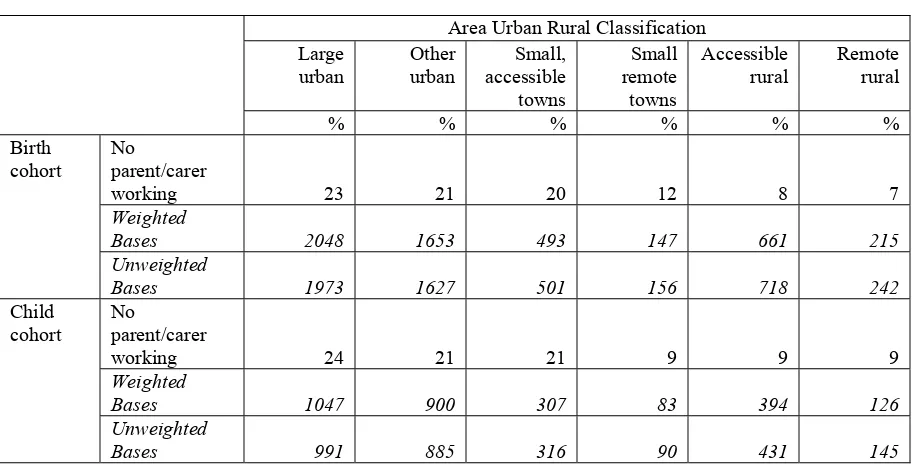
Area Urban Rural Classification Large
urban Other urban accessible Small, towns
Small remote towns
Accessible
rural Remote rural
% % % % % % No
parent/carer
working 23 21 20 12 8 7
Weighted
Bases 2048 1653 493 147 661 215
Birth cohort
Unweighted
Bases 1973 1627 501 156 718 242
No
parent/carer
working 24 21 21 9 9 9
Weighted
Bases 1047 900 307 83 394 126
Child cohort
Unweighted
Bases 991 885 316 90 431 145
14
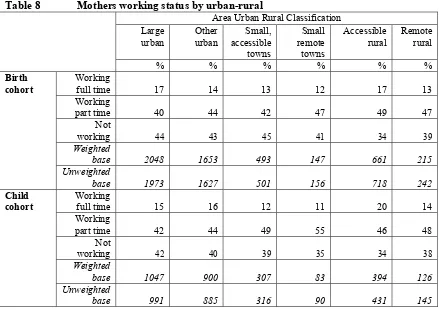
Table 8 Mothers working status by urban-rural
Area Urban Rural Classification Large
urban Other urban accessible Small, towns
Small remote towns
Accessible
rural Remote rural
% % % % % %
Working
full time 17 14 13 12 17 13
Working
part time 40 44 42 47 49 47
Not
working 44 43 45 41 34 39
Weighted
base 2048 1653 493 147 661 215
Birth cohort
Unweighted
base 1973 1627 501 156 718 242
Working
full time 15 16 12 11 20 14
Working
part time 42 44 49 55 46 48
Not
working 42 40 39 35 34 38
Weighted
base 1047 900 307 83 394 126
Child cohort
Unweighted
base 991 885 316 90 431 145
Family income and resources
15
Table 9 Children living in households in different income bands by urban-rural Area Urban Rural Classification
Large
urban Other urban accessible Small, towns
Small remote towns
Accessible
rural Remote rural
% % % % % % <£15K
34 34 32 24 17 21
£15K < £26K
21 27 25 31 27 35
£26K < £44K 24 27 28 27 32 33
£44K + 20 13 14 19 24 11
Weighted
Bases 2048 1653 493 147 661 215
Birth cohort
Unweighted
Bases 1973 1627 501 156 718 242
<£15K 35 31 36 30 19 24
£15K < £26K 20 23 26 28 23 31
£26K < £44K 22 29 24 26 30 33
£44K + 23 17 14 16 27 12
Weighted
Bases 1047 900 307 83 394 126
Child cohort
Unweighted
Bases 991 885 316 90 431 145
16
Table 10 Children living in households with particular resources by urban-rural Area Urban Rural Classification
Large
urban Other urban accessible Small, towns
Small remote towns
Accessible
rural Remote rural
% % % % % % Motor vehicle
74 76 80 82 93 93
Internet at home
54 48 56 65 70 67
Own room
60 64 65 62 70 65
Garden
83 89 94 95 98 93
Weighted
Bases 2048 1653 493 147 661 215
Birth cohort
Unweighted
Bases 1973 1627 501 156 718 242
Motor vehicle
71 77 77 82 92 93
Internet at
home 51 53 57 63 70 72
Own room 62 70 72 82 70 68
Garden
85 92 96 99 99 96
Weighted Bases
1047 900 307 83 394 126
Child cohort
Unweighted
Bases 991 885 316 90 431 145
2.13 In summary then, babies and toddlers in rural areas are:
• more likely than those in urban areas to be born to older mothers
• less likely to have been born as a result of an unplanned pregnancy
• less likely to be their mothers’ first child
• less likely to live in lone parent households
• more likely to be born to mothers with degree-level qualifications and less likely to be born to mothers with no qualifications
• less likely to live in households where neither parent/carer works
• less likely to live in low income households
• more likely to live in households with access to a car, home internet and a garden.
17
CHAPTER THREE
HEALTH AND WELL-BEING OF
RURAL BABIES AND CHILDS
Introduction
3.1 In terms of planning services to meet the health needs of children and families in Scotland, it is important to understand whether these needs vary between urban and rural areas. The first sweep of GUS included a range of questions about the child’s health, including ‘objective’ indicators (such as birth weight), more subjective measures, such as parental concerns about their child’s development, and questions about parental behaviours during pregnancy and the early years (such as breastfeeding and smoking) that may later affect children and babies. In general, there is little significant variation across the urban-rural classification in most of these measures of child health and development. Although indicators associated with parental health-influencing behaviours suggest that the chances of a healthy start are slightly lower in urban areas and slightly higher in rural areas, these differences are primarily explained by the characteristics of mothers in rural areas, who tend to be better educated, older and wealthier than their urban counterparts.
Birth weight
3.2 Low birth (defined as less than 2.5 kilos) is one of the first indicators of general health. While there are no significant differences in the proportion of babies with low birth weights between urban and rural areas generally, the proportion of GUS babies with low birth weights is slightly higher in small remote towns than in rural areas (11%, compared with 4% in remote rural areas, Table 11).
Table 11 Percentage of babies with low birth weights by urban-rural Area Urban Rural Classification
Large
urban Other urban accessible Small, towns
Small remote towns
Accessible
rural Remote rural
% % % % % % Total Birth
cohort 7 7 7 11 5 4
Weighted
base 2048 1653 493 147 661 215
Unweighted
base 1973 1627 501 156 718 242
Reported health problems or disabilities
[image:23.595.85.488.474.618.2]18
Contact with NHS for health problems
3.4 Again, there does not appear to be any clear variation between urban and rural areas in terms of contact with the NHS in general. Children in remote rural Scotland are no more or less likely to have NHS contact than children in large urban areas (82% of babies in both kinds of area have had at least one problem for which they have sought NHS attention). Similarly, young children in remote and rural areas are no more or less likely than children in urban areas to have had accidents for which their parents sought medical attention (Table 12).
3.5 Children in small remote towns, however, clearly emerge as being the least
likely to have had contact with the NHS about general health problems – for example, just 70% of babies in remote small towns have had at least one health problem which their parents contacted the NHS about, compared with 82% in both large urban and remote rural areas. In contrast, toddlers in small remote towns are most likely to have had an accident involving medical attention – 33%, compared with 18% in remote rural and 23% in large urban areas. The reasons for this are unclear – whether it is associated with availability of particular services, differences in need, or some other factor. However, these findings highlight the health services use of children in remote small towns as an area for further investigation in future years of GUS.
Table 12 Percentage who had one or more accidents involving medical attention by urban-rural
Area Urban Rural Classification Large
urban Other urban accessible Small, towns
Small remote towns
Accessible
rural Remote rural
% % % % % % Had more than 1
accident 11 11 7 11 8 7
Weighted Bases 2048 1653 493 147 661 215
Birth cohort
Unweighted
Bases 1973 1627 501 156 718 242
Had more than 1
accident 23 26 26 33 22 18
Weighted Bases 1047 900 307 83 394 126
Child cohort
Unweighted
Bases 991 885 316 90 431 145
Parental concerns about child’s development
19
Table 13 Percentage of children for whom no concerns are reported concerning their development or behaviour by urban-rural
Area Urban Rural Classification Large
urban Other urban accessible Small, towns
Small remote towns
Accessible
rural Remote rural
% % % % % % No concerns
reported 91 92 94 91 96 94
Weighted Bases
2048 1653 493 147 661 215
Birth cohort
Unweighted
Bases 1973 1627 501 156 718 242
No concerns
reported 80 81 78 84 83 90
Weighted Bases
1047 900 307 83 394 126
Child cohort
Unweighted
Bases 991 885 316 90 431 145
Health-influencing behaviour
3.7 In comparison with our other child-health measures, the health influencing parental behaviours of breast feeding and smoking do vary somewhat across the urban-rural classification. Mothers in remote and rural areas are more likely than those in urban areas to have planned to breastfeed (Table 14) and to have actually breastfed (Table 15), and are less likely to smoke (Table 16). However, regression analysis shows that these differences are due to the higher proportions of rural mothers with high levels of education, older ages at birth, the higher proportion of rural babies who are second children and the lower proportions in low income households. These factors, and not the urban-rural division in itself, largely explain these differences.
Table 14 Percentage of respondents saying they planned to breast feed before the baby was born by urban-rural
Area Urban Rural Classification Large
urban Other urban accessible Small, towns
Small remote towns
Accessible
rural Remote rural
% % % % % % Planned to
breastfeed 63 60 61 73 73 74
Weighted
Bases 2048 1653 493 147 661 215
Birth cohort
Unweighted
Bases 1973 1627 501 156 718 242
Planned to
breastfeed 59 58 60 72 73 68
Weighted
Bases 1047 900 307 83 394 126
Child cohort
Unweighted
20
Table 15 Percentage of respondents saying they ever breastfed by urban-rural Area Urban Rural Classification Large
urban Other urban accessible Small, towns
Small remote towns
Accessible
rural Remote rural
% % % % % % Ever
breastfed 60 55 58 70 71 75
Weighted
Bases 2048 1653 493 147 661 215
Birth cohort
Unweighted
Bases 1973 1627 501 156 718 242
Ever
breastfed 58 53 56 70 73 69
Weighted
Bases 1047 900 307 83 394 126
Child cohort
Unweighted Bases
991 885 316 90 431 145
Table 16 Percentage of respondents/main carers who smoke by urban-rural Area Urban Rural Classification Large
urban Other urban accessible Small, towns
Small remote towns
Accessible
rural Remote rural
% % % % % % Currently
smokes 28 32 29 21 19 17
Weighted
Bases 2048 1653 493 147 661 215
Birth cohort
Unweighted
Bases 1973 1627 501 156 718 242
Currently
smokes 32 33 34 36 24 20
Weighted
Bases 1047 900 307 83 394 126
Child cohort
Unweighted
Bases 991 885 316 90 431 145
[image:26.595.86.543.77.304.2] [image:26.595.84.538.334.541.2]21
Table 17 Percentage of babies and toddlers with few books (0-10 books) for them at home by urban-rural
Area Urban Rural Classification Large
urban Other urban accessible Small, towns
Small remote towns
Accessible
rural Remote rural
% % % % % %
0-10 books 33 30 29 21 21 21
Weighted
Bases 2048 1653 493 147 661 215
Birth cohort
Unweighted
Bases 1973 1627 501 156 718 242
0-10 books
14 9 8 2 3 4
Weighted
Bases 1047 900 307 83 394 126
Child cohort
Unweighted
Bases 991 885 316 90 431 145
3.9 There is some debate about the benefits and disadvantages in terms of child development of very young children watching television. The majority of toddlers from all areas watch TV for at least ten minutes several times a week, with very little difference by area. However, babies in remote towns and rural areas were less likely than their urban counterparts to watch any television – for example, 60% of babies in remote rural areas had not watched any TV in the last week, compared with just 45% in large urban areas (Table 18).
Table 18 Percentage of babies and toddlers who did not watch any TV in the past week by urban-rural
Area Urban Rural Classification Large
urban Other urban accessible Small, towns
Small remote towns
Accessible
rural Remote rural
% % % % % % Did not
watch TV
in last week 45 46 44 55 53 60
Weighted
Bases 2048 1653 493 147 661 215
Birth cohort
Unweighted
Bases 1973 1627 501 156 718 242
Did not watch TV
in last week 6 4 3 2 4 4
Weighted
Bases 1047 900 307 83 394 126
Child cohort
Unweighted
Bases 991 885 316 90 431 145
Conclusion
[image:27.595.87.539.82.282.2] [image:27.595.85.542.432.662.2]22
23
CHAPTER FOUR
CHILD FRIENDLY AREAS?
Introduction
4.1 Perceptions of the extent to which areas are ‘child friendly’ were explored in the 2005 Scottish Social Attitudes survey, which asked women aged 18-45 and men aged 18-49 how good or bad they thought the area they lived in was as a place to bring up children. There was a clear tendency for people in rural areas to view their area as more ‘child friendly’ in this respect – 93% of those in remote rural areas and 92% in accessible rural areas rated their area as ‘very’ or ‘quite good’, compared with just 58% in large urban and 78% in other urban areas who said the same.
4.2 There are a wide range of factors that might contribute to whether or not an area is seen as ‘child friendly’. Many of these are not easily measurable - for example, an attitude of friendliness towards children among adults in the wider locality is not something that GUS is able to measure directly, since at sweep 1 we only interview the child’s main carer. However, it is possible to use GUS data to explore whether or not children have regular access to key people (other than their main carer) who typically play an important role in contributing to well-being in children’s lives, as well as exploring the availability of informal help and support (from family, friends and neighbours) for families with small children in different types of areas.
Access to grandparents
24
Table 19 Percentage of children with at least one grandparent within a 20-30 minute drive by urban-rural
Area Urban Rural Classification Large
urban Other urban accessible Small, towns
Small remote towns
Accessible
rural Remote rural
% % % % % % Grandparent
nearby 84 88 90 88 81 74
Weighted
Bases 2048 1653 493 147 661 215
Birth cohort
Unweighted
Bases 1973 1627 501 156 718 242
Grandparent
nearby 86 88 89 89 80 69
Weighted
Bases 1047 900 307 83 394 126
Child cohort
Unweighted
Bases 991 885 316 90 431 145
4.3 Regardless of geographical distance the overwhelming majority of children in GUS were described having a close or very close relationship with at least one grandparent (Table 20), although this was slightly lower in remote rural areas (86% compared with 93% in other urban areas among the birth cohort).
Table 20 Percentage of children reported as having a close or very close relationship with at least one grandparent by urban-rural
Area Urban Rural Classification Large
urban Other urban accessible Small, towns
Small remote towns
Accessible
rural Remote rural
% % % % % %
Close relationship
with a grandparent 91 93 91 91 91 86
Weighted Bases
2048 1653 493 147 661 215
Birth cohort
Unweighted Bases 1973 1627 501 156 718 242
Close relationship
with a grandparent 94 95 94 94 96 91
Weighted Bases
1047 900 307 83 394 126
Child cohort
Unweighted Bases
991 885 316 90 431 145
4.4 A high proportion of mothers of babies in Scotland, 66% overall, sometimes use grandparents as a source of childcare. As we discuss in the next section, this is just as common in rural as urban areas, despite the larger minority of babies in remote rural areas with no grandparent living nearby.
Access to informal support and advice
[image:30.595.81.533.92.302.2] [image:30.595.84.534.400.588.2]25
few hours, for a day, or overnight, mothers in rural and remote areas were not significantly different in their pattern of answers. For example, 42% of mothers from remote rural areas would not find it easy to leave their baby with somebody over night compared with 40% from large urban areas.
4.6 These questions were followed up by asking who would be called on first if such help were needed. While kin are the first choice for the majority across all areas, friends and neighbours were more likely to be called on first in rural areas (13% in accessible and 18% in remote rural areas, compared with 9% in large urban areas – Table 21). It seems likely that these are families for whom kin are not locally available.
4.7 Other GUS data suggests that mothers in rural areas are not disadvantaged in terms of their ability to draw on their informal networks for advice. For example, and reflecting the high levels of education in rural areas, rural mothers are if anything slightly more, not less, likely than urban mothers to have friends or family with medical knowledge or training whom they could ask for advice (Table 22). This was particularly true of the toddler cohort.
Table 21 Who mothers or main carers would call on first when needing help Area Urban Rural Classification Large
urban Other urban accessible Small, towns
Small remote towns
Accessible
rural Remote rural
% % % % % %
Ex-partner 3 2 4 1 1 1
Kin 84 86 83 86 82 77
Friend/neighbour 9 9 11 12 13 18
Child minder 1 2 1 1 2 2
Other 3 1 1 1 1 2
Weighted Base 2028 1640 488 145 656 214
Birth cohort
Unweighted Base 1954 1614 496 155 713 240
Ex-partner 5 3 3 5 2 1
Kin 82 83 86 78 78 73
Friend/neighbour 9 11 7 10 16 18
Child minder 2 1 2 4 2 7
Other 3 2 2 4 2 2
Weighted Base 1033 894 307 83 390 126
Child cohort
[image:31.595.88.519.245.482.2] [image:31.595.89.516.245.483.2]26
Table 22 Percentage of respondents/main carers who has any friends or family with medical knowledge or training from whom they would feel comfortable asking for advice
Area Urban Rural Classification Large
urban Other urban accessible Small, towns
Small remote towns
Accessible
rural Remote rural
% % % % % %
Friends/family with
medical training 46 44 41 50 52 52
Weighted Bases
2048 1653 493 147 661 215
Birth cohort
Unweighted Bases
1973 1627 501 156 718 242
Friends/family with
medical training 47 45 38 42 49 58
Weighted Bases 1047 900 307 83 394 126
Child cohort
Unweighted Bases
991 885 316 90 431 145
Contact with other children
4.8 The final set of measures scrutinised in this section concerns babies and toddler’s contacts with other children. It is clear that babies and toddlers in rural and remote areas are not at all disadvantaged in this respect (Table 23). Indeed, given that 70% of toddlers in remote rural areas compared with just 60% of children in large urban areas are taken to visit friends with other young children at least weekly, children in remote areas may be more likely to have ‘child-rich’ environments (meaning environments where they have a high level of contact with other children) than babies and toddlers in urban areas.
Table 23 Frequency of toddlers being taken to visit friends with young children Area Urban Rural Classification
Large
urban Other urban accessible Small, towns
Small remote towns
Accessible
rural Remote rural
Frequency % % % % % %
At least weekly 60 64 58 66 65 70
Fortnightly 17 14 17 17 15 15
From Monthly to yearly or
less 14 13 16 9 13 8
Weighted
Bases 1047 900 307 83 394 126
Unweighted
Bases 991 885 316 90 431 145
[image:32.595.86.509.99.294.2] [image:32.595.86.502.474.656.2]27
[image:33.595.85.520.133.365.2]more such groups in rural areas because of the relative lack of more formal childcare (discussed further in Chapter Five).
Table 24 Percentage who have regularly attended a mother toddler group in the last year
Area Urban Rural Classification Large
urban Other urban accessiblSmall, e towns
Small remote towns
Accessible
rural Remote rural
% % % % % %
Attended mother and
toddler group 35 35 42 57 51 61
Weighted
Bases 2048 1653 493 147 661 215
Birth cohort
Unweighted
Bases 1973 1627 501 156 718 242
Attended mother and
toddler group 36 42 37 70 53 67
Weighted
Bases 1047 900 307 83 394 126
Child cohort
Unweighted
Bases 991 885 316 90 431 145
Conclusion
28
CHAPTER FIVE
SERVICE USE
Introduction
5.1 Analysis of service use among families with young children presented in the overview report on sweep 1 (Anderson, Bradshaw et al, 2007) showed some stark socio-demographic differences which may have implications for children’s health and wellbeing. For example, there were differences in take-up of ante-natal services by family type, household income and maternal age (Ibid., pp37-39). The report also showed differences in the sources that different parents use for information or advice about pregnancy, child health and child behaviour. For example, use of the internet for information during the pregnancy was much more common among older mothers than younger mothers (Ibid., p41). Many of these differences persist within urban and rural areas. However, in order to more fully inform the planning, targeting and marketing of services for mothers and young families, it seems important to establish whether, after controlling for differences in family circumstances by area, there are any genuine urban/rural differences in up-take of services and use of advice. Much of the more detailed analysis of service use that follows focuses on the birth cohort because of its bigger sample size.
Ante-natal classes
5.2 Ante-natal classes are an opportunity for first time mothers to get access to expert information and advice about pregnancy and birth. The percentage of first-time mothers who do not attend any ante-natal classes is highest, at 39%, in remote small towns and lowest in accessible rural areas (17% - Table 25).
Table 25 Percentage of first-time mothers in the birth cohort who did not attend any ante-natal classes by urban-rural
Area Urban Rural Classification Large
urban Other urban accessible Small, towns
Small remote towns
Accessible
rural Remote rural
% % % % % %
All first-time
mothers 31 34 18 39 17 26
Weighted Bases 1070 841 248 64 298 92 Unweighted
Bases 1012 815 248 67 312 104
29
Table 26 Reasons for non-attendance given by first-time mothers in the birth cohort who did not attend any ante-natal classes by urban-rural
Area Urban Rural Classification Large urban Other urban Small
accessible and remote towns
Accessible and remote rural
Reason for non-attendance % % % %
For ‘other reasons’ not those
listed 37 27 31 31
Nothing more needed/wanted
to know 20 20 19 17
Do not like classes/groups 19 26 23 18
Didn’t know there were any
classes/groups 11 7 7 5
Travel problems 4 4 6 14
No classes available 3 2 5 13
Any one of the three access
problems above 18 13 16 32
Weighted Bases 324 278 70 72
Unweighted Bases 288 254 69 73
5.4 The final row of Table 26 shows first-time mothers who cited at least one access problem – lack of knowledge/awareness of classes, no classes available, or travel problems - as their reason for non-attendance at ante-natal classes. Thirty-two per cent of rural mothers who did not attend ante-natal classes cited at least one of these three reasons, compared with 18% in large urban areas. Thus although rural first-time mothers were no less likely than mothers in urban areas to attend ante-natal classes overall, it is clear that access is a distinct problem for the minority of rural mothers who are not able to attend. Access problems were not significantly higher among mothers in small remote towns compared with urban areas, suggesting that the higher level of non-attendance in small remote towns is not explained by such issues.
Information and advice during pregnancy
[image:35.595.85.512.90.335.2]30
Table 27 Percentage of mothers (birth cohort, excluding first time mothers) using different sources of help, information or advice during pregnancy by SE urban rural classification
Area Urban Rural Classification Large
urban Other urban accessible Small, towns
Small remote towns
Accessible
rural Remote rural
% % % % % %
Health Professionals 92 91 94 98 93 94
Family or friends 57 57 55 60 59 57
Books, magazines or
newspapers 35 36 34 47 42 50
Ready, Steady Baby
information booklet 33 37 45 44 44 50
Other mothers 27 21 22 34 31 39
Internet 25 21 21 27 25 32
TV/Radio 8 7 9 18 9 15
Weighted Bases 979 812 245 83 363 124
Unweighted Bases 961 812 253 89 406 138
5.6 There are, however, some differences with respect to usage of other sources of advice and these are often more marked among mothers having a second or subsequent child than among first time mothers. For example, mothers in remote rural areas were the most likely to use books, magazines or newspapers, with urban-rural differences more marked among mothers who already had children than among first-time mothers. The pattern is similar with respect to use of the booklet Ready Steady Baby. In remote rural areas usage of this booklet drops from 60% among first time mothers to 50% of other mothers but in large urban areas it drops from 51% to 33%. This may suggest that urban mothers are less likely than rural mothers to continue consulting such sources after their first child.
Childcare
[image:36.595.85.505.81.301.2]31
Table 28 Percentage of respondents/main carers who get help with childcare on a regular basis from any of a list of the main formal and informal sources of help
Area Urban Rural Classification Large
urban Other urban accessible Small, towns
Small remote towns
Accessible
rural Remote rural
% % % % % %
Respondents
using childcare 61 61 61 43 57 48
Weighted
Bases 2048 1653 493 147 661 215
Birth cohort
Unweighted
Bases 1973 1627 501 156 718 242
Respondents
using childcare 75 75 74 81 81 73
Weighted
Bases 1047 900 307 83 394 126
Child cohort
Unweighted
Bases 991 885 316 90 431 145
5.8 Among those families who do not use childcare for their baby on a regular basis, lack of access to services is not the main issue for many families in Scotland – rather, preferring to look after their baby themselves or not needing to be away from them are the main reasons cited. The pattern of answers is broadly similar across urban-rural areas (Table 29). However, in remote small towns a higher proportion of mothers say ‘I’d rather look after him/her myself’ (84%, compared with 66% in large urban areas and 67% in remote rural areas).
Table 29 Percentage of mothers/main carers, birth cohort, who do not get help with childcare on a regular basis giving various reasons for not using childcare
Area Urban Rural Classification Large
urban Other urban accessible Small, towns
Small remote towns
Accessible
rural Remote rural Reason for not using
childcare % % % % % %
I would rather look after
him/her myself 66 64 66 84 70 67
I rarely need to be away
from her/him 41 51 54 46 48 56
I cannot afford childcare 17 18 14 5 13 17
No providers I trust or concerns re. quality or
past bad experience 3 3 2 6 3 6
Transport difficulties 2 2 5 2 4
Child needs special care 1 1 3 1 1 1
Other reasons 8 7 6 9 6 7
Weighted Bases 790 644 191 83 287 112
Unweighted Bases 751 626 193 88 311 125
[image:37.595.85.505.76.315.2] [image:37.595.85.511.447.677.2]32
while those in large urban areas were the most likely to use nursery or crèche provision (35%, compared with 20% in remote rural areas and just 10% in small remote towns – Table 30).
Table 30 Percentage of families in the birth cohort who are using childcare, who currently use various types of childcare
Area Urban Rural Classification Large
urban Other urban accessible Small, towns
Small remote towns
Accessible
rural Remote rural Type of
childcare % % % % % %
Grandparents 63 67 72 64 66 67
Other informal
carers 19 19 22 36 18 20
Nursery or
crèche 35 24 17 10 25 20
Childminder 7 12 13 16 16 16
Playgroup 2 2 2 1 1 4
Weighted bases 1258 1009 302 63 374 104
Unweighted
bases 1221 1001 308 68 407 117
5.10 Among the child cohort, those in remote rural areas and remote small towns were significantly more like to use playgroups - 39% of parents from remote rural areas and 34% from remote small towns make use of this provision, compared with 12% in large urban areas (Table 31). Those in remote areas were also more likely to use childminders but again were less likely to use nurseries or crèches. These differences reflect established variations in provision by area – rural areas tend to have more playgroups and childminders and fewer nurseries because of financial difficulties in sustaining nurseries in sparsely populated areas.
Table 31 Percentage of families in the child cohort who are using childcare who currently use various types of childcare
Area Urban Rural Classification Large
urban Other urban accessible Small, towns
Small remote towns
Accessible
rural Remote rural
Type of childcare % % % % % %
Grandparents 49 51 58 49 46 39
Other informal carers 17 17 15 13 12 12
Nursery or crèche 50 42 30 25 49 23
Childminder 6 9 16 22 12 25
Playgroup 12 19 25 34 26 39
Weighted bases 787 670 228 68 319 92 Unweighted bases 751 664 235 73 349 105
[image:38.595.84.469.126.338.2] [image:38.595.85.512.483.646.2]33
also particularly likely to say they use childcare so the child can take part in a leisure activity, which may support the suggestion that mothers in remote locations are more likely to make particular efforts to ensure that their children have particular sorts of experiences.
Table 32 Percentage of mothers/carers citing child-centred reasons for use of childcare (mothers who use childcare)
Area Urban Rural Classification
Large
urban Other urban
Small, accessible towns
Small remote
towns Accessible rural Remote rural Reason for use of
childcare % % % % % %
For child’s educational
development 35 36 35 46 43 50
Because child likes
spending time there 32 40 43 33 36 43
So that child can take
part in a leisure activity 15 17 17 27 19 30
Weighted bases 787 670 228 68 319 92
Unweighted bases 751 664 235 73 349 105
Awareness of government initiatives