This topic report examines the prevalence of hyperactivity disorders in 5
to 19 year olds in England in 2017 and the characteristics of children and
young people with a hyperactivity disorder. The Development and
Well-Being Assessment (DAWBA) tool was used to assess for a range of
hyperactivity disorders.
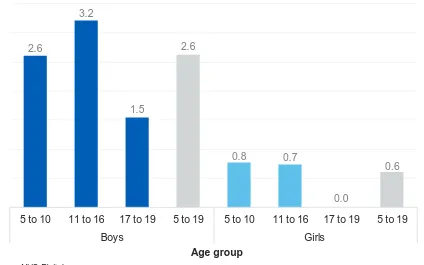
About one in sixty (1.6%) 5 to 19 year olds had a hyperactivity disorder.
Rates were higher in boys (2.6%) than girls (0.6%).
2.6
3.2
1.5
2.6
0.8 0.7
0.0
0.6
5 to 10 11 to 16 17 to 19 5 to 19 5 to 10 11 to 16 17 to 19 5 to 19
Boys Girls
Per cent
Any hyperactivity disorder by age and sex, 2017
Base: 5 to 19 year olds
Age group
Source: NHS Digital
Authors: Nick Forbes, Nicola Pearce, Tim Vizard, Katharine Sadler, Tamsin Ford, Anna Goodman, Robert Goodman, Sally McManus
Responsible Statistician: Dan Collinson, Community and Mental Health Published: 22 November 2018
Copyright © 2018 Health and Social Care Information Centre.
Mental Health of Children and Young
People in England, 2017
Main findings
Prevalence of hyperactivity disorders
•
About one in sixty (1.6%) of 5 to 19 year olds had a hyperactivity disorder. Rates were higher in boys (2.6%) than girls (0.6%). Rates of hyperactivity disorders were lower in children aged 17 to 19 (0.8%) compared to children aged 11 to 16 (2.0%)Characteristics of children with hyperactivity disorders
• Demographics: The prevalence of hyperactivity disorders varied between ethnic groups, with rates highest in White British children (2.1%)
• Health:Children whose general health was rated as fair, bad or very bad had higher rates of hyperactivity disorders (2.9%) as did children with a
recognised special educational need (11.9%). However in both instances, the hyperactivity disorder may have been the special educational need or an aspect of the child’s general health
• Family: Rates of hyperactivity disorders were higher in children in households with less healthy family functioning (3.4%) and in children of parents with poor mental health (3.2%)
Contents
Main findings 2
Acknowledgements 5
Introduction 6
Background 7
Terminology 8
Prevalence of hyperactivity disorders 9
Hyperactivity disorders by age and sex 9
Children and young people with a hyperactivity disorder 10
Hyperactivity disorders by ethnic group 10
Hyperactivity disorders by special educational needs 11
Hyperactivity disorders by child’s general health 12
Hyperactivity disorders by parent’s mental health 13
Hyperactivity disorders by family functioning 14
Hyperactivity disorders by household income 15
Hyperactivity disorders by benefits 15
Hyperactivity disorders by neighbourhood deprivation 16
Hyperactivity disorders by region 16
Trends in hyperactivity disorders in 5 to 15 year olds, 1999-2017 16
Discussion 17
Methods 19
Definitions 21
This is an Official Statistics publication
This document is published by NHS Digital, part of the Government Statistical Service.
All official statistics should comply with the UK Statistics Authority’s Code of Practice for Official Statistics which promotes the production and dissemination of official statistics that inform decision making.
Find out more about the Code of Practice for Official Statistics at https://www.statisticsauthority.gov.uk/code-of-practice/
Acknowledgements
First of all, we thank all the children, young people, parents and teachers who so generously gave their time to participate in this survey.
Running a national survey relies on the expertise of many people. We thank the professional and committed interviewers, operations department, computing, statistical, and survey and data management staff based at the National Centre for Social Research (NatCen) and the Office for National Statistics (ONS).
In NatCen, we would like to thank Franziska Marcheselli, Dhriti Mandalia, Si Ning Yeoh, Laura Brown, Nikki Leftly, Helen Henderson, Emma Fenn, Susan Corbett, Matt Jonas, Sally Bridges, Rachel Craig, Richard Boreham and Gillian Prior.
In ONS, this survey would not have taken place without the work of Ellie Brodie, Jodie Davis, Charlotte Guinee, Steve Maurice, Simon Robinson, Mark Rowland, Adam White, Alexandra Pop, Salah Merad and Dean Fletcher.
We are also indebted to the team of ONS and NatCen interviewers who spent countless hours interviewing participants who took part in this survey.
Clinical raters undertook the enormous task of reviewing information on all the children and young people who took part. From the University of Exeter College of Medicine and Health these included Carmen Apostu, Pamela Bowman, Tamsin Newlove-Delgado, Oana Mitrofan and Eva Wooding. From Kings College London: Sophie Epstein, Andrew McWilliams, Helena Hamilton, Christine Kuhn. Thanks to Bruce Clark and the Body Dysmorphic Disorder team from South London and Maudsley Hospital for independently rating BDD diagnoses.
The survey benefited from an expert steering group, we would like to thank Miranda Wolpert, Peter Fonagy, Catherine Newsome, Lucy Heyes, Helen Duncan, Jessica Sharp, David Lockwood, Jeremy Clark, Alexandra Lazaro, and Nilum Patel.
NHS Digital commissioned the survey series with funding from the Department of Health and Social Care. We are particularly grateful to Dan Collinson, Alison Neave, Steven Webster, Jane Town, Ben Osborne and Kate Croft for their thoughtful
Introduction
Major surveys of the mental health of children and young people in England were carried out in 1999 (Meltzer et al., 2000), 2004 (Green et al., 2005), and 2017. The latest survey was funded by the Department of Health and Social Care,
commissioned by NHS Digital, and carried out by the National Centre for Social Research, the Office for National Statistics and Youthinmind.
In each of the three surveys, the Development and Well-Being Assessment (DAWBA) was administered to a stratified probability sample of children and young people and their parents and teachers (Goodman et al., 2000). Cases were reviewed by clinically-trained raters. While many surveys use brief tools to screen for nonspecific psychiatric distress or dissatisfaction, this series applied rigorous, detailed and consistent
methods to assess for a range of different types of disorder according to International Classification of Disease (ICD-10) diagnostic criteria (WHO, 1992). Comparable data is available for 5 to 15 year olds living in England in 1999, 2004, and 2017. In keeping with broadening definitions of adolescence (Sawyer et al., 2018) the 2017 sample was the first in the series to include 17 to 19 year olds. Children aged 2 to 4 were also included in the sample, offering a rare insight into the prevalence of mental disorders in preschool aged children.
This topic report examines the:
• Prevalence of hyperactivity disorders in 5 to 19 year olds, by age and sex • Health, social, and economic characteristics of children and young people with a
hyperactivity disorder, compared to those without
Information on the prevalence of hyperactivity disorders for the preschool population (2 to 4 year olds) can be found in the Preschool Children topic report.
As well as a Summary Report, a series of other topic reports are available focusing on:
• Trends and characteristics • Emotional disorders
• Behavioural disorders
• Autism spectrum, eating and other less common disorders • Predictors of mental disorders (to be released at a later date) • Multiple conditions and wellbeing
• Professional services, informal support and education • Behaviours, lifestyles and identities
• Preschool children
Further information about the survey methods and can be found in the Methods and Definitions sections at the end of this report, as well as in the Survey Design and Methods Report. All reports are available at:
Background
Hyperactivity disorders start in childhood and are characterised by developmentally inappropriate patterns of inattention, impulsivity, and hyperactivity. Children with hyperactivity disorders may find it hard to sit still, may act without thinking first, and tend to start but not finish things. While most children behave like this sometimes, for those with hyperactivity disorders these symptoms are marked, persistent and cause problems in more than one setting, such as school, home or social situations.
Hyperactivity disorders can affect children and young people throughout their lives, disrupting relationships and making everyday life difficult (NICE, 2018). In addition, hyperactivity disorders in adulthood have been linked to being economically inactive, having no qualifications, and having a substance abuse disorder (Jotangia & Brugha, 2009).
Children who have a hyperactivity disorder are at greater risk of developing
dysfunctional personality traits such as delinquency and antisocial behaviour (Taylor et al., 2004). In addition, the inattentive and restless behaviour associated with hyperactivity disorders persists into adolescence and adult life. Analysis of follow-up studies of children diagnosed with attention deficit hyperactivity disorder (ADHD) has indicated that about 15% of children diagnosed with ADHD retained the diagnosis at age 25. A further 50% of children with ADHD were in partial remission by age 25, meaning they still experienced some impairing symptoms (Faraone et al., 2006). More recent follow-up studies of children with ADHD attending child mental health services found higher persistence rates into adulthood (van Lieshout et al., 2016).
This topic report splits hyperactivity disorders into two categories:
• Hyperkinetic disorder - Symptoms of inattention, hyperactivity and impulsivity are present and lead to impairment in several settings such as school or work, home life and leisure activities. Symptoms are evident by seven years old, and can be identified retrospectively
Hyperactivity and Attention Deficit Hyperactivity Disorder
(ADHD)
Hyperactivity disorders can be identified by two official sets of diagnostic criteria: the International Classification of Diseases 10th Revision (ICD-10) (WHO, 1992) and the Diagnostic and Statistical Manual of Mental Disorders fifth edition (DSM-5) (APA, 2013). The results in this survey are based on the ICD-10 classification of
hyperactivity disorders. ICD-10 is the official classification system in the UK, and has been used in the 1999 and 2004 surveys of the mental health of children and young people in England.
The ICD-10 classification of hyperkinetic disorder is similar to the DSM-5 classification of ADHD. Both classification systems require symptoms to present themselves in several settings such as school or work, home life and leisure activities (NICE, 2018). However, the ICD-10 criteria for hyperkinetic disorder tends to be more restrictive than the DSM-5 criteria for ADHD in identification of hyperactivity disorders (Lahey et al., 2006). For example, an ADHD diagnosis requires symptoms to be present by twelve years of age while symptoms of hyperkinetic disorder must be present by the age of seven. As a result, the rates of hyperactivity disorders presented in this report (based on ICD-10 criteria for hyperkinetic disorder) are likely to be lower compared to other surveys which utilise DSM-5 criteria (ADHD).
Terminology
In this report, the words ‘children’, ‘boys’ and ‘girls’ are used, even when 17 to 19 year olds are included in the group. This is to avoid the text becoming cumbersome.
Prevalence of hyperactivity disorders
Hyperactivity disorders by age and sex
About one in sixty (1.6%) of 5 to 19 year olds were identified as having a hyperactivity disorder. This is an estimate based on a sample. If all children in the population had participated, it is likely that the proportion identified with a hyperactivity disorder would have been between 1.4% and 1.9%. This range is referred to as the 95% confidence interval (CI). If the sample had been drawn twenty times, for nineteen of those we would expect the estimate to be in this range1.
Hyperactivity disorders were more common in boys (2.6%) than girls (0.6%)2. Rates of hyperactivity disorders were lower in children aged 17 to 19 (0.8%) compared to children aged 11 to 16 (2.0%). (Figure 1; Table 1)
The majority of children with a hyperactivity disorder met the criteria for hyperkinetic disorder (1.4%), with 0.3% identified with other types of hyperactivity disorder3.
1 See the Methods section of this report and the Survey Design and Methods Report for further
confidence interval information for the estimates presented in this report.
2 These are estimates based on a sample, it is likely that the proportion of children with a hyperactivity
disorder would have been between 2.1% and 3.1% for boys and between 0.4% and 0.8% for girls.
3 The proportion of children with a hyperkinetic disorder and other hyperactivity disorders do not sum to
the proportion of children with a hyperactivity disorder due to rounding.
2.6
3.2
1.5
2.6
0.8 0.7
0.0
0.6
5 to 10 11 to 16 17 to 19 5 to 19 5 to 10 11 to 16 17 to 19 5 to 19
Boys Girls
[image:9.595.86.510.352.617.2]Per cent
Figure 1: Any hyperactivity disorder by age and sex, 2017
Base: 5 to 19 year olds
Age group
Children aged 5 to 10 years and 11 to 16 years had similar levels of hyperkinetic disorder (1.6% and 1.7% respectively) while children aged between 17 and 19 had the lowest rate (0.4%).
Children and young people with a hyperactivity
disorder
Hyperactivity disorders by ethnic group
There was an association between ethnic group and the presence of a hyperactivity disorder in children. Hyperactivity disorders were most common in children who identified as White British (2.1%). (Figure 2; Table 2)
Footnotes
Due to the small sample sizes for children of black and minority ethnic backgrounds, this survey cannot confidently detect low prevalence rates. No children from Black / Black British ethnic backgrounds were assessed as having a hyperactivity disorder in this survey, and as a result are not presented in this chart.
2.1
0.4
0.3
1.1
White British White Other Asian / Asian British Mixed / Other
Per cent
[image:10.595.82.496.325.595.2]Ethnic group
Figure 2: Any hyperactivity disorder by ethnic group, 2017
Base: 5 to 19 year olds
Hyperactivity disorders by special educational needs
Children with recognised special educational needs were more likely to have a
hyperactivity disorder (11.9%) than those without (0.8%). The survey did not establish whether the special educational needs that were recognised related directly to the disorder itself, but it is likely that this would sometimes have been the case. The kinds of disorders that can make it harder to cope in a school environment, like hyperactivity disorders, may be particularly likely to be recognised as special educational needs. (Figure 3; Table 3)
11.9
0.8
Present Not present
Per cent
[image:11.595.91.504.320.524.2]Special educational needs
Figure 3: Any hyperactivity disorder by special educational needs, 2017
Base: 5 to 19 year olds
Hyperactivity disorders by child’s general health
There was an association between children’s general health and the presence of a hyperactivity disorder. Figure 4 shows that hyperactivity disorders were least
prevalent among children whose general health was rated as very good (1.0%) and most prevalent among children whose general health was rated as fair, bad or very bad (2.9%). (Figure 4; Table 4)
It should be noted that when children, young people and their parents assessed general health they are likely to have considered both the child’s mental health and their physical health.
1.0
2.5
2.9
Very good Good Fair/Bad/Very bad
Per cent
[image:12.595.85.507.260.510.2]General health
Figure 4: Any hyperactivity disorder by child's general health, 2017
Base: 5 to 19 year olds
Hyperactivity disorders by parent’s mental health
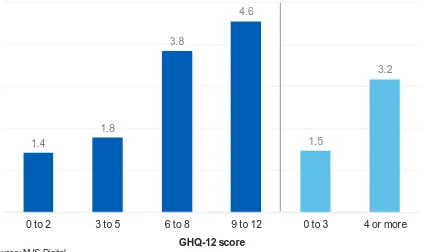
There was an association between the mental health of a parent (indicated by the 12-item General Health Questionnaire (GHQ) score) and the prevalence of a
hyperactivity disorder in children. Children of parents whose score indicated that they may have a common mental disorder (GHQ-12 score of 4 or more) had a
hyperactivity disorder rate of 3.2%. In comparison, the rate was 1.5% among children whose parents were not considered to have a common mental disorder (GHQ score of 3 or less). (Figure 5; Table 5)
As a cross-sectional survey, these associations cannot explain causality. While the presence of a mental disorder in parents may contribute to the development of hyperactivity disorders in children, the presence of hyperactivity disorders in children may affect the mental health of parents.
1.4
1.8
3.8
4.6
1.5
3.2
0 to 2 3 to 5 6 to 8 9 to 12 0 to 3 4 or more
Per cent
[image:13.595.86.508.300.552.2]GHQ-12 score
Figure 5: Any hyperactivity disorder by parent's mental health, 2017
Base: 5 to 19 year olds
Hyperactivity disorders by family functioning
There was an association between family functioning and prevalence of a
hyperactivity disorder in children. Children whose family functioning was defined as unhealthy (a score of 2.01 or more) had a hyperactivity disorder rate of 3.4%. In comparison, the rate was 1.4% among children whose family functioning was considered healthy (a score of 2.00 and less). (Figure 6; Table 6)
As a cross-sectional survey, these associations cannot explain causality. While problems with family functioning may contribute to the onset of hyperactivity
disorders, the presence of hyperactivity disorders could also lead to problems with family functioning.
1.1
1.6
3.1
6.2
1.4
3.4
Up to 1.50 1.51 to 2.00 2.01 to 2.50 2.51 or more Up to 2.00 2.01 or more
Per cent
[image:14.595.85.504.265.521.2]Family functioning score
Figure 6: Any hyperactivity disorder by family functioning score, 2017
Base: 5 to 19 year olds
Hyperactivity disorders by household income
Household income was not associated with the prevalence of hyperactivity disorders. (Table 7)
Hyperactivity disorders by benefits
Children who were living with a parent in receipt of disability benefits were more likely to have a hyperactivity disorder (5.8%) than children whose parents were not
receiving disability benefits (1.2%). A smaller difference was found between children living with parents in receipt of low income benefits (2.6% with a hyperactivity
disorder) and children whose parents were not receiving low income benefits (1.4% with a hyperactivity disorder). (Figure 7; Table 8)
2.6
1.4
5.8
1.2
Received Not received Received Not received
Per cent
[image:15.595.85.509.358.594.2]Parental receipt of benefits
Figure 7: Any hyperactivity disorder by parental receipt of low-income benefits or disability-related benefits, 2017
Base: 5 to 19 year olds
Source: NHS Digital
Hyperactivity disorders by neighbourhood deprivation
There was no association between neighbourhood deprivation (as measured using Index of Multiple Deprivation scores presented by quintiles) and prevalence of
hyperactivity disorders among children. The rate of hyperactivity disorders was similar in the least deprived and most deprived areas. (Table 9)
Hyperactivity disorders by region
There was no association between region and prevalence of a hyperactivity disorder among children. (Table 10)
Trends in hyperactivity disorders in 5 to 15 year olds,
1999-2017
The prevalence of hyperactivity disorders has remained stable over time, at 1.5% in 1999 and 2004, and 1.9% in 2017. This stability has been evident both in boys and girls, and in those aged 5 to 10 and those aged 11 to 15.
Discussion
Hyperactivity disorders, whether defined as hyperkinetic disorder (ICD-10) or ADHD (DSM)4, can affect children and young people throughout their lives, disrupting relationships and making everyday life difficult (NICE, 2018). Research has shown that children with hyperactivity disorders have lower academic attainment (Loe & Feldman, 2007) as well as more disciplinary problems in school (Sikirica et al., 2015). Because of this, it is important to accurately estimate the proportion of children
affected by hyperactivity disorders and their characteristics to plan and design mental health services for children and young people.
This survey showed that rates of hyperactivity disorders were lower in children aged 17 to 19 compared to children aged 11 to 16. This lower prevalence rate may occur because once young people leave compulsory education, they may no longer display hyperactivity symptoms in more than one setting and so do not meet the criteria for a diagnosis.
This survey also highlighted a higher prevalence of hyperactivity disorders in boys than in girls. This is consistent with much of the research on hyperactivity disorders which has found that these disorders are more prevalent among males than females (Skounti et al., 2007). Some research suggests this difference is because symptoms of hyperactivity disorders are expressed differently in girls than boys, making
symptoms harder to identify in girls (Ohan & Johnston, 2005).
Parental receipt of welfare benefits was associated with the presence of hyperactivity disorders in this study while other measures of socioeconomic status such as
household income and neighbourhood deprivation were not. However, other research has found associations between socioeconomic disadvantage and hyperactivity
disorders in children (Russell et al., 2016).
This survey demonstrated that children in families with less healthy family functioning had higher rates of hyperactivity disorder than children in families with healthy family functioning. Children with hyperactivity disorders have been shown to be more likely to come from families with higher levels of dysfunction (Scahill et al., 1999) and family conflict (Biederman et al., 2001). While problems with family functioning may
contribute to the onset of hyperactivity disorders in children, the presence of a hyperactivity disorder could also lead to problems with family functioning. Research has found that parents often wait several years to seek a hyperactivity diagnosis for children during which time they do not have access to support networks which also places additional stress on the family (Ford et al., 2008).
The importance of inter-parental relationships as a protective factor for children’s and young people’s mental health (particularly for those experiencing socioeconomic disadvantage such as living in poverty) is highlighted in the Transforming Children and Young People’s Mental Health Provision Green Paper (DoH/DfE, 2017). This
4 The term “hyperactivity disorder” in this section includes research on ADHD (based on DSM) and
paper also discusses the role local troubled families teams play in providing parenting support and improving family functioning to support improved mental health of
children and young people.
Finally, the inattentive and restless behaviour associated with hyperactivity disorders persists into adolescence (in about 80% of cases), and sometimes adult life (Faraone et al., 2003). Hyperactivity disorders in adulthood have been linked to being
economically inactive, being single, having no qualifications, and having a substance abuse disorder (Jotangia & Brugha, 2009). This highlights the importance of
Methods
The Mental Health of Children and Young People (MHCYP) survey was conducted with 5 to 15 year olds living in Britain in 1999 and 5 to 16 year olds living in Britain in 2004. The 1999 and 2004 surveys sampled from Child Benefit records. For the 2017 survey a stratified multistage random probability sample of 18,029 children was drawn from NHS Patient Register in October 2016. Children and young people were eligible to take part if they were aged 2 to 19, lived in England, and were registered with a GP. Children, young people and their parents were interviewed face-to-face at home using a combination of Computer Assisted Personal Interview (CAPI) and Computer Assisted Self Interview (CASI), between January and October 2017. A short paper or online questionnaire was completed by a nominated teacher for children aged 5 to 16 years old. Data collection varied with the selected child’s age:
• 2 to 4 year olds: parent interview
• 5 to 10 year olds: parent interview and teacher interview
• 11 to 16 year olds: parent interview, child interview and teacher interview
• 17 to 19 year olds: young person interview and parent interview (if parent present at the same address)
Furthermore, prevalence estimates for 5 to 16 year olds were adjusted slightly upwards with a factor designed to take account of the fact that only some of this age group had data from teachers. See the Survey Design and Methods Report for detail about the calculation and application of adjustment factors.
Productive interviews (involving one or more participants in each household) were achieved for 9,117 children (1,463 2 to 4 year olds; 3,597 5 to 10 year olds; 3,121 11 to 16 year olds; 936 17 to 19 year olds), and 3,595 teachers (54% of eligible children). The survey included the detailed and comprehensive Development and Well-Being Assessment (DAWBA). This allowed the assessment of emotional, hyperactivity, behavioural and less common disorders, like autism. After interviews were complete, eleven trained clinical raters reviewed the data to reach disorder codings for each participant. Raters applied the diagnostic criteria for specific disorders set out in the tenth International Classification of Disease (ICD-10) (WHO, 1992) and the Diagnostic and Statistical Manual of Mental Disorders (DSM–5) (APA, 2013).
The 2017 survey was designed to be comparable with the 1999 and 2004 surveys. This included the continued use of the DAWBA, use of ICD-10, and consistent timing of data collection. However, some differences in design have taken place which may affect comparability with previous survey results, including that the 2017 survey:
• Sampled from the NHS Patient Register, whereas the 2004 and 1999 surveys sampled from Child Benefit records
• Included 2 to 4 and 17 to 19 year olds for the first time
• Covered England, while previous surveys in the series covered Britain. Analyses of 1999 and 2004 data presented in this report have been run on participants aged 5 to 15 years old living in England only to maintain comparability in trends
The 2017 interviews and analyses are based on participants’ age at 31 August 2017, with participants grouped with their peers in terms of school year.
Confidence intervals
Information about confidence intervals are presented in the text and described as the range for which a value is likely to fall within had the whole population participated in this survey rather than a sample. This range was calculated based on 95%
confidence interval and indicates the range we would expect estimates to fall within nineteen times in twenty, if the study was repeated with new samples.
Definitions
Mental disorder
Mental disorders were identified on the survey according to the standardised diagnostic criteria in the tenth edition of the International Classification of Diseases (ICD-10). Specific mental disorders were grouped into four broad categories:
emotional, behavioural, hyperactivity and other less common disorders. While some of the symptoms covered in this report may be present in many children, to count as a disorder they had to be sufficiently severe to cause distress to the child or impair their functioning (WHO, 1993).
Figure 8: Disorders included and excluded in trend measures Any mental disorder
Disorder categories
Emotional disorders Hyperactivity
disorders Behavioural (or ‘conduct’) disorders Other less common disorders Disorder subgroups
Anxiety disorders Depressive disorders Bipolar affective disorder Specific disorders (included in trend measures) Separation anxiety disorder Generalised anxiety disorder Obsessive compulsive disorder Specific phobia Social phobia Agoraphobia Panic disorder Post-traumatic stress disorder Other anxiety Major depressive episode Other depressive episode Hyperkinetic disorder Other hyperactivity disorder Oppositional defiant disorder Conduct disorder confined to family Unsocialised conduct disorder Socialised conduct disorder Other conduct disorder Autism spectrum disorder Eating disorder Tics Selective mutism Psychosis Specific disorders (added since 1999, so excluded from trend measures) Body dysmorphic disorder
(added in 2017) 1
Bipolar affective disorder Mania (Both added in 2004) Attachment disorder (added in 2004) Feeding disorder Sleep disorder Eliminating disorder (all added in 2017)
1 Body dysmorphic disorder was assessed using the Diagnostic and Statistical Manual of
[image:21.595.60.537.258.749.2]Trends and 2017 measures
Trends over time are based on samples, methods, and disorders that are as
comparable as possible. The 1999 and 2004 samples have been reanalysed based on participants resident in England only, and the 2004 and 2017 samples are restricted to those aged 5 to 15 for these analyses. For each survey only those
interviewed in English are retained. Some disorders (such as attachment disorder and body dysmorphic disorder) were only included after the 1999 survey had been
completed. To ensure estimates are comparable across surveys these additional disorders were not included in the 2017 trend measures. See the Survey Design and Methods Report for details.
Hyperactivity disorders
These are characterised by developmentally inappropriate patterns of inattention, impulsivity, and hyperactivity.
Hyperkinetic disorder
In hyperkinetic disorder, children have levels of inattention, hyperactivity and
impulsivity lead to impairment in several settings such as school/work, home life and leisure activities. Symptoms are evident by age seven years, and can be identified retrospectively.
Other hyperactivity disorders
Analysis variables
Ethnic group
Ethnic group was self-reported directly by children and young people aged 11 or more, and by parents for children aged 10 or under.
Special educational needs
Presence of special educational needs was based on information provided by the interviewed parent for children aged 2 to 16 and for young people aged 17 to 19.
Child’s general health
Young people aged 17 and over rated their own general health. For children aged 16 and under, the interviewed parent rated their child's general health.
Parental mental health
The mental health of the interviewed parent or guardian (usually the mother), was assessed using the GHQ-12. Scores range from 0 (no psychological distress) to 12 (severe psychological distress). A score of 4 or more is generally c onsidered
indicative of the presence of a common mental disorder.
Family functioning
Family functioning was measured using the General Functioning Scale of the
McMaster Family Activity Device (FAD). It comprises 12 statements that parents rate on a four point scale. A score was derived. A score above 2 was considered to indicate ‘unhealthy’ family functioning.
Equivalised household income
An estimate of overall household income was established by means of a showcard, and was adjusted to reflect the number and ages of people living in the household. For further details please refer to the Survey Design and Methods Report.
Welfare benefits
A household was classified as in receipt of 'low income benefits' if any resident adult with parental responsibility for the child reported being in receipt of any of the
following: Housing Benefit, Working Tax Credit, Income Support, Universal Credit (UC), Job Seekers' Allowance, or Pension Credit. Child Tax Credit did not count as the eligible income threshold for this is higher. While UC could be received for disability-related reasons this was not distinguishable in the data collected.
A household was classified as in receipt of 'disability-related benefits' if an adult with parental responsibility for the sample child received any of: Disability Living
Allowance, Carer's Allowance, Employment and Support Allowance, Personal
Allowance, Incapacity Benefit, Armed Forces Compensation Scheme, or Attendance Allowance.
Neighbourhood deprivation
The Index of Multiple Deprivation (IMD) 2015 combines a number of indicators, chosen to cover a range of economic, social and housing issues, into a single deprivation score for each small area (or as described here neighbourhoods) in
England. This allows each neighbourhood to be ranked relative to others according to their level of deprivation. In this report quintiles of IMD are used to give an area-level measure of socioeconomic status, as opposed to a household-level measure. For further details about IMD please refer to the Survey Design and Methods Report.
Region
References
American Psychiatric Association. (2013). Diagnostic and statistical manual of mental
disorders (5th ed.). Arlington: American Psychiatric Publishing
Biederman, J., Mick, E., Faraone, S., et al. (2001). Patterns of remission and symptom decline in conduct disorder: A four-year prospective study of an ADHD sample. Journal of the American Academy of Child & Adolescent Psychiatry, 40(3), pp. 290-298
Department of Health, Department for Education (DoH, DfE). (2017). Transforming
Children and Young People’s Mental Health Provision: A Green Paper. Crown
copyright
Faraone, S., Sergeant, J., Gillberg, C., et al. (2003). The worldwide prevalence of ADHD: is it an American condition? World Psychiatry, 2(2), pp. 104-113
Faraone, S., Biederman, J., and Mick, E. (2006). The age-dependent decline of attention deficit hyperactivity disorder: a meta-analysis of follow-up studies.
Psychological Medicine, 36(2), pp. 159-165
Ford, T., Fowler, T., Langley, K., et al. (2008). Five years on: Public sector service use related to mental health in young people with ADHD or hyperkinetic disorder five years after diagnosis. Child and Adolescent Mental Health, 13(3), pp. 122-129
Goodman, R., Ford, T., Richards, H., et al. (2000). The Development and Well-Being Assessment: description and initial validation of an integrated assessment of child and adolescent psychopathology. The Journal of Child Psychology and Psychiatry
and Allied Disciplines, 41(5), pp. 645-655
Green, H., McGinnity, Á., Meltzer, H., et al. (2005). Mental health of children and
young people in Great Britain, 2004. London, TSO
Jotangia, D., and Brugha, T. (2009). Chapter 7: Attention deficit hyperactivity disorder. In McManus, S., Meltzer, H., Brugha, T., et al. (eds), Adult psychiatric morbidity in
England, 2007: results of a household survey, Leeds: Health and Social Care
Information Centre
Lahey, B., Pelham, W., Chronis, A., et al. (2006). Predictive validity of ICD‐10
hyperkinetic disorder relative to DSM‐IV attention‐deficit/hyperactivity disorder among younger children. Journal of Child Psychology and Psychiatry, 47(5), pp. 472-479
Loe, I., and Feldman, H. (2007). Academic and Educational Outcomes of Children with ADHD. Journal of Pediatric Psychology, 32(6), pp. 643-654
Meltzer, H., Gatward, R., Goodman, R., et al. (2000). The mental health of children
National Institute for Health and Care Excellence. (2018). Attention deficit
hyperactivity disorder: diagnosis and management. Available at:
https://www.nice.org.uk/guidance/ng87/informationforpublic [Accessed 26 September 2018]
Ohan, J., and Johnston, C. (2005). Gender appropriateness of symptom criteria for Attention-Deficit/Hyperactivity Disorder, Oppositional-Defiant Disorder, and Conduct Disorder. Child Psychiatry and Human Development, 35(4), pp. 359-381
Russell, A., Ford, T., Williams, R., et al. (2016). The association between
socioeconomic disadvantage and attention deficit/hyperactivity disorder (ADHD): a systematic review. Child Psychiatry and Human Development, 47(3), 440-458
Sawyer, S., Azzopardi, P., Wickremarathne, D., et al. (2018). The age of adolescence. The Lancet Child & Adolescent Health, 2(3), pp. 223-228
Scahill, L., Schwab-Stone, M., Merikangas, K., et al. (1999). Psychosocial and clinical correlates of ADHD in a community sample of school-age children. Journal of the
American Academy of Child & Adolescent Psychiatry, 38(8), pp. 976-984
Sikirica, V., Flood, E., Dietrich, C., et al. (2015). Unmet needs associated with attention-deficit/hyperactivity disorder in eight European countries as reported by caregivers and adolescents: results from qualitative research. The Patient -
Patient-Centered Outcomes Research, 8(3), pp. 269-281
Skounti, M., Philalithis, A. and Galanakis, E. (2007). Variations in prevalence of attention deficit hyperactivity disorder worldwide. European Journal of
Pediatrics, 166(2), pp.117-123
Taylor, E., Döpfner, M., Sergeant, J., et al. (2004). European clinical guidelines for hyperkinetic disorder – first upgrade. European Child & Adolescent Psychiatry, 13(1), pp. 17-30
van Lieshout, M., Luman, M., Twisk, J., et al. (2016). A 6-year follow-up of a large European cohort of children with attention-deficit/hyperactivity disorder-combined subtype: outcomes in late adolescence and young adulthood. European Child &
Adolescent Psychiatry, 25(9), pp. 1007-1017
World Health Organization. (1992). The ICD-10 Classification of Mental and
Behavioural Disorders: Clinical descriptions and diagnostic guidelines, WHO: Geneva
World Health Organization. (1993). The ICD-10 classification of mental and
www.digital.nhs.uk
0300 303 5678
enquiries@nhsdigital.nhs.uk
@nhsdigital
This publication may be requested
in large print or other formats.
Published by NHS Digital, part of the Government Statistical Service
Copyright © 2018 Health and Social Care Information Centre.
The Health and Social Care Information Centre is a non-departmental body created by statute, also known as NHS Digital.
You may re-use this document/publication (not including logos)
free of charge in any format or medium, under the terms of the Open Government Licence v3.0.
To view this licence visit
www.nationalarchives.gov.uk/doc/open-government-licence or write to the Information Policy Team, The National Archives, Kew, Richmond, Surrey, TW9 4DU;