Department for Work and Pensions
Department for Work and Pensions
Department for Work and Pensions
Department for Work and Pensions
Department for Work and Pensions
Research Report No 340
Research Report No 340
Research Report No 340
Research Report No 340
Research Report No 340
Corporate Document Services
Corporate Document Services
Corporate Document Services
Corporate Document Services
Corporate Document Services
Families with children in
Families with children in
Families with children in
Families with children in
Families with children in
Britain: Findings from the
Britain: Findings from the
Britain: Findings from the
Britain: Findings from the
Britain: Findings from the
2004 Families and Children
2004 Families and Children
2004 Families and Children
2004 Families and Children
2004 Families and Children
Study (FACS)
Study (FACS)
Study (FACS)
Study (FACS)
Study (FACS)
Nick Lyon, Matt Barnes and Daniel Sweiry
Nick Lyon, Matt Barnes and Daniel Sweiry
Nick Lyon, Matt Barnes and Daniel Sweiry
Nick Lyon, Matt Barnes and Daniel Sweiry
Nick Lyon, Matt Barnes and Daniel Sweiry
© Crown Copyright 2006. Published for the Department for Work and Pensions
under licence from the Controller of Her Majesty’s Stationery Office by Corporate
Document Services, Leeds.
Application for reproduction should be made in writing to The Copyright Unit,
Her Majesty’s Stationery Office, St Clements House, 2-16 Colegate,
Norwich NR3 1BQ.
First Published 2006.
ISBN 1 84123 995 X
Views expressed in this report are not necessarily those of the Department for
Work and Pensions or any other Government Department.
iii
iii
iii
iii
iii
Contents
Contents
Contents
Contents
Contents
Contents
Acknowledgements ... xiii
The Authors ... xiv
Glossary of terms ... xv
Summary ... 1
1 Introduction ... 7
1.1
The Families and Children Study ... 8
1.1.1
Objectives of the study ... 8
1.1.2
Sample design ... 8
1.1.3
Defining families with children – units of interest ... 9
1.1.4
Data collection ... 10
1.1.5
Response rates in 2004 ... 12
1.1.6
Non-response and weighting ... 13
1.2
The content of the report ... 14
1.3
Guide to methods used in the tables... 15
2 The characteristics of families with children ... 17
2.1
Family type ... 17
2.2
Marital status ... 18
2.3
Work status ... 18
2.4
Age of youngest child ... 19
2.5
Ethnicity ... 19
2.6
Total family income ... 19
3 Health, lifestyles and participation ... 35
3.1
Health of mothers ... 35
3.2
Longstanding illness ... 35
3.3
Smoking ... 36
i v
i v
i v
i v
i v
Contents
Contents
Contents
Contents
Contents
4 Education and training ... 47
4.1
Qualifications achieved ... 47
4.2
Training ... 48
5 Work ... 71
5.1
Employment status ... 71
5.2
Hours ... 71
5.3
Standard Occupational Classification ... 72
5.4
Duration ... 72
5.5
Leaving ... 72
5.6
Reasons for not working ... 72
6 Total family income ... 117
6.1
Income ... 117
6.2
Equivalised income ... 118
6.2.1
Chapter notes – defining total family income in the
Families and Children Study ... 118
6.2.2
The equivalisation process ... 119
7 Benefits and tax credits ... 131
7.1
Receipt of benefits and tax credits ... 131
7.2
Amount of income received from benefits and tax credits ... 131
7.3
Awareness of financial support for families with children ... 132
7.4
Applications for WTC and CTC ... 132
7.5
Awareness about the rules and payment method of the
new tax credits ... 133
8 Money management and savings... 153
8.1
Access to basic financial services: current and savings accounts .. 153
8.2
Savings ... 153
8.3
Borrowing and debt ... 153
8.4
Other assistance ... 154
8.5
Managing family income ... 155
9 Housing... 181
9.1
Tenure and housing costs ... 181
9.2
Type of housing ... 182
9.3
Housing conditions ... 182
10 Material deprivation... 201
10.1
Items or activities families were unable to afford ... 201
10.2
Number of food and meal items families were unable to afford . 202
10.3
Number of items or activities families were unable to afford ... 202
vvvvv
Contents
Contents
Contents
Contents
Contents
11 Child characteristics ... 221
12 Child health ... 231
12.1
Health status of children ... 231
12.2
Child’s longstanding illness ... 231
12.3
Visits to Accident and Emergency ... 232
12.4
Visits to the doctor and dentist ... 232
13 Schooling ... 241
13.1
Travel to school ... 241
13.2
School performance ... 242
13.3
Homework ... 242
13.4
School behaviour ... 243
13.5
Special Educational Need ... 243
13.6
Absences from school ... 243
13.7
Post school aspirations ... 244
13.8
Self reported behaviour ... 244
13.8.1 Importance of good marks ... 244
13.8.2 Homework ... 244
13.8.3 Punishment at school ... 245
13.8.4 Skipping school ... 245
13.8.5 Bullying ... 245
13.8.6 Aspirations ... 245
14 Children’s activities and leisure time ... 277
14.1
Time spent active ... 277
14.2
Social activities ... 277
14.3
Watching TV ... 277
14.4
Technology ... 278
14.5
Parental control ... 279
14.6
Police contact ... 280
14.7
Smoking, drinking alcohol and taking drugs ... 280
14.8
Work and money ... 281
14.9
Money received ... 281
14.10 Handling money ... 281
14.11 Happiness ... 282
15 Child maintenance ... 311
15.1
Child support receipt and type of agreement ... 311
15.2
Amounts received ... 311
15.3
Reliability ... 311
v i
v i
v i
v i
v i
Contents
Contents
Contents
Contents
Contents
16 Childcare ... 323
16.1
Usage and arrangements for working mothers ... 323
16.2
Types of childcare for working mothers ... 323
16.3
Usage by mothers not in work ... 324
16.4
Term time arrangements ... 324
16.5
Use of eligible and ineligible childcare ... 325
16.6
Payment ... 325
16.7
Cost ... 325
16.8
Quality of childcare ... 326
16.9
Availability ... 326
16.10 Information ... 326
16.11 Affordability ... 326
16.12 Information sources ... 327
Appendix A Weighting the FACS analysis ... 347
Appendix B
Standard error analysis ... 355
References ... 379
[image:6.595.97.498.113.389.2]List of tables
Table 1.1
Productive interviews for families used in the FACS 2004
Annual report ... 13
Table 2.1
Family characteristics by family type ... 21
Table 2.2
Family characteristics by marital status ... 24
Table 2.3
Family characteristics by family unit work status ... 27
Table 2.4
Family characteristics by age of youngest child ... 30
Table 2.5
Family characteristics by ethnic group of mother ... 31
Table 2.6
Family characteristics by total family income ... 33
Table 3.1
Mother’s self-reported health status by family characteristics .. 37
Table 3.2
Mother’s longstanding limiting illness or disability by
family characteristics ... 39
Table 3.3
Impact of mother’s limiting longstanding illness or disability
on work by family characteristics ... 40
Table 3.4
Mother’s smoking behaviour by family characteristics ... 41
Table 3.5
Mother’s smoking behaviour during pregnancy by family
characteristics ... 43
Table 3.6
Mother’s drinking behaviour by family characteristics ... 44
Table 4.1
Whether family has any qualifications (academic or vocational)
by family characteristics ... 49
vii
vii
vii
vii
vii
Contents
Contents
Contents
[image:7.595.143.499.107.806.2]Contents
Contents
Table 4.3
Highest academic qualification of mother by family
characteristics ... 54
Table 4.4
Highest academic qualification of partner by family
characteristics ... 56
Table 4.5
Highest vocational qualification of mother by family
characteristics ... 58
Table 4.6
Highest vocational qualification of partner by family
characteristics ... 59
Table 4.7
Highest vocational qualification in the family by family
characteristics ... 60
Table 4.8
Whether mother attended a training course in the last
year by family characteristics ... 62
Table 4.9
Whether partner attended a training course in the last
year by family characteristics ... 63
Table 4.10
Whether mother’s most recent training course was designed
to lead to a qualification by family characteristics ... 64
Table 4.11
Whether partner’s most recent training course was
designed to lead to a qualification by family characteristics ... 66
Table 4.12
Whether mother has taken part in any in-work
training in last 12 months by family characteristics ... 67
Table 4.13
Whether partner has taken part in any in-work training in last
12 months by family characteristics ... 68
Table 4.14
Amount of in-work training mother has taken part in during
last 12 months by family characteristics ... 69
Table 5.1
Family unit work status by family characteristics ... 74
Table 5.2
Work status of mother by family characteristics ... 77
Table 5.3
Work status of partner by family characteristics ... 80
Table 5.4
Hours of work of mother by family characteristics ... 83
Table 5.5
Hours of work of partner by family characteristics ... 85
Table 5.6
SOC-2000 major group of mother by family characteristics ... 87
Table 5.7
SOC-2000 major group of partner by family characteristics ... 91
Table 5.8
Travel to work costs of mother by family characteristics ... 94
Table 5.9
Duration since mother was last in paid employment by
family characteristics ... 96
Table 5.10
Main reason for mother leaving her last job by family
characteristics ... 98
Table 5.11
Reasons mother does not work 16 or more hours per week by
family characteristics (mother working 1-15 hours a week) ... 104
Table 5.12
Reasons mother does not work 16 or more hours per week
by family characteristics (mother not working) ... 110
Table 6.1
Equivalence scale values ... 119
viii
viii
viii
[image:8.595.141.508.112.799.2]viii
viii
Contents
Contents
Contents
Contents
Contents
Table 6.3
Average total family income by family characteristics ... 123
Table 6.4
Proportion of total unequivalised weekly family income
(BHC) made up by different income sources by family
characteristics ... 125
Table 6.5
Total OECD equivalised family income (BHC) quintiles by
family characteristics ... 128
Table 7.1
Main respondent benefit receipt by family characteristics ... 134
Table 7.2
Banded amount of total benefit/tax credit (per week) receipt
of main respondent by family characteristics ... 138
Table 7.3
Total benefit receipt (median £ per week) of main respondent
by family characteristics ... 139
Table 7.4
Awareness of financial support, apart from Child Benefit to
families with children or people in work by family
characteristics ... 140
Table 7.5
Method of hearing about WTC or CTC by family
characteristics ... 142
Table 7.6
Applications for New Tax Credits (WTC and CTC) by
family characteristics ... 145
Table 7.7
Awareness of rules among those families who have received,
are receiving, or are familiar with NTCs ... 146
Table 7.8
Awareness of the maximum that can be earned (in a year)
and still receive some Child Tax Credit ... 149
Table 7.9
Changes in circumstances that may have affected NTC
(WTC and CTC) award by family characteristics ... 150
Table 8.1
Whether family holds current or savings accounts by
family characteristics ... 156
Table 8.2
Whether save regularly and why by family characteristics ... 158
Table 8.3
Borrowing in the last 12 months by family characteristics ... 160
Table 8.4
Whether currently behind with bills by family characteristics . 164
Table 8.5
Number of debts by family characteristics ... 168
Table 8.6
Mean number of debts by family characteristics ... 171
Table 8.7
Financial help received from family by family characteristics .. 173
Table 8.8
Whether money runs out before the end of the
week/month ... 175
Table 8.9
Worry about money by family characteristics... 177
Table 8.10
How well families are managing financially by family
characteristics ... 178
Table 8.11
Organisation of family finances by family characteristics ... 180
Table 9.1
Housing tenure by family characteristics ... 183
Table 9.2
Weekly housing costs (gross) by family characteristics ... 185
Table 9.3
Mean and median housing costs (gross) by family
characteristics ... 188
i x
i x
i x
i x
i x
Contents
Contents
Contents
Contents
Contents
Table 9.5
Mean and median housing costs (net) by family
characteristics ... 193
Table 9.6
Type of housing by family characteristics ... 195
Table 9.7
Property’s state of repair by family characteristics ... 198
Table 10.1a Food and meal items a family cannot afford by family type ... 205
Table 10.1b Clothing and shoes items a family cannot afford by
family type ... 206
Table 10.1c Consumer durable items a family cannot afford by family
type ... 207
Table 10.1d Leisure activities a family cannot afford by family type ... 208
Table 10.2
Number of food and meal items a family cannot afford by
family characteristics ... 209
Table 10.3
Number of clothes and shoes items a family cannot afford by
family characteristics ... 211
Table 10.4
Number of consumer durable items a family cannot afford by
family characteristics ... 213
Table 10.5
Number of leisure activities a family is unable to afford by
family characteristics ... 215
Table 10.6
Number of all deprivation items a family cannot afford by
family characteristics ... 217
Table 10.7
Mean relative material deprivation score (RMDS) by family
characteristics ... 219
Table 11.1
Characteristics of child’s family by family type ... 223
Table 11.2
Characteristics of child’s family by total family income ... 227
Table 12.1
Child’s self-reported health status by family characteristics .... 233
Table 12.2
Child’s longstanding illness or disability by family
characteristics ... 234
Table 12.3
Child’s visits to Accident and Emergency department in the
previous 12 months by family characteristics ... 235
Table 12.4
Child’s limiting longstanding illness or disability and school
by family characteristics ... 236
Table 12.5
Impact of child’s longstanding illness or disability on mother’s
ability to work by family characteristics ... 237
Table 12.6
Child’s reported visits to doctor and dentist in last year by
family characteristics ... 238
Table 13.1
Distance travelled to school by family characteristics ... 246
Table 13.2
Journey to school (method of transport) by family
characteristics ... 247
Table 13.3
Journey to school by distance travelled ... 250
Table 13.4
School performance in Maths by family characteristics ... 251
Table 13.5
School performance in English by family characteristics ... 253
Table 13.6
School performance in Science by family characteristics ... 255
xxxxx
Contents
Contents
Contents
Contents
Contents
Table 13.8
Amount of homework child completes by family
characteristics ... 259
Table 13.9
Help with homework by family characteristics ... 260
Table 13.10 School behaviour by family characteristics ... 261
Table 13.11 Problems at school: Sources of advice ... 262
Table 13.12 Whether child has Special Educational Need (SEN) by family
characteristics ... 263
Table 13.13 Type of Special Educational Need (SEN) ... 264
Table 13.14 Reasons child had been away from school for at least half
a day in the previous 12 months ... 265
Table 13.15 Mothers’ post school aspirations by family characteristics ... 266
Table 13.16 Mothers’ post school aspirations for child/ren at 20 years of
age by family characteristics ... 267
Table 13.17 Importance of getting good marks by family characteristics ... 268
Table 13.18 Self-reported completion of homework by family
characteristics ... 270
Table 13.19 Self-reported number of times punished at school in the
last year by family characteristics ... 272
Table 13.20 Self-reported number of times skipped school in the last
year by family characteristics ... 273
Table 13.21 Self-reported number of times bullied in the last year by
family characteristics ... 274
Table 13.22 Self-reported what child(ren) would like to do when they
are 16 by family characteristics ... 275
Table 14.1
Self-reported amount of time child spent active in last week
by family characteristics ... 283
Table 14.2
Self-reported child social life by family characteristics ... 285
Table 14.3
Self-reported hours spent watching television on a normal
school day by family characteristics ... 287
Table 14.4
Self-reported access to and use of technology by family
characteristics ... 289
Table 14.5
Self-reported parental control by family characteristics ... 291
Table 14.6
Number of times child was in contact with the police in last
12 months by family characteristics ... 293
Table 14.7
Self-reported child’s smoking, drinking alcohol and drugs
by family characteristics ... 295
Table 14.8
Problems with child’s smoking, drinking or taking drugs in
last 12 months by family characteristics ... 297
Table 14.9
Self-reported child’s work by family characteristics ... 299
Table 14.9b Self-reported child’s work by family characteristics
continued - number of hours worked ... 300
Table 14.10 Self reported money received by child in last week by family
characteristics ... 301
x i
x i
x i
x i
x i
Contents
Contents
Contents
Contents
Contents
Table 14.12 Self-reported feelings about school work and appearance by
family characteristics ... 305
Table 14.13 Self-reported feelings about health and family by family
characteristics ... 307
Table 14.14 Self-reported feelings about life as a whole by family
characteristics ... 309
Table 15.1
Child support receipt by family characteristics ... 313
Table 15.2
Receipt of child support by family characteristics ... 314
Table 15.3
Type of agreement to receive child support by family
characteristics ... 315
Table 15.4a Total amount of child support received by family
characteristics ... 316
Table 15.4b Mean and median weekly amount of child support
received by family characteristics ... 317
Table 15.5a Reliability of child maintenance payments (all agreements)
by family characteristics ... 318
Table 15.5b Reliability of child maintenance payments (court order)
by family characteristics ... 319
Table 15.5c Reliability of child maintenance payments (voluntary
agreement) by family characteristics ... 320
Table 15.5d Reliability of child maintenance payments (Child Support
Agency assessment) by family characteristics ... 321
Table 15.6
Frequency of contact between child and non-resident parent
by family characteristics ... 322
Table 16.1
Childcare arrangements for children with working mothers
by family characteristics ... 328
Table 16.2
Childcare arrangements for children with non-working
mother by family characteristics ... 331
Table 16.3
Whether childcare arrangements are the same during
term-time and holidays by family characteristics ... 334
Table 16.4
Childcare arrangements by family characteristics ... 335
Table 16.5
Whether pay for childcare (school term-time or school
holidays) by family characteristics ... 337
Table 16.6
Total weekly childcare costs (school term-time) by family
characteristics ... 338
Table 16.7
Total weekly childcare costs (school holidays) by family
characteristics ... 339
Table 16.8
Quality of childcare (at any time) in local area by family
characteristics ... 340
Table 16.9
Availability of childcare places (at any time) in local area by
family characteristics ... 341
Table 16.10 Level of information available about childcare (at any time)
[image:11.595.98.496.107.810.2]xii
xii
xii
xii
xii
Table 16.11 Overall affordability of childcare (at any time) in local area by
family characteristics ... 343
Table 16.12 Sources of information about childcare in local area by
family characteristics ... 344
Table A.1
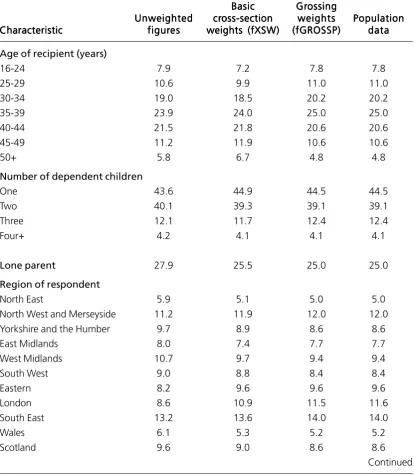
Proportions derived from the totals provided by HMRC ... 348
Table A.2
Control totals for fgrossp ... 349
Table A.3
Effects of cross-sectional and grossing weights 2005 ... 350
Table A.4
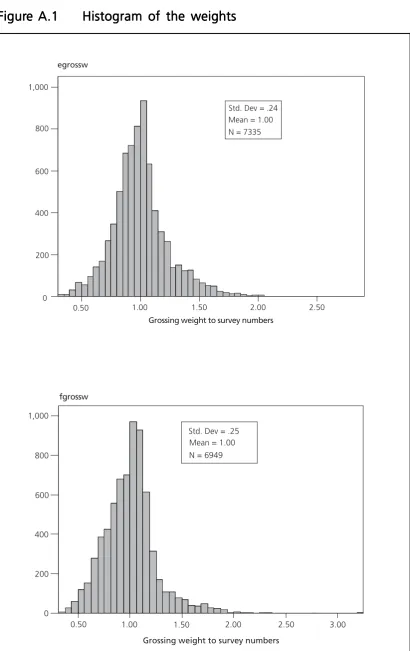
Descriptive statistics for egrossw and fgrossw ... 352
Table B.1
True standard errors and 95 per cent confidence intervals
for family type by family characteristics ... 356
Table B.2
True standard errors and 95 per cent confidence intervals
for mother’s self-reported health status by family
characteristics ... 358
Table B.3
True standard errors and 95 per cent confidence intervals
for highest academic qualification in family by family
characteristics ... 360
Table B.4
True standard errors and 95 per cent confidence intervals
for family unit work status by family characteristics ... 362
Table B.5
True standard errors and 95 per cent confidence intervals
for banded total family income by family characteristics ... 364
Table B.6
True standard errors and 95 per cent confidence intervals
for benefit receipt (new tax credits) by family
characteristics ... 366
Table B.7
True standard errors and 95 per cent confidence intervals
for holding a current or savings account by family
characteristics ... 367
Table B.8
True standard errors and 95 per cent confidence intervals
for housing tenure by family characteristics ... 369
Table B.9
True standard errors and 95 per cent confidence intervals
for child’s family type by family characteristics ... 371
Table B.10
True standard errors and 95 per cent confidence intervals for
child’s health status by family characteristics ... 373
Table B.11
True standard errors and 95 per cent confidence intervals for
distance travelled to school by family characteristics ... 374
Table B.12
True standard errors and 95 per cent confidence intervals for
amount of time spent active by family characteristics ... 375
Table B.13
True standard errors and 95 per cent confidence intervals
for child support receipt by family characteristics... 376
Table B.14
True standard errors and 95 per cent confidence intervals for
childcare arrangements by family characteristics ... 377
List of figures
Figure A.1
Histogram of the weights ... 353
Contents
Contents
Contents
[image:12.595.98.499.125.763.2]xiii
xiii
xiii
xiii
xiii
Acknowledgements
This report was undertaken by the National Centre for Social Research (NatCen),
with contributions from researchers at the Department for Work and Pensions
(DWP). The authors take responsibility for any errors or omissions in this report.
The Families and Children Study (FACS) is commissioned by the DWP, and
sponsored by Her Majesty’s Revenue & Customs (HMRC), Department for Education
and Skills, Office of the Deputy Prime Minister and Department for Transport. We
would like to thank these organisations for their continuing support of the study.
We would like to thank those at DWP and HMRC who have co-ordinated different
aspects of the research programme at various times: at DWP, Elizabeth Rayner, Vicki
Robinson, John Stafford, Grace Williams and Stephen Morris; at HMRC, Tristan
Childs, Mehdi Hussain, Yee-Wan Yau and Mike Bielby. At the NatCen, Matt Barnes
and Clare Tait have ensured that the survey continues to run smoothly. We would
also like to thank Stephen McKay for his advice on the design and analysis of the
FACS survey.
We would like to thank various people at the NatCen for their contribution to the
report. For his work on producing the standard error calculations we would like to
thank Shaun Scholes.
We give particular thanks to all the families who have given their time to be
interviewed at some point during the study.
Acknowledgements
Acknowledgements
Acknowledgements
xiv
xiv
xiv
xiv
xiv
The Authors
Nick Lyon,
Nick Lyon,
Nick Lyon,
Nick Lyon,
Nick Lyon, is a Senior Researcher at the National Centre for Social Research.
Matt Barnes,
Matt Barnes,
Matt Barnes,
Matt Barnes,
Matt Barnes, is a Research Director at the National Centre for Social Research.
Daniel Sweiry,
Daniel Sweiry,
Daniel Sweiry,
Daniel Sweiry,
Daniel Sweiry, is a Statistical Officer at the Department for Work and Pensions.
The Authors
The Authors
The Authors
x v
x v
x v
x v
x v
Glossary of terms
Glossary of terms
Glossary of terms
Glossary of terms
Glossary of terms
Glossary of terms
Couple family
Couple family
Couple family
Couple family
Couple family
A family with dependent children that was
headed by one natural or adoptive parent, and
a partner.
Dependent children
Dependent children
Dependent children
Dependent children
Dependent children
Children aged 16 years or younger, or 17 or 18
years and in full-time education.
Dual earners
Dual earners
Dual earners
Dual earners
Dual earners
A couple family where the mother and her
partner both worked for 16 or more hours per
week.
Equivalised income
Equivalised income
Equivalised income
Equivalised income
Equivalised income
The equivalisation of income is the process by
which total income is adjusted for family size
(number of family members) and composition
(number of parents and number and age of
children).
FACS
FACS
FACS
FACS
FACS
The acronym used to describe the Families and
Children Study.
Family (unit)
Family (unit)
Family (unit)
Family (unit)
Family (unit)
Comprises two generations of people; at least
one dependent child and at least one adult
who is responsible for this child.
Full-time work
Full-time work
Full-time work
Full-time work
Full-time work
Paid work of 30 or more hours per week.
Lone father
Lone father
Lone father
Lone father
Lone father
A male lone parent.
Lone mother
Lone mother
Lone mother
Lone mother
Lone mother
A female lone parent.
Lone parent family
Lone parent family
Lone parent family
Lone parent family
Lone parent family
A family with dependent children that was
xvi
xvi
xvi
xvi
xvi
Glossary of terms
Glossary of terms
Glossary of terms
Glossary of terms
Glossary of terms
Mother
Mother
Mother
Mother
Mother
Used to refer to the person who took part in
the main FACS interview. This person was
usually the family’s ‘mother figure’ – an adult
with the main responsibility for looking after
the children in the family. In the vast majority
of couple families this person was female. In
lone parent families this person was either the
lone mother or the lone father.
Not working
Not working
Not working
Not working
Not working
No work (i.e. working zero hours).
Not working 16 or
Not working 16 or
Not working 16 or
Not working 16 or
Not working 16 or
Work of one to 15 hours or no work
more hours per week
more hours per week
more hours per week
more hours per week
more hours per week
(i.e. working zero hours).
Parent
Parent
Parent
Parent
Parent
The adult responsible for the child. This can be
the child’s natural or adoptive parent, or the
legal guardian(s) to whom Child Benefit is
paid. In couple families both adults are referred
to collectively as the parents.
Partner
Partner
Partner
Partner
Partner
The person with whom the mother shares a
1
1
1
1
1
Summary
Summary
Summary
Summary
Summary
Summary
Characteristics of families (Chapter 2)
In 2004 a quarter of families with children were lone parent families. Lone parent
families were nearly four times more likely than couple families to live in social
housing or privately rented accommodation, and over eight times more likely to
have a total family income in the lowest income quintile.
Families that contained no one working 16 or more hours per week were more likely
to be in the lowest income quintile than those that contained at least one parent
who worked for 16 or more hours per week. Over half of families in the lowest
income quintile were lone parent families where the parent did not work 16 hours or
more per week. Most couple families had two dependent children whereas having
one dependent child was most common among lone parent families.
Health, lifestyles and participation (Chapter 3)
One in ten mothers described their health over the last 12 months as ‘not good’.
Lone parents were twice as likely to describe their health as ‘not good’ compared
with mothers in couple families. Mothers who lived in families where no one worked
were more likely to describe their health as ‘not good’ than mothers living in families
where at least one parent worked.
Lone parents, mothers in families where no one worked and mothers in families with
the lowest income were the groups of people most likely to smoke. Conversely,
alcohol consumption was highest for mothers in work or living in families with a high
income.
Education and training (Chapter 4)
2
2
2
2
2
Summary
Summary
Summary
Summary
Summary
income quintile did not have any qualifications. In general, parents in lone parent
families were less qualified than those in couple families. Of all mothers, regardless
of family unit work status, fewer than three in ten had taken part in a training course
in the previous year.
Work (Chapter 5)
As was the case in 2003, four out of five families in 2004 had at least one parent
working 16 or more hours per week. However, just under half of lone mothers
worked no hours compared with over one-quarter of couple mothers. Mothers in
couple families who worked were more likely to be in highly skilled jobs than
working lone parents. Just over half of mothers not in work reported ‘to be with
children’ as a reason for not working. Other main barriers for mothers not in work
included having an illness or disability and childcare costs.
Total family income (Chapter 6)
Lone parent families were over three times as likely as couple families to belong to
the lowest income quintile (40 per cent and 12 per cent respectively) based on
equivalised income before housing costs. The working status of the family was seen
to have a strong association with the probability of having a low income, with
families with no parent in work or working less than 16 hours per week particularly
likely to be in the lowest income quintile.
Benefits and tax credits (Chapter 7)
Just over three-quarters of families received either a benefit or a tax credit, excluding
Child Benefit. Over three-fifths of families receiving a benefit or tax credit were in
receipt of either Working Tax Credit or Child Tax Credit. The median amount of
income received from all benefits and tax credits was just over £50 per week. Lone
parents, families where no one worked or worked for less than 16 hours per week,
and families with young children received more benefits and tax credits than other
families.
Money management and savings (Chapter 8)
3
3
3
3
3
Summary
Summary
Summary
Summary
Summary
Housing (Chapter 9)
Most families owned or were buying their home; this was more common for couple
families than lone parent families. The average (mean) gross weekly housing cost
was £97.00. Social tenants generally had lower housing costs than private tenants.
The majority of families felt that their housing was in a ‘very good’ or ‘excellent’ state
of repair. Those most likely to report having housing in a ‘fairly poor’ state were
families (lone parent or couple) not working 16 or more hours per week. In general
(regardless of family type), families without at least one parent working 16 or more
hours per week were more likely to be disadvantaged in terms of housing than
families with at least one parent working these hours.
Material deprivation (Chapter 10)
Families did not necessarily go without items and activities to a similar degree.
Families were less likely to go without food and meal items, such as a main meal
every day and fruit on most days, and consumer durables, such as a telephone and
a washing machine. More common deprivation was in the form of leisure activities
such as a one-week holiday and money for trips or outings. There were also some
positive signs of deprivation decreasing in some instances since 2003.
Likewise, not all families experienced the same magnitude of deprivation. Lone
parent families, families where no one was in work of 16 or more hours per week,
families with four or more children, families with a non-white mother figure and
families in the lowest income quintile were, on average, more likely to be deprived
than other families.
Child characteristics (Chapter 11)
Around one-quarter of children lived in a lone parent family and the remaining
three-quarters of children lived in a couple family. One-tenth of children lived with a
lone parent who worked 16 hours or more per week. A further 13 per cent lived with
a lone parent who was not in work or worked fewer than 16 hours per week. Almost
two-fifths of all children lived in a couple family where both the mother and her
partner worked 16 or more hours per week. Around one-third lived in a couple
family where one parent (or partner) worked 16 or more hours per week. Few (six
per cent) children lived in a couple family where no one worked 16 or more hours per
week.
4
4
4
4
4
Summary
Summary
Summary
Summary
Summary
to have a mother aged 40 years or older (37 per cent compared with 30 per cent); to
have a mother who was an owner-occupier (78 per cent compared with 31 per
cent); and be in the highest income quintile (22 per cent compared with one per
cent).
Child health and well being (Chapter 12)
The vast majority of mothers described their child’s health as good. Few children
(three per cent) were described as having health that was ‘not good’ and 15 per cent
were reported as having a longstanding illness or disability. Those children living in
a lone parent family were more likely to have their health described as ‘not good’
and/or have a longstanding illness compared to those in a couple family. In just
under one-third of cases in which a child had a reported longstanding illness/
disability, this illness or disability limited the child’s ability to attend school. This was
less common among those children living in families with at least one parent
working 16 or more hours per week.
Schooling (Chapter 13)
The majority of children (47 per cent) walked to school, one-fifth used some form of
public transport (including public bus, school/local authority school bus and train),
and the remaining children (29 per cent) travelled to school in a car. Walking was the
preferred mode of transport where children lived within one mile of their school.
Just over two-thirds of children aged 11-15 were thought by their parents to
complete ‘all or almost all’ of their homework. Girls were reported to complete ‘all or
almost all’ of their homework more often than boys, as were those in families in
which one or more parent(s) worked 16 or more hours per week. Children with
parent(s) working 16 or more hours per week were also more likely to receive help
with their homework.
5
5
5
5
5
Children’s activities and leisure time (Chapter 14)
Most 11-15 year olds watched one to three hours of television a day, had access to
a computer and had used a computer in the last week. In addition, the majority
owned a mobile phone, and three quarters had been on holiday. Around one-third
of children reported doing some paid work in the last week. Almost all children
reported participating in sport, though participation declined with age and this
decline was greater among girls than boys.
Most children reported that their parents exercised some control over their lives –
over half said their parents set limits on the television programmes they watched,
over three-quarters reported that they always or nearly always told their parents
where they were going, and over four-fifths reported that they had not been out
after nine pm without their parents knowing where they were going.
Four per cent of children aged 11 to 15 said that they smoked regularly and two per
cent said they drank alcohol regularly. The proportion of children who reported
being offered drugs was 12 per cent. Of those who had been offered drugs, 14 per
cent also said their friends used drugs.
The majority of children felt happy about their lives. In particular, most children were
happy about their health (87 per cent) and their families (94 per cent). It is important,
however, to note that three per cent of children said they were unhappy about their
lives as a whole.
Child maintenance (Chapter 15)
Half the families where at least one child had a non-resident parent did not have an
order or agreement for child support in place. Two-thirds of these families had
received some child maintenance payments. Working families were more likely to
report having arrangements in place and to actually be in receipt of payments. The
median weekly amount of maintenance was £46.00; families with a voluntary
maintenance agreement were found to be more likely to receive all their payment on
time compared with those with a Child Support Agency assessment. Contact
between children and their non-resident parent varied between two extremes. A
quarter of children had no contact with their non-resident parent, while over
one-third saw their non-resident parent at least once a week.
Childcare (Chapter 16)
The younger the child(ren) the more likely it was that families would use some form
of childcare. The level of use of childcare fell when children started school, but was
still high and remained at much the same level up to age ten. There was then a
further fall as children approached their teens before dropping to a low level as they
moved through their teens. Overall, childcare use increased for working mothers in
2004 (65 per cent – three percentage points higher than 2003).
Summary
Summary
Summary
6
6
6
6
6
Informal types of childcare (such as care provided by family, friends or neighbours)
predominated for all types of family circumstances. Formal types of childcare – ones
eligible for government support (such as care provided by nurseries or registered
childminders) with payment – were used principally for pre-school, and to a lesser
extent young school-age children. How much formal childcare was used differed
most according to the working status of the family. Those families with someone not
working or working one to 15 hours per week used formal childcare much less than
families in which at least one parent worked 16 or more hours per week. Despite
this, overall use of childcare in families in which the mother was not in work
increased in 2004 (48 per cent – eight percentage points higher than 2003).
Perceptions of childcare services were generally mixed. Mothers in families with
younger children and those in families in which at least one parent worked 16 or
more hours per week were more likely to express an opinion about childcare
services. These views (about the issues of quality, affordability and the amount of
childcare places available locally), however, were sometimes more positive and
sometimes more negative. For all these issues there were substantial minorities who
felt that there were problems with childcare services. Those with young children
were the most likely to have gathered information about childcare, typically by word
of mouth.
Summary
Summary
Summary
7
7
7
7
7
Introduction
Introduction
Introduction
Introduction
Introduction
1 Introduction
The 2004 Families and Children Study
1(FACS)
is the sixth in a series of annual surveys
to investigate the circumstances of British families with dependent children. The
study began in 1999 with a survey of all lone parent families and
low/moderate-income couples
2. In 2001 the third annual study was enlarged to be representative
of all families with dependent children.
This report presents statistics, based on a representative snapshot of the circumstances
of all families with dependent children in 2004. The report is divided into two parts.
Chapters 2 to 10 look at a distinct feature of family life. Some of the chapters focus
on the circumstances of the family unit – such as housing, income, and material well
being – some on the circumstances of the adults in the family (the ‘mother figure’
3mainly but also her partner if relevant) – such as work and health. Chapters 11 to 16
look at a distinct feature of children’s lives – such as health and schooling, childcare,
child maintenance and some on the circumstances of the children in the family. At
the front of the report there is a glossary and acknowledgements to the people who
contributed to the 2004 FACS research programme. At the end of this chapter there
is a guide to using the tables.
1
The study is commissioned by the Department for Work and Pensions, and
sponsored by Her Majesty’s Revenue and Customs, Department for Education
and Skills, Office of the Deputy Prime Minister and Department for Transport.
2
Low/moderate income couple families were defined as eligible if neither adult
was working or the family income was less than £275 a week for a family with
one child, with this threshold increasing to a weekly income of less than £425
for a family with four or more children.
3
Definitions relating to the family unit, the ‘mother figure’ and her partner are
8
8
8
8
8
Introduction
Introduction
Introduction
Introduction
Introduction
1.1
The Families and Children Study
This section provides some background to FACS, including the main aims of the
study and detail of the survey methods – sample design, data collection and
cross-sectional and longitudinal response rates.
1.1.1
1.1.1
1.1.1
1.1.1
1.1.1
Objectives of the study
Objectives of the study
Objectives of the study
Objectives of the study
Objectives of the study
The main objectives of the FACS surveys are to provide information on:
• the effects of work incentive measures;
• the effects of policy on families’ living standards;
• changes in family circumstances over time.
Specifically to look at:
• the impact of benefits and tax credits in supporting families with young children;
• barriers to work, particularly for low income families, and measures to overcome
such barriers; and
• general family welfare issues.
Throughout the study the focus of the surveys has widened to take into account new
or modified Government policies. These new policies include the long-term targets
to eradicate child poverty by 2020 and to reduce child poverty by half by 2010, as
well as objectives to increase the proportion of households (particularly lone
parents) in paid work. The study provides data on employment-related behaviour of
parents and also on outcomes for children – such as educational attainment, health
and behaviour.
1.1.2
1.1.2
1.1.2
1.1.2
1.1.2
Sample design
Sample design
Sample design
Sample design
Sample design
FACS began in 1999 and annual surveys are currently planned until at least 2006.
The dual objectives of the initial sample design were to provide a representative
sample of Britain’s low-income families, while at the same time generating a sample
of sufficient size for a longitudinal study
4. Child Benefit (ChB) records were used as
the sampling frame for the initial sample.
Sampling procedures for later years of the study were based on the previous year’s
outcomes. Generally, interviews are sought at each wave with cases that were
productive at the previous wave, and with those respondents that had given
permission to be re-contacted. Each year the longitudinal sample is refreshed with a
booster sample of new families in order to ensure it is representative of all families.
The booster sample is made up of ‘new’ families due to the birth of a baby, and
‘in-movers’ – families new to the sample areas.
9
9
9
9
9
In 2001, the sample was expanded to include all families with children, regardless of
income level. FACS, therefore, is now a survey of all families with dependent
children. Full details of the sampling procedures can be found in the series of FACS
technical reports (Woodland and Collins, 2001; Woodland and Woodward, 2002;
Woodward et al., 2003, Phillips et al., 2003 and Lyon et al., 2005).
1.1.3
1.1.3
1.1.3
1.1.3
1.1.3
Defining families with childr
Defining families with childr
Defining families with childr
Defining families with childr
Defining families with children – units of inter
en – units of inter
en – units of inter
en – units of inter
en – units of interest
est
est
est
est
The FACS sample is a named respondent sample with names and addresses selected
at random from ChB records. Because the aim of FACS is to collect information on
families with children, the named respondent acts as the main means of making
contact with the family and for collecting information on the various aspects of
family life. To ensure the circumstances of families with children are fully captured,
the study is designed to collect various types of information on the family as a whole,
and separately for the main respondent (usually the family’s ‘mother figure’ – the
person with the main responsibility for looking after the children in the family), the
partner (if present) and any dependent children. A definition of each of these units
of interest is provided below.
The family unit
In FACS, the family unit must comprise at least one dependent child (see definition
of dependent child below) and at least one adult who is responsible for this child.
The adult responsible for the child can be the child’s natural or adoptive parent, or
the legal guardian(s) to whom ChB is paid. The definitions used in FACS means that
families cannot span more than two generations, so, for example, grandparents and
grandchildren living together are not
not
not
not
not considered to belong to the same family.
However, the exception to this is where the grandparents are responsible for looking
after the grandchildren; where the parents are not part of the family unit.
The main respondent/‘mother figure’
In FACS, information about the family is collected principally from one family
member – usually the mother or the ‘mother figure’. Often the main respondent is
the natural or adoptive mother of the dependent child(ren) who lives with her.
However, in some cases she could be the cohabiting partner of the child(ren)’s
natural or adoptive father, a grandmother or other female guardian. The intention is
for father figures to be interviewed as the main respondent only in cases where there
is no female mother figure present in the family. In the 2004 study, only two per cent
of main respondents were men (131 cases), the majority of whom (66 per cent) were
lone fathers.
For ease of interpretation the term mother is used to refer to the main respondent in
this report. This term is used to relate to the ‘mother figure’ in the family, and
therefore refers to lone fathers in lone parent families headed by a male (unless
otherwise specifically stated).
10
10
10
10
10
The partner respondent
The partner respondent is the main respondent’s resident husband (or wife) or
cohabitee of the opposite sex. Same-sex couples are treated as two separate families
(because they are treated as two ‘benefit units’ in the social security system). The
children would be allocated to the adult deemed to have main responsibility for
them.
Dependent child
A dependent child is defined as any resident child aged 16 or under, or aged 17 or 18
and in full-time education. The definition of ‘in full-time education’ used in FACS is
made with reference to the end of the academic year (ending the first Tuesday in
September). Thus, a 17 or 18 year old child who had been in full-time education
during the ‘current academic year’ was counted as being a dependent child, even if,
at the time of interview, they had finished their course of study.
1.1.4
1.1.4
1.1.4
1.1.4
1.1.4
Data collection
Data collection
Data collection
Data collection
Data collection
The FACS surveys were carried out via a face-to-face interview with the mother and
the partner (where available). The interview for 2004 was broadly similar to previous
waves, with the exception of a new section of the interview on the New Tax Credits
(NTC) renewal process and the option of conducting the partner interview over the
phone.
The structure of the interview was as follows:
• a one hour Computer Assisted Personal Interview (CAPI) with the mother;
• for couple families – a 15 minute CAPI interview with the partner face-to-face or
over the phone (if the partner is not present, a short proxy-partner interview
with the mother is carried out);
• a self-completion questionnaire to be completed by any dependent children
aged 11 to 15 in the family.
Mother’s interview
In 2004 the main themes covered in the mother’s interview were:
• information about the family unit:
– family composition;
– relationship histories;
– contact with non-resident parents;
– housing;
– receipt of other social security benefits;
– receipt and the renewal process of NTCs (Working Tax Credit (WTC) and Child
Tax Credit (CTC));
Introduction
Introduction
Introduction
11
11
11
11
11
– other income and savings;
– expenditure and hardship.
• information about the main respondent herself:
– education and training;
– health;
– caring responsibilities;
– employment and self-employment;
– work history;
– unemployment and job search.
• information about each specific dependent child:
– health;
– school and education;
– problems and use of local services;
– parental aspirations for children;
– childcare arrangements.
Partner’s interview
For couple families, a short interview was carried out with the partner. The partner
interview included information on:
• education and training;
• health;
• employment and self-employment;
• earnings;
• unemployment and job search; and
• caring responsibilities.
In cases where the partner interview was not completed with the partner, a proxy
interview was carried out with the mother. This was to minimise the risk of having no
data about the partner. The proxy-partner interview collected information on:
• current or recent work status;
• earnings;
• industrial and occupational classification data; and
• qualifications.
12
12
12
12
12
Having collected this proxy information the intention, where possible, was for the
interviewer to return to the family at a later date to conduct an interview with the
partner.
Child self-completion questionnaire
All children aged 11 to 15 in the family were invited to complete a short
self-completion questionnaire. The age band was chosen to ensure the widest possible
age group for whom the questions would be appropriate. The survey covered issues
of activities in spare time, school life, and opinions about the local neighbourhood
and the family.
1.1.5
1.1.5
1.1.5
1.1.5
1.1.5
Response rates in 2004
Response rates in 2004
Response rates in 2004
Response rates in 2004
Response rates in 2004
The initial sample selected for the 2004 wave of FACS consisted of 9,179 families.
The overall yield of interviews from these eligible addresses was 7,471 – giving a
response rate of 81 per cent. The analysis in this report does not use all 7,471 families
who provided a productive interview in the 2004 wave of the FACS survey. The
information from the interview revealed that some of the sample was no longer a
family eligible to be included in this report – the family no longer contained
dependent children because the child(ren) had aged or moved out of the family
between sampling and fieldwork. Consequently, 6,940 respondents satisfied the
definition of a ‘family with dependent children’ to be used in the cross-sectional
analysis for this report (Table 1.1). From these families, 12,727 dependent children
were identified and used in the analysis for this report.
Interviews were conducted with two distinct types of family – lone parents and
couples. In summary, approximately three in ten interviews (28 per cent) were with
lone parent families, and the remainder (72 per cent) with couples. A full interview
was conducted with both partners in almost two-thirds (64 per cent) of all couple
families interviewed. A proxy partner interview was conducted for 35 per cent of
couple families interviewed, which meant that less than one per cent of couple
families failed to provide any information about the partner (other than that
collected in the household grid) (Table 1.1). Although the majority of analysis in this
report relates to the family, because the proxy partner interview was substantially
shorter than the main interview, most of the information about parents focuses on
the mother. The response rate for the child self-completion was 91 per cent, with
3,092 questionnaires being returned. For further information on response rates in
FACS 2004, see Lyon et al., (2005).
Introduction
Introduction
Introduction
13
13
13
13
13
Introduction
Introduction
Introduction
Introduction
Introduction
T
TT
TTable 1.1
able 1.1
able 1.1
able 1.1
able 1.1
Pr
Productive interviews for families used in the F
Pr
Pr
Pr
oductive interviews for families used in the F
oductive interviews for families used in the F
oductive interviews for families used in the F
oductive interviews for families used in the FACS 2004
ACS 2004
ACS 2004
ACS 2004
ACS 2004
Annual Report
Annual Report
Annual Report
Annual Report
Annual Report
Fr Fr Fr Fr
Frequencyequencyequencyequencyequency Per centPer centPer centPer centPer cent
(unweighted)
(unweighted)(unweighted)
(unweighted)
(unweighted) (unweighted)(unweighted)(unweighted)(unweighted)(unweighted)
All families
Lone parent 1,941 28
Couple 4,999 72
Total 6,940 100
Lone parent
Lone mother 1,855 96
Lone father 86 4
Total 1,941 100
Couple
Main respondent
Female 4,954 99
Male 45 1
Total 4,999 100
Partner respondent
Female 45 1
Male 4,954 99
Total 5,197 100
Partner interview
Full 3,211 64
Proxy 1,771 35
Missing 17 <1
Total 4,999 100
1.1.6
1.1.6
1.1.6
1.1.6
1.1.6
Non-r
Non-r
Non-r
Non-r
Non-response and weighting
esponse and weighting
esponse and weighting
esponse and weighting
esponse and weighting
A comparison of FACS respondents with records from the ChB population showed
that certain families were (albeit only slightly) more likely to appear in FACS – most
notably those with younger parents and lone parents (Phillips et al., 2003).
Consequently a number of weights are included on the FACS dataset to aid analysis
at both a cross-sectional and longitudinal level.
Non-response and weighting in 2004
A weight was developed to ensure that the sample, when analysed as a
cross-section, has characteristics very close to those of the population of all families with
children. In FACS 2004, five separate pieces of information were used in the
weighting procedure:
14
14
14
14
14
• proportion of lone parents;
• number/proportion of NTC recipients.
As recommended in the documentation supplied with the FACS data, this weight is
used for conducting the cross-sectional analysis presented in this report
5.
1.2
The content of the report
The report comprises 15 substantive chapters of tables, nine chapters contain tables
about a wide range of family circumstances (including health, income, childcare and
work), while a further six contain tables on a different theme about children,
including schooling, health, child activities and childcare. Each chapter summarises
the key findings from core descriptive analysis of the 2004 FACS survey. The list of
chapters is as follows:
• Chapters about family life:
– Chapter 2
Chapter 2
Chapter 2
Chapter 2
Chapter 2 provides a description of the key socio-demographic and economic
characteristics of families with children in 2004. This chapter also introduces
the various groups used throughout the report to demonstrate how
circumstances can differ according to family characteristics. The purpose of
this chapter is to provide the context within which the more detailed findings
discussed in subsequent chapters can be placed.
– Chapter 3
Chapter 3
Chapter 3
Chapter 3
Chapter 3 looks at the health and well being of adults and children in the
family, including both long-term and limiting illnesses and disabilities.
– Chapter 4
Chapter 4
Chapter 4
Chapter 4
Chapter 4 reports on educational qualifications and in-work or work-related
training undertaken by adults in the family.
– Chapter 5
Chapter 5
Chapter 5
Chapter 5
Chapter 5 considers the employment status of adults in the family and focuses
on the type of work for those in employment, and issues of leaving and finding
work for those without a job.
– Chapter 6
Chapter 6
Chapter 6
Chapter 6
Chapter 6 uses a measure of total family income to report income across
family groups and differences in amounts and types of income received.
– Chapter 7
Chapter 7
Chapter 7
Chapter 7
Chapter 7 looks at receipt and awareness of NTCs, WTC and CTC. This chapter
also considers the range of benefits that families can claim, with a particular
focus on Income Support.
– Chapter 8
Chapter 8
Chapter 8
Chapter 8
Chapter 8 looks at whether families save and in what manner, both amount
and type of savings account held, as well as their financial management.
– Chapter 9
Chapter 9
Chapter 9
Chapter 9
Chapter 9 provides a description of the type of housing families live in, and
also looks at housing costs and state of repair.
– Chapter 10
Chapter 10
Chapter 10
Chapter 10
Chapter 10 explores material deprivation in terms of the family’s ability to
afford a range of items such as a telephone, new clothes and an annual holiday.
Introduction
Introduction
Introduction
Introduction
Introduction
5
For further information on the weighting procedure applied to analysis in this
15
15
15
15
15
• Chapters about children in the family:
– Chapter 11
Chapter 11
Chapter 11
Chapter 11
Chapter 11 provides a description of the key socio-demographic and economic
characteristics of children in 2003. This chapter also introduces the various
groups used throughout the report to demonstrate how circumstances can
differ according to child and family characteristics. The purpose of this chapter
is to provide the context within which the more detailed findings discussed in
subsequent chapters can be placed.
– Chapter 12
Chapter 12
Chapter 12
Chapter 12
Chapter 12 looks at the health and well being of children, including both
long-term and limiting illnesses and disabilities.
– Chapter 13
Chapter 13
Chapter 13
Chapter 13
Chapter 13 is the first of two consecutive chapters that consider child
outcomes. This chapter focuses on schooling in particular, including academic
performance, problems at school and parental aspirations.
– Chapter 14
Chapter 14
Chapter 14
Chapter 14
Chapter 14 reports on child behaviour. The analysis looks at the leisure activities
and social life of children. This chapter also includes the main bulk of analysis,
from the child self-completion questionnaire issued to 11 to 15 year old children
in FACS 2004. This chapter explores child behaviour through areas such as
physical activity, social life, work and parental control, as well as problems
with the police and experience of drugs, smoking and alcohol. We also look
more generally at children’s well being and how they feel about different
aspects of their lives.
– Chapter 15
Chapter 15
Chapter 15
Chapter 15
Chapter 15 looks at child maintenance, reporting frequency and amount of
payments, and explores contact between the non-resident partner and both
the mother figure and her children.
– Chapter 16
Chapter 16
Chapter 16
Chapter 16
Chapter 16 reports on childcare arrangements during both term-time and
school holidays, looking at type, amount and cost.
1.3
Guide to methods used in the tables
The tables reproduced in this report share a general pattern and their presentation
follows a number of general, often widely shared conventions. The majority of
tables use row percentages, presenting the percentage of a child or family
characteristic, by a particular mutually exclusive response – for example, the
percentage of children who had friends to visit according to the number of visits in
the last week. In these tables the percentages sum to 100. Some tables present
multiple responses (the respondent could choose a number of responses rather than
just one) and hence percentages will not sum to 100 – for example, the percentage
of children who suffer from a list of illnesses (where the child could have more than
one illness). Some tables present the profile of a particular outcome according to
child characteristics – for example, the percentage of children from lone-parent
families according to child or family characteristics – so use column rather than row
percentages. Tables do not necessarily contain just percentages; sometimes they
contain a measure of the average – for example, the median weekly costs of
childcare. These statistics are made clear in the appropriate tables.
16
16
16
16
16
<