(2008)
www.electrochemsci.org
Facile Method for the Construction of Random Nanoparticle
Arrays on a Carbon Support for the Development of
Well-defined Catalytic Surfaces
Ronan Baron, Fallyn W. Campbell, Ian Streeter, Lei Xiao and, Richard G. Compton*
Physical and Theoretical Chemistry Laboratory, University of Oxford, South Parks Road, Oxford, OX1 3QZ (UK).
*E-mail: [email protected]
Received: 5 February 2008 / Accepted: 1 March 2008 / Online published: 20 March 2008
A simple and easy way to construct platinum nanoparticle (PtNPs) arrays on a carbon matrix is presented and the catalytic properties of the developed materials are evidenced with electrochemical studies. Technically, the key point resides in being able to get metallic nanoparticles of homogeneous size that are well dispersed on a carbon substrate. Specific efforts in this direction led us, here, to obtain, for the first time, well-defined and well-spread PtNPs of 100 ± 40 nm on carbon microspheres. The resulting material was used for the development of a low cost practical Pt nanoelectrode array sensor for aqueous proton detection. In addition, methanol oxidation was studied to exemplify potential uses in fuel cells. The procedures described are very simple to apply and represent an original strategy for the development of well-defined catalytic surfaces.
Keywords: Nanoparticle Arrays; Nanoelectrodes ; Nanoelectrode Ensembles; Proton reduction, pH determination
1. INTRODUCTION
measurements in viscous media. The construction of nanoelectrodes generally involves procedures like chemical vapor deposition and photolithography [3], electron-beam lithography [4] or electroless deposition in polycarbonate membranes [5]. These methods allow, in general, the precise control of the nanoelectrode or nanoelectrode arrays geometry. However, they require specialized equipment that are relatively complex to implement (except for polycarbonate membranes[5]) and they are not adapted for the production of a large number of pieces. The production of low price nanoelectrodes and nanoelectrode arrays then remains a challenging issue. Another approach to the construction of nanoparticle arrays as catalytic surfaces is presented in this manuscript. Metallic nanoparticles are synthesized on a conductive carbon support to get a random nanoparticle array. The association of metallic nanoparticles to bulk carbon substrates is of particular interest. Indeed, carbon is highly conductive, relatively stable and cheap. Furthermore, it was reported that nanoparticles sometimes have higher catalytic properties than the corresponding bulk material [6]. The electroless deposition of metallic nanoparticles on glassy carbon microspheres was achieved recently [7-9]. However, poor control of the size and spreading of the nanoparticles was obtained. Specific efforts led us, here, to obtain, for the first time, well-defined and well-spread platinum nanoparticles (PtNPs) of 100 ± 40 nm on carbon microspheres. The catalytic properties of the resulting material were demonstrated by electrochemical studies. In some cases specific substrates are electroactive only at specific electrode materials. In the case where the metallic nanoparticles are electroactive towards the considered substrate but the carbon support is inactive, the nanoparticle array can be considered as a nanoelectrode array. The nanoparticle arrays were used for the development of a low cost practical Pt nanoelectrode array sensor for proton detection. In addition, methanol oxidation was studied to exemplify potential use in fuel cells. The procedures described are very simple to apply and represent an original strategy for the development of catalytic surfaces in general.
2. EXPERIMENTAL PART
2.1. Chemicals and Materials
Hydrochloric acid (37 wt. % solution in water) and methanol (99.99 %) were supplied from Riedel-de Häen. Potassium chloride (KCl, 99.5 %), L-ascorbic acid, hexachloroplatinate (H2PtCl6, 98 %) and sodium hydroxide (99.5 %) were obtained from Sigma-Aldrich and used without further purification. Glassy carbon spherical powder (10–20 microns, type 1) was purchased from Alfa Aesar (Heysham, UK). The deionised water used had a resistivity not less than 18.2 MΩ cm at 25 °C (Vivendi Water Systems, UK). As far as the KCl electrolyte solutions are concerned, their pH was brought to 7 ± 0.3 prior to HCl additions.
2.2. Electroless deposition of platinum nanoparticles on glassy carbon microspheres
hexachloroplatinate and 46 mg of L-ascorbic acid were added to the solution under vigorous stirring at 70 ºC. The pH of the reaction medium was then adjusted to 5.2 using a 1 M sodium hydroxide solution. The reaction flask was wrapped in aluminum foil and the reaction was allowed to proceed for two hours at 70 ºC under stirring.
2.3. Abrasive attachment of carbon microspheres
The abrasive attachment of glassy carbon microspheres on a basal plane pyrolytic graphite electrode was done by rubbing the electrode surface onto a thin layer of microspheres powder laying on a filter paper. The excess of non attached microspheres on the electrode surface is then removed by the process of rubbing the electrode in a wet cotton cloth. The electrode surface can be renewed before modification by pressing cellotape on the electrode surface and removing it along with several surface layers of graphite.
2.4. Instrumentation
The electrochemical cell was a standard three electrode cell. Except when specified otherwise, the reference electrode was an aqueous saturated calomel electrode (Radiometer Analytical) and the auxiliary electrode was a carbon graphite rod. The working macrodisc electrode was a 5 mm diameter basal plane pyrolytic graphite electrode (BPPG, Le Carbone Ltd, Sussex, UK). All experiments were performed at room temperature under an argon atmosphere. The electrochemical investigations were performed using an Eco Chemie PGSTAT20potentiostat connected to a computer. Scanning electron microscopy (SEM) imaging of the decorated carbon microspheres was carried out using a JEOL JSM model 6300F scanning electron microscope.
2.5. Modelling
The model used in this paper for simulating the peak currents obtained at random nanoparticle arrays or macroparticle arrays was described and discussed in detail in a previous work [10]. The model considers the electron transfer to occur at the surface of a spherical particle supported by an electro-inactive planar surface. The mass transport equation for the electroactive species is solved by finite difference methods. The diffusion domain approximation [11] is used to model a randomly distributed array of the spheres on the electrode surface. It is assumed that the electron transfer is fast and reversible and that both the reactant and product of the electron transfer are soluble and have equal diffusion coefficients. We note the limitations of these assumptions in describing the mechanism of the reduction of protons on platinum; however the variation of peak current with particle coverage is likely to be predicted to a good approximation.
2.6. Limit of detection
Diffusion coefficients: The diffusion coefficients for the proton and the ferrocyanide ions that were used for the simulations and for the Randles-Šev ík plots were respectively 7.9 × 10⁻⁵ cm2 s-1 and 0.76 × 10⁻⁵ cm2 s-1 [12,13].
3. RESULTS AND DISCUSSION
3.1. Preparation and characterization of PtNPs arrays
A new method for the synthesis of Pt nanoparticles on glassy carbon microspheres was developed using ascorbic acid as the reducing agent. The method is very simple and easy to perform (see experimental section). The glassy carbon microspheres with a diameter of 15 ± 5 µm (Fig. 1(A)) were used as the carbon support. From the SEM images of the PtNPs obtained (Fig. 1(B) and Fig. 1(C)) it can be observed that most of the PtNPs have a diameter of 100 ± 40 nm and that they are relatively well spread on the surface of the carbon microspheres with an interparticle distance of about 0 to 220 nm. Furthermore the nature of the PtNPs was confirmed by Energy Dispersive X-ray Analysis (EDX).
Figure 1. SEM images of (A) non-modified glassy carbon microspheres (CMs), (B) and (C) platinum nanoparticles on glassy carbon microspheres (PtNPs-CMs).
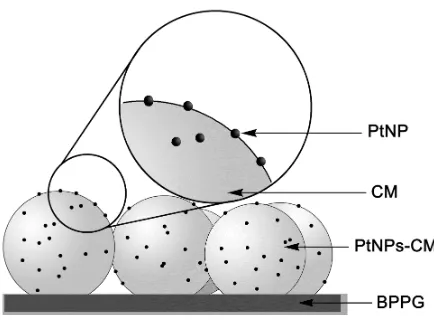
[image:4.612.197.414.532.692.2]Glassy carbon microspheres can be abrasively attached to a basal plane pyrolytic graphite electrode surface by a very quick, simple and easy procedure [8]. Indeed, it takes a few minutes to get a nanoparticle array and it is expected that the method does not produce agglomerates of nanoparticles. A schematic representation of the electrode architecture obtained is presented in Scheme 1.
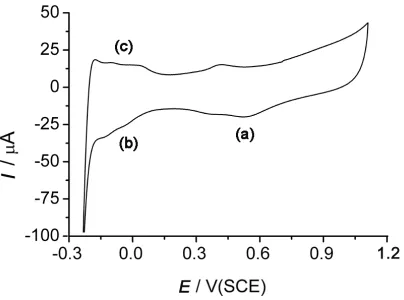
Figure 2. Cyclic voltammetry of a 5 mm diameter platinum nanoparticle array in 0.5 M H2SO4 at 100 mV s-1.
The modified electrode consisting in a platinum nanoparticle array on a carbon matrix was used in all the following studies presented in this work. Fig. 2 corresponds to a cyclic voltammetry experiment run in 0.5 M H2SO4 at the modified electrode obtained by the above described procedure. The voltammogram obtained presents the characteristic features of platinum material electrodes. Indeed, in the course of a voltammetric scan an oxidation is observed, and in the backward scan the peaks observed at about 0.5 V (a) and −0.1 versus SCE (b) respectively correspond to the reduction of platinum oxides and the adsorption of hydrogen. Moreover, the peak (c) observed after reversing the scan direction once again is characteristic of the hydrogen desorption. From the voltammogram of Fig. 2, it can then be concluded that the Pt particles are present on the electrode surface and that they are electrically connected to the electrode. Furthermore, the integration of the hydrogen adsorption peaks could be used to estimate the total surface coverage of the platinum [14]. Using this method and a value of 208 µC cm−2, a total surface area of 0.123 cm2 was estimated for the modified electrode used in Fig. 2. It is worth emphasizing that for this experiment a platinum wire was used as the reference electrode instead of the SCE so as to avoid the transfer of chloride ions in the electrolyte. Once the cyclic voltammogram was recorded a further recording was made using the SCE electrode so as to get the peak potentials versus SCE. Such precautions have to be taken so as to get a viable estimation of the platinum surface from the integration of the peaks that correspond the hydrogen adsorption [14].
3.2. Cyclic voltammetry at PtNPs arrays
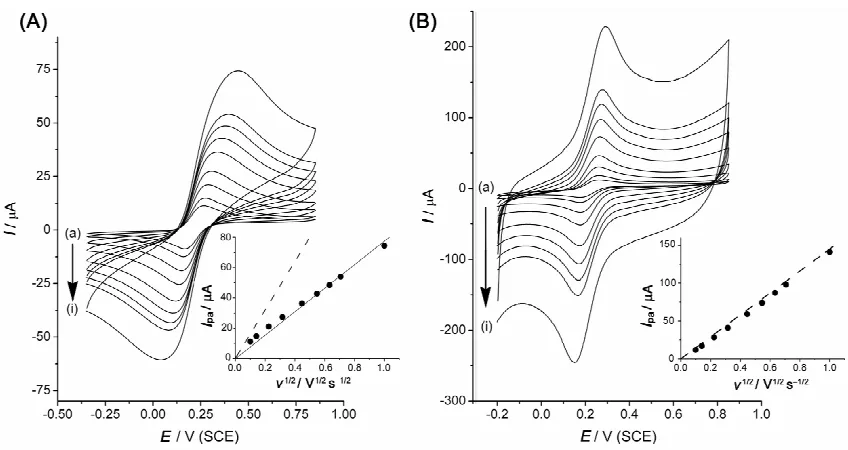
[image:5.612.205.407.147.297.2]behaviour both at a non-modified basal plane pyrolytic electrode (BPPG) electrode (Fig. 3(A)) and at a BPPG modified with PtNPs (Fig. 3(B)). A closer look, however, shows that the peak to peak separation at 100 mV s−1 is 0.180 and 0.085 V respectively at the non-modified and at the modified BPPG. The large value obtained at the non-modified BPPG electrode has been recently attributed to the decrease of the electron transfer kinetics due to the oxygenation of the edge plane sites [15]. It is interesting to see, here, that the immobilisation of platinum nanoparticles on glassy carbon microspheres (PtNPs-CMs) on the BPPG electrode surface restores fast electron transfer kinetics. In that case the measured current corresponds to the addition of the current obtained at the PtNPs-CMs and of the current obtained at the BPPG surface. The plots of the peak current versus square root of the scan rate (Insets Fig. 3) show that at the modified BPPG electrode the current almost matches with the current calculated using the Randles-Šev ík formula. It then can be said that the BPPG electrodes modified with PtNPs-CMs behave as macrodisc electrodes in voltammetry.
Figure 3. Cyclic voltammetry of 1 mM potassium ferrocyanide and 0.1 M KCl, (A) at a 5 mm diameter BPPG electrode (B) at a 5 mm diameter BPPG electrode modified with glassy carbon microspheres decorated with platinum nanoparticles (PtNPs-CMs) (total PtNPs loading of 0.100 cm2). The voltammograms were recorded at (a) 10, (b) 20, (c) 50, (d) 100, (e) 200, (f) 300, (g) 400, (h) 500 and (i) 1000 mV s-1. Insets: plot of Ipa versus v½. Dashed line: expected plot using the Randles-Šev ík formula.
3.3. Proton reduction at PtNPs arrays
[image:6.612.96.520.270.495.2]per proton (H+), the neutral hydrogen atom is adsorbed (H
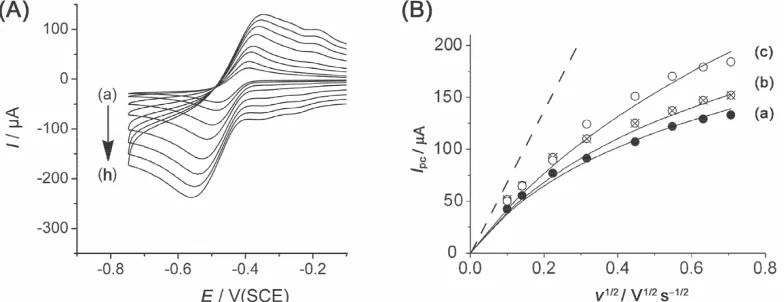
ad) on the platinum surface. The plot of the peak current versus the square root of the scan rate for three different PtNPs loadings is given Fig. 4(B). The lower the density of PtNPs is, the more the plot deviates further from the Randles-Šev ík calculated line.
Figure 4. (A) Cyclic voltammetry at a 5 mm diameter platinum nanoparticle array (total PtNPs loading of 0.123 cm2) in 1 mM HCl and 0.1 M KCl at (a) 10, (b) 20, (c) 50, (d) 100, (e) 200, (f) 300, (g) 400, (h) 500 mV s-1. (B) Plot of Ipc versus v½ for various total platinum loadings (a), 0.123 (b) 0.186 and (c) 0.196 cm2; the points and the curves correspond respectively to the experimental and the modelled peak currents. Dashed line: expected plot using the Randles-Šev ík formula.
[image:7.612.112.504.149.300.2]of microspheres immobilized on the whole electrode surface was estimated to be respectively 2900, 3289 and 4621.
[image:8.612.125.491.343.654.2]Scheme 2. Schematic representation of the diffusion zones at spherical nanoparticles (PtNPs diameter distance between PtNPs) on microspheres (CMs diameter << distance between CMs) on a supporting planar surface.
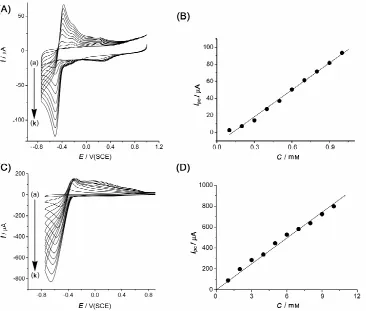
The use of the BPPG electrode modified with PtNPs-CMs for the accurate determination of the pH was then explored. Fig. 5(A) and Fig. 5(C) show the voltammetric response obtained at 100 mV s−1, respectively, for 0.1 and 1 mM additions; and the corresponding calibration curves are presented, respectively, in Fig. 5(B) and Fig. 5(D). A sensitivity of 0.46 mA mol−1 cm and a detection limit of 200
µM were obtained. The peak current increases linearly for concentrations between 0.1 mM and 10 mM. It is then possible, using this method, to get precise pH measurements within the range pH = 1−3.
3.4. Methanol oxidation at PtNPs arrays
[image:9.612.199.417.359.520.2]A further study involved the use of the PtNPs arrays for methanol oxidation in alkaline solution to exemplify their potential use in fuel cells. The cyclic voltammograms obtained are presented Fig. 6. At a non-modified BPPG electrode or at a BPPG electrode modified with CMs, and in the range of potentials considered, no oxidation current was observed. However at a BPPG electrode modified with PtNPs-CMs a large oxidation peak was recorded. It was shown, however, that the electrode gets poisoned very quickly (less than half of the current remained after two cycles). This observation is in good agreement with previous methanol oxidation studies at PtNPs [18].
Figure 6. Cyclic voltammetry at a 5 mm diameter platinum nanoparticle array (total PtNPs loading of 0.340 cm2) at 5 mV s-1 in 1 M KOH and methanol (a) 0.5 M, (b) 1 M (1st cycle) and (c) 1 M (2nd cycle).
4. CONCLUSIONS
of the modified microspheres is a very quick and efficient way to obtain platinum nanoparticle arrays. Moreover, it is believed that the method presented can be generalized to nanoelectrode arrays of other metals provided that the synthesis of metallic nanoparticles on carbon microspheres is obtained. In addition, the electrode architecture presented was found to have excellent characteristics as for the sensing of protons and might be used as an original strategy for the precise determination of pH for values between 1 and 3.
ACKNOWLEDGEMENTS
The authors thank the EPSRC for financial support. F.W.C. thanks Abington Partners for partial funding of her Ph.D. studentship.
References
1. a) A. N. Shipway, E. Katz, I. Willner, ChemPhysChem, 1 (2000) 18. b) A. Haryono, W. H. Binder, Small, 2 (2006) 600. c) S. Yoo II, J.-H. Kwon, B.-H. Sohn, J. Mater. Chem., 17 (2007) 2969. 2. D. W. M. Arrigan, Analyst, 129 (2004) 1157.
3. M. P. Nagale, I. Fritsch, Anal. Chem., 70 (1998) 2902. 4. M. E. Sandison, J. M. Cooper, Lab Chip, 6 (2006) 1020.
5. P. Ugo, N. Pepe, L. M. Moretto, M. Battagliarin, J. Electroanal. Chem., 560 (2003) 51. 6. C. M. Welch, R. G. Compton, Anal. Bioanal. Chem., 384 (2006) 601.
7. a) X. Dai, G. G. Wildgoose, C. Salter, A. Crossley, R .G. Compton, Anal. Chem., 78 (2006) 6102. b) X. Dai, G. G. Wildgoose, R. G. Compton, Analyst, 131 (2006) 1241.
8. a) B. Šljuki , R. Baron, C. Salter, A. Crossley, R.G. Compton, Anal. Chim. Acta, 590 (2007) 67. b) R. Baron, B. Šljuki , C. Salter, A. Crossley, R.G. Compton, Electroanalysis, 19 (2007) 1062. c) R. Baron, B. Šljuki , C. Salter, A. Crossley, R.G. Compton, Russ. J. Phys. Chem., 81 (2007) 1443. d) L.E. Barrosse-Antle, L. Xiao, G.G. Wildgoose, R. Baron, C.G. Salter, A. Crossley, R.G. Compton, New J. Chem., 31 (2007) 2071.
9. a) C. Xu, L. Cheng, P. Shen, Y. Liu, Electrochem. commun., 9 (2007) 997. b) C. Xu, Y. Liu, D. Yuan, Int. J. Electrochem. Sci., 2 (2007) 674.
10. I. Streeter, R. Baron, R. G. Compton, J. Phys. Chem. C, 111 (2007) 17008.
11. a) H. Reller, E. Kirowa-Eisna, E. Gileadi, E., J. Electroanal. Chem., 138 (1982) 6577. b) B. A. Brookes, T. J. Davies, A. C. Fisher, R. G. Evans, S. J. Wilkins, K. Yunus, J. D. Wadhawan, R. G. Compton, J. Phys. Chem. B, 107 (2003) 1616.
12. a) J.V. Macpherson, P.R. Unwin, Anal. Chem., 69 (1997) 2063. b) S. Daniele, I. Lavagnini, M.A. Baldo, F. Magno, J. Electroanal. Chem., 404 (1996) 105.
13. A. J. Bard, L. R. Faulkner, in Electrochemical Methods, 2nd ed., Wiley-VCH, New York (2001). 14. J. M. Dona Rodrigues, J. A. Herrera Melian, J. Perez Pena, J. Chem. Educ., 77 (2000) 1195. 15. X. Ji, C. E. Banks, A. Crossley, R. G. Compton, ChemPhysChem, 7 (2006) 1337.
16. I. Streeter, R. G. Compton, J. Phys. Chem. C., 111 (2007) 17008.
17. a) T. J. Davies, C. E. Banks, R. G. Compton, J. Solid State Electrochem., 9 (2005) 797. b) T. J. Davies, R. G. Compton, J. Electroanal. Chem., 585 (2005) 63.
18. B. Beden, F. Hahn, S. Juanto, C. Lamy, J.-M. Leger, J. Electroanal. Chem., 225 (1987) 215.