Int. J. Electrochem. Sci., 3 (2008) 854 - 872
International Journal of
ELECTROCHEMICAL
SCIENCE
www.electrochemsci.orgSolute-Solvent Interactions in Biological Molecules: L-Cysteine
C. V. Krishnan1,2*, M. Garnett1, and B. Chu2
1
Garnett McKeen Lab, Inc., 7 Shirley Street, Bohemia, NY 11716-1735, USA
2
Department of Chemistry, Stony Brook University, Stony Brook, NY11794-3400, USA
*
E-mail: ckrishnan@notes.cc.sunysb.edu
Received: 3 June 2008 / Accepted: 7 June 2008 / Online Published: 30 June 2008
The cyclic voltammetric behavior of L-cysteine at different pH values in the absence and presence of ions such as chloride from hydrochloric acid or sodium chloride, bromide from sodium bromide, and phosphate from the buffer made from potassium dihydrogen phosphate and sodium hydroxide have been investigated. In the active region, the cathodic current depended on the starting potential as well as the L-cysteine concentration. Also if the starting potential was more anodic, the cathodic and anodic active regions extended much more into both cathodic and anodic regions. While scans 2 and 3 gave nearly the same current, scan 1 always gave higher cathodic current especially in the presence of counter-ions. With the scanning potential starting at 0.0 V, cathodic current oscillations were observed in the presence of counter-ions and high concentrations of L-cysteine. Admittance data in the absence as well as the presence of counter-ions indicated a competing influence of orientational effects of water with decreasing frequencies, indicating a characteristic of the self-assembly behavior. In the absence of ions, admittance increased continuously from 1000 Hz to 10 Hz. In the presence of counter-ions this trend changed the direction at different frequencies, depending on the concentration of the counter-ion. The admittance data indicated strong interactions between α-COO- and α-NH3+ groups of
L-cysteine. Impedance data indicated oscillations at high frequencies. Capacitance data suggested the presence of two species in the absence and the presence of 5 mM NaCl or 5 mM NaBr but not in 0.1 M HCl or 0.059 M phosphate buffer. Cyclic voltammetry and admittance data suggested the need to investigate the electrochemical behaviour of molecules without any background electrolytes, whenever possible, in order to gain information on solute-solvent interactions near the double layer. This finding is contrary to the accepted practice in electrochemistry.
Keywords: L-cysteine, Cyclic Voltammetry, Current Oscillation, Admittance, Self-assembly, Solute-Solvent Interaction
1. INTRODUCTION
cysteine is an important structural and functional component of many proteins and enzymes due to the facile oxidation of its thiol side chain to form disulfide linkages. An important antioxidant, glutathione, is biosynthesized from cysteine, glycine and glutamic acid.
The pK1(α-COOH), pK2( thiol or sulfhydryl) and pK3(α-NH3+) values of L-cysteine are 1.92,
8.37 and 10.70 respectively [3]. At the zwitterionic pH value of 5.02, there is no net charge on the molecule. At pH below and above 5.02, the molecule possesses predominantly cationic and anionic properties, respectively. At higher pH values, the sulfhydryl group is also ionized and possesses a negative charge. Thus, the double layer behavior of this molecule should depend on concentration, pH, counter-ions and the applied potential.
L-cysteine has also been evaluated as a corrosion inhibitor for copper in neutral and acidic chloride solutions [4, 5]. The electrochemistry of L-cysteine on different electrodes, such as mercury, gold, platinum, vitreous carbon, and paraffin-wax impregnated spectroscopic graphite electrode (WISGE), has been investigated in great detail [6-19]. Cysteinate complex formation and cysteine adsorption have been observed on mercury and solid electrodes, respectively. Since hydrochloric acid is also the favored electrolyte for the electrosynthesis of cysteine from cystine, it will be beneficial to fully characterize the interaction between these molecules and chloride.
We reported earlier that a background electrolyte, such as sodium chloride, has a profound influence on the impedance behavior of biological molecules, such as collagen and prothrombin [1, 2]. We also reported that impedance measurements could be used as a tool to explore the self-assembly
process of large Keplerate type molybdenum clusters of
(NH4)42[MoVI72MoV60O372(CH3COO)30(H2O)72]·ca.300H2O·ca.10CH3COONH4) [20]. Sodium
molybdate, in the presence of cysteine hydrochloride acting as an educt and reducing agent, could react at low pH value of ~ 1.5 to produce a nanosized ring-shaped cluster of Na3[Mo154O462H14(H2O)48(HO2C-(NH3+)HC-CH2-S-S-CH2-CH(NH3+)-COO-)11].x H2O (x ≈ 250) [21].
This interesting structure has multiphilic ligands, such as -NH3 +
, CO2
-, CO2H and –S-S-, attached to
the inner wall of the cluster through a carboxylate group. As a prelude to the electrochemical investigation of the self-assembly process of this cluster, we wanted to investigate the L-cysteine and molybdate-L-cysteine at different pH values. Cyclic voltammetry and impedance data for L-cysteine in the absence and presence of counter-ions, such as chloride at different pH, bromide at pH 5.15 and phosphate from buffer at pH 7.03, are reported here.
2. EXPERIMENTAL PART
7.23 containing 0.059 M KH2PO4 and 0.041 M NaOH. The solutions were purged with N2 for about
10 minutes before the experiment. Admittance measurements were carried out using about 7 mL solutions in the frequency range 1000 Hz to 10 mHz. The amplitude of the sinusoidal perturbation signal was 10 mV.
3. RESULTS AND DISCUSSION
3.1 Cyclic Voltammetry
3.1.1. Cyclic voltammetry of L-cysteine without any background electrolyte
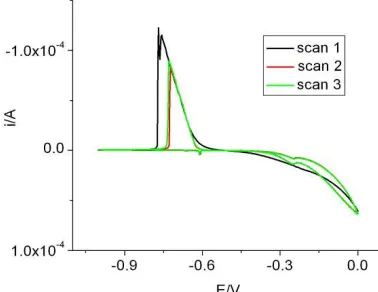
The measurements were made at a high concentration of 0.1 M aqueous solutions of L-cysteine, starting at different anodic potentials and at different scan rates. The results are shown in Figure 1. It is interesting to note that the general behavior was nearly the same even when the starting potential was +0.3 V, a region where passivation of mercury was likely to occur. However the cathodic current increased and also extended far more cathodic with an increase in the starting point of the anodic potential (Figure 1a). For the same starting anodic potential, the current was not too much different for all the three scans, even though there was a general trend for a slight increase in current for scan1 (Figure 1b). Figure 2a gives the influence of scan rate on the cathodic and anodic currents. As expected, the higher the scan rate, the higher the cathodic and anodic currents. Also the region of activity extended more into both cathodic and anodic regions with increasing scan rate.
[image:3.612.304.497.445.606.2]
Figure 1a. Cyclic voltammetry of 0.1 M Figure 1b. Cyclic voltammetry of 0.1 M L-cysteine, pH 5.17, scan 3, scan rate 100 mV/s, L-cysteine, pH 5.17, A) 0.0 to -1.0 V, no background electrolyte B) -0.3 to -1.0 V, scan rate100 mV/s,
[image:3.612.77.273.456.606.2]
Figure 2a. Cyclic voltammetry of 0.1 M Figure 2b. Cyclic voltammetry of 0.1 M L-cysteine, pH 5.17, scan 3, different L-cysteine in 5 mM NaCl (pH 5.26) or 5 mM scan rates, no background electrolyte NaBr (pH 5.15), scan 1,2,3, scan rate 100 mV/s
3.1.2. Cyclic voltammetry of L-cysteine in the presence of NaCl or NaBr as background electrolyte
The cyclic voltammetric data for 0.1 M L-cysteine in the presence of 5 mM NaCl or 5 mM NaBr are shown in Figure 2b for the first 3 scans starting at 0.0 V and scanning to -1.0 V and back to 0.0 V. In the presence of these electrolytes, the cathodic current was much higher for scan 1 than the similar currents observed for scans 2 and 3. There was also a significant difference in behavior for cathodic scan 1 from that of scans 2 and 3. An additional cathodic current spike was observed for both NaCl and NaBr during the first scan. Also the cathodic current was slightly higher in the presence of NaBr than for NaCl.
Figure 3a. Cyclic voltammetry of 0.1 M Figure 3b. Cyclic voltammetry of 0.1 M L-cysteine in 5 mM NaCl, pH 5.26, scan from L-cysteine in 5 mM NaBr, pH 5.15, scan
[image:4.612.77.275.90.243.2] [image:4.612.304.503.476.641.2]
Figure 3 gives the data for L-cysteine in the presence of 5 mM NaCl or NaBr where the starting potential was more negative than that shown in Figure 2b. The additional cathodic current spike observed in Figure 2b was absent here. However the cathodic current for scan 1 was still higher than for scans 2 or 3 as observed earlier in Figure 2b. A comparison of Figure 3a and Figure 3b indicated that the current spike was comparatively higher in the presence of NaBr than in NaCl. In both cases, a shoulder was observed instead of the cathodic current spike.
[image:5.612.300.500.335.492.2]Figure 4a gives a comparative behavior of the influence of NaCl on the cyclic voltammogram of L-cysteine. For the sake of clarity of the figure, the current for L-cysteine was multiplied by a factor of 10. Also since scans 2 and 3 had somewhat similar behavior, scan 2 was omitted from the figure. The data clearly indicated that in the absence of any electrolyte, the cathodic active region was extended more cathodic and the anodic region more anodic. There are only subtle differences between the 5 mM and 0.1 M NaCl data. The cathodic current spike was much higher in intensity with 0.1 M NaCl compared to that of 5 mM NaCl. When the starting potential was changed to -0.3 V for 0.1 M L-cysteine in 0.1 M NaCl, a cathodic shoulder was observed instead of the cathodic current spike (Figure 4b).
Figure 4a. Cyclic voltammetry of 0.1 M Figure 4b. Cyclic voltammetry of 0.1 M L-cysteine in the presence of A, 0.0 M, L-cysteine in 0.1 M NaCl, pH 5.18, scan
B, 5 mM and C, 0.1 M NaCl. Scan from from -0.3 to -1.0 V and back. Scan rate 100 mV/s 0.0 to -1.0 V and back. Scan rate 100 mV/s
3.1.3. Cyclic voltammetry of L-cysteine in the presence of phosphate buffer as background electrolyte
We included phosphate buffer in our investigations in order to have some comparison of our data with that in the literature [12]. However, the mixture of anions in the phoshpate buffer, viz. H2PO4-, HPO42- and to a very limited extent PO43-, involved in ionic interactions compared to a
spherical Cl- or Br- made the interpretation more difficult.
[image:5.612.73.268.336.491.2][image:6.612.305.505.142.292.2]
when the scans were starting at –0.3, -0.4 and –0.5 V. Figure 5b shows both cathodic and anodic current spikes when the starting potential was more cathodic than 0.0 V.
Figure 5a. Cyclic voltammetry of 0.1 M Figure 5b. Cyclic voltammetry of 0.1 M L-cysteine in phosphate buffer, pH 7.03, L-cysteine in phosphate buffer, pH 7.03, scan 3, scan rate100 mV/s; expanded scale from 5a, scan3, scan rate
100 mV/s
The cathodic current oscillations were observed for all the 3 scans when the starting potential was 0.0 V (Figure 6a). Also the current was much higher for scan 1 compared to scans 2 and 3 that had similar currents. Figure 6b shows cyclic voltammetric data for 0.5 mM L-cysteine in phosphate buffer, a concentration comparable to that in the literature. These data had no cathodic current oscillations and the currents were nearly the same for all the three scans. Both cathodic and anodic current spikes were observed even in this dilute solution and were in agreement with literature data [12].
[image:6.612.75.267.512.661.2] [image:6.612.304.501.513.660.2]
3.1.4. Cyclic voltammetry of L-cysteine in the presence of added HCl or NaOH at different pH
[image:7.612.76.498.132.346.2]The cyclic voltammetric behavior of 0.1 M L-cysteine in the presence of 0.1 M, 0.05 M and 0.005
Figure 7a. Cyclic voltammetry of 0.1 M Figure 7b. Cyclic voltammetry of 0.1 M L-cysteine in 0.1 M, 0.05 M, and 0.005 M HCl, L-cysteine in 0.1 M HCl, pH 1.86, and 0.05 M NaOH, scan 1, scan rate100 mV/s scan 1,2,3, scan rate 100 mV/s
M HCl as well as 0.05 M NaOH and 0.05 M NaOH+0.05 M NaCl are shown in figures 7 and 8.
[image:7.612.303.500.513.661.2]The data in Figure 7a indicate that the cathodic current decreased with increasing pH values and then increased again in alkaline media. One should keep in mind that the ionic strength was not maintained in these experiments. At pH = 1.86 or in 0.1 M HCl, there was a cathodic current oscillation in all the 3 scans (Figure 7b) whereas with less HCl at pH = 2.33 (0.05 M HCl) and pH = 3.46 (5 mM HCl), there was current oscillation only during the first scan (Figures 8a and 8b). However there were spikes in both anodic and cathodic currents during scans 2 and 3.
[image:8.612.77.266.230.376.2]
The cyclic voltammetric data in alkaline solution (in 0.05 M NaOH) shown in Figure 9a indicate a slight cathodic current perturbation during the first scan only. When the alkaline solution contained some sodium chloride (0.05 M), there was a slight anodic shift of the cathodic current peak. Also the difference in cathodic currents between scan 1 and scan 2 or 3 practically disappeared in the presence of sodium chloride. A slight current oscillation emerged for all the three scans in the presence of chloride (Figure 9b). At pH = 3.46 (5 mM HCl), when NaCl was added to make a total of 0.1M chloride, there was a slight increase in cathodic currents in all the 3 scans. Also the cathodic current spike became more obvious in the presence of 0.1 M total Cl-.
Figure 9a. Cyclic voltammetry of 0.1 M Figure 9b. Cyclic voltammetry of 0.1 M L-cysteine in 0.05 M NaOH, pH 8.29, L-cysteine at pH 3.46, A) 5 mM HCl B)5 mM scan 1,2,3, scan rate100 mV/s HCl+95 mM NaCl; pH 8.29, C) 0.05 M NaOH
D) 0.05 M NaOH+0.05 M NaCl
Figure 10. Cyclic voltammetry of L-cysteine concentration dependence, pH 8.29, 8.27 8.23, 8.04 with increasing dilution, pH adjusted with NaOH
[image:8.612.198.385.509.665.2]
Finally the concentration dependence of L-cysteine at about pH = 8.29 on the cyclic voltammograms is shown in Figure 10. For the sake of clarity the currents had been multiplied by a factor of 200, 20, and 2.5 for cysteine concentrations of 0.5 mM, 5 mM, and 0.04 M, respectively. After this normalization, the cathodic currents seemed nearly equal but there were major differences in behavior in anodic currents at low and high cysteine concentrations. At high concentrations there were also slight current oscillations or perturbances in cathodic currents.
Cathodic current oscillations were seen in all the three scans in the presence of 0.059 M phosphate and 0.1 M HCl, and at least for scan 1 in the presence of less chloride or bromide when the starting potential was extended to 0.0 V. However, in the absence of any other counter-ions, no current oscillations are seen even when the starting potential was 0.3 V, a potential at which mercury could be expected to undergo passivation.
A review of the literature data [6] evaluated the reliability of the standard formal electrode potential for the L-cystine/L-cysteine redox couple according to the equation:
RSSR + 2H+ + 2e- = 2RSH (1)
Depending on the method used, the Eo (vs. SHE) values varied from -0.39 to -0.222 V at pH = 7 and from 0.02 to 0.191 V at pH = 0. The tendency for slow equilibration and adsorption on solid electrode surfaces has complicated these measurements.
When cysteine was oxidized, it formed mercury(I) cysteinate (RSHg) and got adsorbed on mercury by the reaction [19]:
RSH + Hg → RSHg(ads) + H+ +e- (2)
At low concentrations (≈ 1 x 10-20 M), the mercury ion is postulated to be Hg+ instead of the common Hg22+. Evidence has been presented to suggest the formation of a monolayer of mercury(I)
cysteinate as well as diffusion-controlled oxidation of L-cysteine by diffusion of the reactant through the film or after film breakdown [6, 19, 22, 23]. The difficulties in these analyses were highlighted by the fact that the stoichiometry of the mercury cysteinate complex has been suggested as RSHg, (RS)2Hg2, and (RS)2Hg [6]. Monolayer coverage by L-cystine instead of mercury cysteinate has also
been proposed.
In phosphate buffer at pH = 7.4, cyclic voltammograms of L-cysteine has been attributed to its reversible oxidation by the following reactions:
2 RSH + 2 Hg = (RS)2Hg2(ads) + 2 H+ + 2 e- (3)
2 RSH + Hg = (RS)2Hg(ads) + 2 H+ + 2 e- (4)
In hydrochloric acid media, peaks in cyclic voltammograms had been identified for reactions (1), (3) and (4) as well as
RSSR(ads) + 2H+ + 2e- = 2RSH (5)
The oxidation of L-cysteine at both gold and platinum electrodes was attributed to the following reactions [6]:
RSH = RSH(ads) (6)
RSH(ads) = RS.(ads) + H+ + e- (7)
2RS.(ads) = RSSR (8)
We used a high concentration of 0.1M L-cysteine in our investigations and found an additional process occurring at the electrode that could lead to cathodic current oscillations. This happened both in non-buffered as well as buffered medium.
Other examples of oscillatory instabilities observed included H2 oxidation in the presence of
small amounts of Cu2+ and Cl- [25] and hydrogen peroxide reduction on a Pt electrode in the presence of a small amount of halide ions [26, 27]. The adsorbed halogen atom seemed either to participate as a blocking site or to facilitate the adsorption of other substrates. Since we have found an increase in both cathodic and anodic currents in the presence of chloride or bromide we assumed that the adsorbed halogen promoted the adsorption of the L-cysteine. More evidence for this interaction is presented in the next section.
It is quite obvious that the electrochemistry of L-cystine/L-cysteine is quite complex. In all these investigations different buffers, such as phosphate, borate, acetate, and ammonia, as well as sulfuric acid, hydrochloric acid and sodium hydroxide, have been used to control the pH values. The specific interactions between the counter-ions and the charges in L-cysteine (varying depending on pH) have been neglected. Our present investigation highlighted the need for a stricter control of these counter-ions in understanding the mechanism of the electrode processes.
3.2 Frequency Response Analysis 3.2.1 Admittance
double layer. This shift from hydrogen to oxygen pointing towards the electrode should be gradual and could be decided by the changes in the scanning potential. The adsorption of ions, such as chloride or bromide, and phosphate as PO43-, HPO42-, H2PO4- complicates the admittance behavior. Also the
charge on L-cysteine could be varied depending on the pH values. Thus one should not overlook the interactions between the positively charged amine group in L-cysteine and the negative counter-ions as well the positively charged sodium ion and the negatively charged carboxyl group and sulfhydryl group. It is also possible to have the interaction between the carboxyl group and sodium mediated by a molecule of water. Sorting out some of those effects from admittance measurements should be a real challenge. However it is better than completely ignoring those effects in interpreting electrochemical data of these molecules.
In order to have some understanding of the electrochemical behavior of biological molecules, we have found it necessary to have experiments without any background electrolyte, whenever possible. This is contrary to the customary prescription for electrochemical experiments.
[image:11.612.71.268.416.571.2] [image:11.612.300.508.421.568.2]The admittance data for 0.1 M L-cysteine without any background electrolyte are shown in Figure 11a. For the sake of clarity the admittance data at 1000, 750 and 500 Hz are not included in this figure. The admittance increased from 1000 Hz to 10 Hz and then decreased. We had observed a similar behavior for collagen [1]. Another interesting feature observed was that with decreasing frequency, the two broad peaks shifted in opposite directions, and finally at 1 Hz, the two peaks merged into one. The cathodic peak around -0.6 V shifted more anodic and the peak around -0.3 V shifted more cathodic.
Figure 11a Admittance of 0.1M L-Cysteine, Figure 11b. Admittance of 0.1M L-Cysteine, pH 5.14, no background electrolyte, 5mM NaCl, pH 5.26; 1)500 Hz 2)250 Hz 1)250 Hz 2)100 Hz 3)50 Hz 4)10 Hz 5)1 Hz 3)100 Hz 4)50 Hz 5)10 Hz
We have seen a similar behavior in the case of Keplerate type molybdenum clusters of (NH4)42[MoVI72MoV60O372(CH3COO)30(H2O)72]·ca.300H2O·ca.10CH3COONH4) [20]. We had
shown in Figure 12. Since we have also observed a similar collapsing of two admittance peaks into one in collagen [1] we are tempted to speculate that the water near the electrode surface and the one hydrating L-cysteine could have opposite orientation effects on changing frequencies. One may consider that the water orientation near the carboxylate group and near the amine group have opposite orientations. At negative potentials, the positively charged amine group in L-cysteine and Na+ in the presence of NaCl, are directed towards the Hg electrode compared to the negatively charged carboxylate group and Cl- in the presence of NaCl. Carboxylates are known to participate in localized hydrolysis and form ion pairs with counter ions through a water molecule [32].
[image:12.612.122.490.226.363.2]
Figure 12. Phase microscopy (300X) of 0.0.04 M cysteine in 0.02 M NaOH, pH 8.27 and 0.1 M L-cysteine in 0.005 M HCl + 0.095 M NaCl, pH 3.47
The admittance data for 0.1M L-cysteine in the presence of 5 mM NaCl or 5 mM NaBr are shown in Figure 11b and 13a respectively. Even though the general trend is the same as with no background electrolyte there are some subtle differences in their behavior. 1) In the presence of either 5 mM NaCl or NaBr, the admittance increased up to 100 Hz and then decreased. Also, the merging of the two peaks into one with decreasing frequency happened at 10 Hz compared to 1 Hz without any background electrolyte.
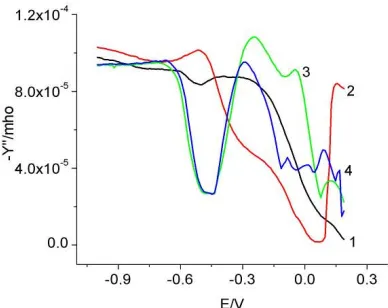
In order to get some additional information on the influence of the added electrolyte, the admittance data at three different frequencies are plotted in Figure 13b, Figures 14a and 14b for both the background electrolyte and L-cysteine in the presence of the electrolyte. The near equivalence of the admittance data at 250, 50 and 10 Hz until the end of first broad peak at about -0.6 V suggested that the cation, Na+ did not seem to exert a strong influence on its interaction with L-cysteine. However, the Na+ concentration is 20 times less than the α-NH3+ concentration. The difference
Figure 13a. Admittance of 0.1 M L-Cysteine, Figure 13b. Admittance comparison of 0.1 M 5 mM NaBr, pH 5.15; 1) 250 Hz 2) 100 Hz L-cysteine in the presence of 5 mM NaCl or NaBr 3) 50 Hz 4) 10 Hz at 250 Hz 1) NaCl 2) NaBr 3) NaCl+L-cysteine
4) NaBr +L-cysteine
[image:13.612.75.267.87.235.2]
Figure 14a. Admittance comparison of 0.1 M Figure 14b. Admittance comparison of 0.1 M L-cysteine in the presence of 5 mM NaCl L-cysteine in the presence of 5 mM NaCl or NaBr or NaBr at 50 Hz 1) NaCl 2) NaBr at 10 Hz 1) NaCl 2) NaBr 3) NaCl+L-cysteine 3) NaCl+L-cysteine 4) NaBr+L-cysteine 4) NaBr +L-cysteine
[image:13.612.302.496.335.491.2] [image:13.612.73.262.342.491.2]
Figure 15a. Admittance of 0.1 M L-Cysteine, Figure 15b. Admittance comparison of 0.1 M 0.1 M NaCl, pH 5.18; 1) 1000 Hz 2) 750 Hz L-cysteine in the presence of 0.1 M NaCl 3) 500 Hz 4) 250 Hz 5)100 Hz 6) 50 Hz at 1000 Hz 1) NaCl 2) NaCl+L-cysteine;
50 Hz, 3) NaCl 4) NaCl+L-cysteine
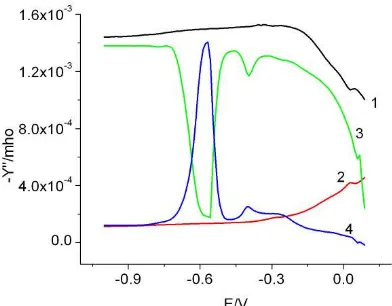
[image:14.612.76.272.85.234.2]The admittance data for L-cysteine in the presence of 0.1 M NaCl and its comparison with the 0.1 M NaCl are shown in Figure 15a and 15b respectively. The two peaks merged into one at about 250 Hz compared to 10 Hz in the presence of 5 mM NaCl, and 1 Hz without any NaCl, indicating the strong influence of the counter-ions. The comparison data with and without 0.1 M NaCl at 1000 Hz and 50 Hz indicate the negligible influence of Na+, and this is in agreement with the data in the presence of 5 mM NaCl or NaBr. The comparison data at 1000 and 50 Hz in the approximate range of -0.3 to 0.0 V also indicated stronger interactions between Cl- and L-cysteine than those observed in the presence of 5 mM NaCl because the admittance was less than that of the background electrolyte even at 1000 Hz.
[image:14.612.301.497.494.647.2] [image:14.612.74.274.494.650.2]
The admittance data for L-cysteine in the presence of 0.059 M phosphate buffer and its comparison with the buffer are shown in Figure 16a and 16b, respectively. The two peaks merged into one at about 100 Hz indicating a strong interaction between the phosphate and L-cysteine.
The near equivalence of the admittance data shown at 1000 and 50 Hz, until the end of first broad peak at about -0.6V, suggest that the cation, Na+ or K+ did not seem to exert a strong influence on its interaction with L-cysteine, and this is in agreement with the data reported in the presence of NaCl.
The comparison data at 1000 Hz and 50 Hz suggested interactions between phosphate and L-cysteine, thereby decreasing the admittance to be less than that of the buffer.
In searching for a substitute for NaF as a noninteracting electrolyte on mercury, the interphase between mercury and aqueous sodium dihydrogen phosphate had been investigated using capacity measurements [33]. However we are not aware of any admittance measurements on this background electrolyte. The data shown in Figure 17 are similar to that of sodium halides [32] and the orientational effects of water seem to affect the admittance data at potentials close to 0.0V at low frequencies.
Figure 17. Admittance of phosphate buffer (total phosphate = 0.059 M, K+ = 0.059 M and Na+ = 0.041 M) 1)1000 Hz 2)750 Hz 3)500 Hz 4)250 Hz 5)100 Hz 6)50 Hz 7)10 Hz
There are numerous studies on the inhibition of copper by organic molecules including amino acids [34-36]. The adsorption of the amino acid molecules on copper surface inhibits corrosion by insulating the copper surface [4, 5, 37]. The cathodic sites on the metal surface interacted with the cationic or zwitterionic form of L-cysteine. A negative ion, such as chloride, is known to have strong adsorption characteristics on a metal surface. It is suggested that chloride may enhance the adsorption of the amino acid [37]. The synergistic effect between the amino acid and chloride ions would lead to an enhanced adsorption of the amino acid molecules on the metal surface through the chloride ions [4]. It is believed that the adsorbed chloride ions form interconnecting bridges between the metal atoms and the positively charged amino acid molecules thus facilitating the adsorption process [4, 38, 39].
[image:15.612.197.397.313.457.2]
negatively charged and we have to consider interactions of L-cysteine directly through mercury as well as through the above mentioned interconnecting bridges through chloride. Also the thiol group has strong affinity for metals such as copper and mercury, thus giving rise to coordination through both the amino group and the –SH moiety.
3.2.2 Impedance
[image:16.612.307.509.320.473.2]The Nyquist plot for 0.1 M L-cysteine in the absence and presence of 5 mM NaCl and 5 mM NaBr are shown in Figures 18a and 18b, respectively. For the sake of clarity, the impedance data from 1000 Hz to about 28 Hz only are shown here. We noticed an oscillation in impedance at these high frequencies. We are not familiar with any literature data where an oscillation of this type has been observed. The potentials chosen corresponded to where there was an admittance minimum and high cathodic activity in cyclic voltammetry. When the concentration of Cl- was increased to 0.1 M HCl or in phosphate buffer (0.059 M phosphate) we did not see any oscillation in impedance, as shown in Figure 19.
Figure 18a. Nyquist plot for 0.1M L-cysteine, Figure 18b. Nyquist plot for 0.1M L-cysteine in pH 5.14, 1000 Hz to ~ 28 Hz 5mMNaCl, pH 5.26or 5mM NaBr, pH 5.15,
1000 Hz to ~ 28 Hz
[image:16.612.74.277.322.474.2] [image:16.612.207.393.529.678.2]
We are at a loss to explain the above phenomenon except to suggest that two species, each with a significant amount, may be involved in this process in the absence and presence of 5 mM NaCl or 5 mM NaBr and with excess chloride or phosphate there was only one species of appreciable concentration.
3.2.3 Differential Capacity
When ohmic resistance is compensated, differential capacitance measurements yield double layer capacitance, Cdl or Cs. Some typical data are shown in Figures 20a and 20b. Even though Cs
[image:17.612.76.270.337.504.2]should be independent of frequency, a dispersion is most often observed and is generally attributed to real surface with a fractal character, instead of an ideal homogeneous electrode surface. More importantly what we observe is that there seems to be two close similar peaks in the absence and presence of 5 mM NaCl or 5 mM NaBr. This finding is absent in 0.1M HCl and 0.059 M phosphate buffer. While the major peak near -0.5 V was very nearly the same in the presence of either 5 mM NaCl or NaBr, the anionic effect was more pronounced near 0.0 V. The influence of the chloride is expected to be more near 0.0 V and this is evident from the data in 0.1 M HCl.
Figure 20a. Double layer capacitance of Figure 20b. Double layer capacitance of 1) 0.1 M L-cysteine 2) with 5 mM NaCl and 1)0.1 M L-cysteine with 0.1 M HCl and
3) with 5mM NaBr 2) with 0.059 M phosphate buffer
4. CONCLUSIONS
[image:17.612.300.496.337.501.2]
potential as well as the L-cysteine concentration. Also if the starting potential was more anodic, the cathodic and anodic active regions extended much more into both cathodic and anodic regions. While scans 2 and 3 gave nearly the same current, scan 1 always gave a higher cathodic current, especially in the presence of counter-ions. With the scanning potential starting at 0.0 V, cathodic current oscillations were observed in the presence of counter-ions and high concentrations of L-cysteine. Admittance data in the absence as well as the presence of counter-ions indicated competing influences of orientational effects of water with decreasing frequencies, indicating a characteristic of self-assembly behavior. In the absence of counter-ions, admittance increased continuously from 1000 Hz to 10 Hz. In the presence of counter- ions this trend changed the direction at different frequencies depending on the concentration of the counter-ion. The admittance data indicated strong interactions between α-COO -and α-NH3+ groups of L-cysteine. Impedance data exhibited oscillations at high frequencies in the
absence and the presence of 5 mM NaCl or 5 mM NaBr but not in 0.1 M HCl or in 0.059 M phosphate buffer. Capacitance data suggested the presence of two species of significant concentrations in the absence and the presence of 5 mM NaCl or 5 mM NaBr but only one species at higher concentrations such as 0.1 M HCl or 0.059 M phosphate buffer. Finally the results of our investigations, especially from cyclic voltammetry and admittance, suggested the need to look at electrochemical behavior of molecules without any background electrolytes, whenever possible, in order to gain information on solute-solvent interactions near the double layer and arrive at more meaningful mechanisms. Of course, this finding is contrary to the accepted traditional practice in electrochemistry.
ACKNOWLEDGEMENT
B. Chu acknowledges financial support of this work provided by the Basic Energy Sciences, Department of Energy (DEFG0286ER45237).
References
1. C.V. Krishnan, M. Garnett, Int. J. Electrochem. Sci., 1 (2006) 215 2. C.V. Krishnan, M. Garnett, Int. J. Electrochem. Sci., 1 (2006) 283
3. D. Voet, J.G. Voet, Biochemistry, second edition, John Wiley & Sons, Inc, New York, (1995) 59 4. K.M. Ismail, Electrochimica Acta, 52 (2007) 7811
5. D.Q. Zhang, L.X. Gao, G.D. Zhou, J. Appl. Electrochem., 35 (2005) 1081
6. T.R. Ralph, M.L.Hitchman, J.P. Millington, F.C. Walsh, J. Electroanal. Chem., 375 (1994) 1 7. T.R. Ralph, M.L.Hitchman, J.P. Millington, F.C. Walsh, J. Electroanal. Chem., 375 (1994) 17 8. W.R. Fawcett, M. Fedurco, Z. Kovacova, Z. Borkowska, J. Electroanal. Chem., 368 (1994) 265 9. W.R. Fawcett, M. Fedurco, Z. Kovacova, Z. Borkowska, J. Electroanal. Chem., 368 (1994) 275 10. V. Brabec, V. Mornstein, Biophysical Chem., 12 (1980) 159
11. J.A. Reynaud, B. Malfoy, P. Canesson, J. Electroanal. Chem., 114 (1980) 195 12. M.T. Stankovich, A.J. Bard, J. Electroanal. Chem., 75 (1977) 487
13. Z. Samec, Zh. Malysheva, J. Koryta, J. Pradac, J. Electroanal. Chem., 65 (1975) 573 14. I.R. Miller, J. Teva, J. Electroanal. Chem., 36 (1972) 157
15. N.A. Hampson, J.B. Lee, K.I. Mac Donald, J. Electroanal. Chem. Interfacial Electrochem., 34 (1972) 91
17. D.G. Davis, E. Bianco, J. Electroanal. Chem. Interfacial Electrochem., 12 (1966) 254 18. W. Stricks, I.M. Kolthoff, J. Am. Chem. Soc., 75 (1953) 5673
19. I.M. Kolthoff, C. Barnum, J. Am. Chem. Soc., 62 (1940) 3061 20. C. V. Krishnan, Q. Li, B. Chu, Electrochimica Acta, 53 (2007) 975
21. A. Muller, S.K. Das, C. Kuhlmann, H. Bogge, M. Schmidtmann, E. Diemann, E. Krickemeyer, J. Hormes, H. Modrow, M. Schindler, Chem. Commun., (2001) 655
22. I.M. Kolthoff, W. Stricks, N. Tanaka, J. Am. Chem. Soc., 77 (1955) 5211 23. B. Nygard, Acta Chem. Scand., 15 (1961) 1039
24. P. Bianco, J. Haladjian, Electrochimica Acta, 25 (1980) 1317
25. K. Krischer, M. Luebke, W. Wolf, M. Eiswirth , G. Ertl, Electrochimica Acta, 40 (1995) 69 26. Y. Mukouyama, S. Nakanishi, T. Chiba, K. Murakoshi, Y. Nakato, J. Phys. Chem., 105 (2001) 7246
27. Y. Mukouyama, S. Nakanishi, H. Konishi, Y. Nakato, J. Electroanal. Chem., 473 (1999) 156 28. J.E. Bauerle, J. Phys. Chem. Solids, 30 (1969) 2657
29. C.V. Krishnan, M. Garnett, Electrochim. Acta, 51 (2006) 1541
30. C.V. Krishnan, M. Garnett, B. Hsiao, B. Chu, Int. J. Electrochem. Sci., 2 (2007) 29 31. C.V. Krishnan, M. Garnett, B. Chu, Int. J. Electrochem. Sci., 2 (2007) 444
32. C.V. Krishnan, M. Garnett, B. Chu, Int. J. Electrochem. Sci., 2 (2007) 958 33. R. Parsons, F.G.R. Zobel, J. Electroanal. Chem., 9 (1965) 33
34. M.M. Antonijevic, M.B. Petrovic, Int. J. Electrochem. Sci., 3 (2008) 1
35. J.B. Matos, L.P. Pereira, S.M.L. Agostinho, O.E. Barcia, G.G.O. Cordeiro, E.D’Elia, J. Electroanal. Chem., 570 (2004) 91
36. G. Moretti, F. Guidi, Corrosion Science, 44 (2002) 1995 37. G. Berket, A. Yurt, Corrosion Science 43 (2001) 1179
38. A. Popova, E. Sokolova, S. Raicheva, M. Christov, Corrosion Science 45 (2003) 33 39. W.A. Badawy, K.M. Ismail, A.M. Fathi, J. Appl. Electrochem., 35 (2005) 8793