Int. J. Electrochem. Sci., 6 (2011) 1206 - 1215
International Journal of
ELECTROCHEMICAL
SCIENCE
www.electrochemsci.org
Voltammetric Determination of Dissolved Nitrous Oxide
Natalija Velić1, Mirela Samardžić2
, Milan Sak-Bosnar2,*, Božidar Šantek3
1
Faculty of Food Technology, Josip Juraj Strossmayer University of Osijek, F. Kuhača 18, HR-31000
Osijek, Croatia
2 Department of Chemistry, Josip Juraj Strossmayer University of Osijek, F. Kuhača 20, HR-31000
Osijek, Croatia 3
Faculty of Food Technology and Biotechnology, University of Zagreb, Pierottijeva 6, HR-10000 Zagreb, Croatia
*
E-mail: [email protected]
Received: 1 March 2011 / Accepted: 22 March 2011 / Published: 1 April 2011
The platinum disk electrode has been tested as a working electrode for the cathodic reduction of N2O in aqueous solutions using 0.2 M K2SO4 as supporting electrolyte, buffered at pH = 12, and a scan rate of 100 mV s-1. The well-resolved cathodic peaks were observed for the solutions of N2O in the concentration range of 0 – 10.34 mM. A strong linear correlation was seen between the cathodic peak current and N2O concentration. The detection limit of the developed method amounts to c(N2O) = 0.0104 mM, and the quantification limit amounts to c(N2O) = 0.0191 mM. The error of these determination methods was between 4.0 and 5.1 % for higher N2O concentrations (c(N2O) > 1 mM) and 7.4 to 12.3 % for N2O concentrations below 0.5 mM. The presence of O2 and CO2 did not influence the determination of N2O in solution.
Keywords: Nitrous oxide, platinum electrode, voltammetric determination, cathodic reduction, solution
1. INTRODUCTION
soils and aquatic systems (oceans). Also, trace amounts are found in the Earth’s atmosphere. Atmospheric concentrations of N2O are around 350 ppb and are increasing at a rate as high as 0.3 % per year [3]. Nitrous oxide has a negative impact on the atmosphere by causing ozone depletion contributing to global warming, and it is 300 times more persistent in the atmosphere than CO2 [4]. It is therefore necessary to monitor, reduce, and control N2O emission. Natural sources of N2O comprise 70% of total atmospheric emission. Anthropogenic sources, which comprise 30% of total atmospheric N2O emission, include agricultural soil management (excessive use of fertilizers), biomass burning, industrial processes, fossil fuel combustion, and wastewater treatment plants [5, 6].
With respect to different sources of N2O and its forms (free or dissolved), it is necessary to develop detection methods that are fast and reliable. The methods most commonly used for N2O detection and quantification include gas chromatography [7, 8] and IR spectroscopy [9-11]. Electrochemical methods of analysis are mostly developed for measuring dissolved N2O in aqueous solutions and have major advantages such as rapidity, simplicity, sensitivity, and relatively low cost [12].
Electroreduction of nitrous oxide has been investigated in various types of noble metal working electrodes (platinum, gold, and silver) using various supporting electrolytes (KCl, KOH, NaOH; K2SO4), and over a wide potential range (from -0.6 to -1.6 V) [1, 13-19]. A few authors describe the use of modified commercially available Clark electrodes for N2O amperometric measurements [14, 15, 17]. Andersen et al. developed a commercially available electrochemical microsensor for N2O quantification in aqueous media[19].
In this study, we investigated the electrochemical reduction of N2O in aqueous solutions on the platinum disk electrode.
2. EXPERIMENTAL
2.1. Reagents and materials
All reagents were of analytical grade and were used without further purification. Stock solutions of supporting electrolytes were prepared with high purity water from a Millipore Milli-Q system (resistivity greater than or equal to 18 M cm). Reagents used for stock solutions were obtained from Kemika (Zagreb, Croatia) and are as follows: K2SO4 (c = 0.5 M), NaOH (c = 5.0 M), KOH (c = 2.0 M), KCl (c = 2.5 M), KNO3 (c = 0.1 M), NaH2PO4 (c = 0.25 M), Na2HPO4 (c = 0.25 M), and Na-ascorbate (c = 0.5 M).
2.2. Apparatus and measurements
All electrochemical measurements were performed using a EA164 Quad Stat software controlled four-channel potentiostat (eDAQ, Denistone East, NSW, Australia), and a 821 e-corder (eDAQ) unit was used for collection, display and analysis of signals. A conventional three-electrode system was used for voltammetric measurments consisting of platinum disk (2 mm in diameter) working electrode, Ag/AgCl reference electrode, and a platinum plate was used as the counter electrode.
2.3. Procedure
Cyclic voltammetry was used to investigate the influence of ionic strength, pH, and scan rate on the shape, height, and shift of voltammetric wave. Cyclic voltammetric experiments were performed at a polarization voltage range of ± 1.0 V.
Linear sweep voltammetry was used for measuring dissolved N2O in model solutions. All electrochemical experiments were carried out at room temperature.
3. RESULTS AND DISCUSSION
3.1. Selection of supporting electrolyte
A number of supporting electrolytes were tested including the following: K2SO4 (at 4 concentration levels, c = 0.05, 0.1, 0.2 and 0.3 M), KOH (c = 1 M), KCl (c = 0.5 M) + KOH (c = 0.5 M), KCl (c = 0.1 M), NaH2PO4 (c = 0.1 M) + Na2HPO4 (c = 0.1 M), KNO3 (c = 0.1 M), and K2SO4 + Na-ascorbate. In general, a somewhat higher sensitivity and better peak shape was obtained in K2SO4 solutions. A significant increase in cathodic peak current was observed when concentrations of supporting electrolytes were increased in the range of c(K2SO4 ) = 0.05 - 0.2 M, whereas further concentration increases (from 0.2 to 0.3 M) did not significantly affect the cathodic peak current. Because electrolytes added to N2O water solution depress its solubilty [2], 0.2 M K2SO4 was chosen as the supporting electrolyte for the rest of the measurements.
3.2. Influence of pH
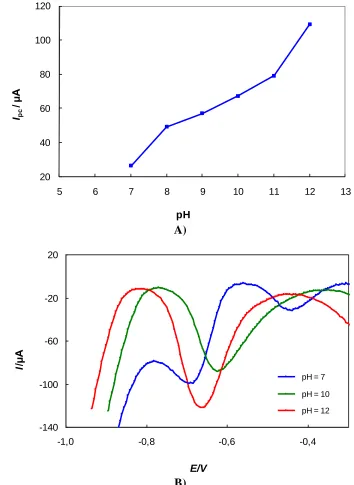
The influence of pH on the response of N2O at the platinum electrode was investigated at pH = 4, 7, 8, 9, 10, 11, and 12. The results show that the peak currents increased with increasing pH, whereas the cathodic peak shifted to more negative potential values (Figure 1).
20 40 60 80 100 120
5 6 7 8 9 10 11 12 13
Ipc
/ µ
A
pH A)
-140 -100 -60 -20 20
-1,0 -0,8 -0,6 -0,4
E/V
I
/µ
A
pH = 7
pH = 10
pH = 12
[image:4.596.118.472.79.564.2]B)
Figure 1. The influence of pH of the supporting electrolyte on a) the peak current response b) the response of N2O at the platinum disk working electrode, c(N2O) = 7.76 mM,c(K2SO4) = 0.2 M, v = 100 mV s-1
3.3. Effect of scan rate
expected for diffusion-controlled reduction processes. The intercept on the Y-axis indicates that processes apart from diffusion influence N2O reduction [20]. This is in accordance with former investigations indicating that N2O reduction at platinum electrode is carried out also by an adsorption process [1, 18].
R² = 0,9834
0 20 40 60 80 100
1 2 3 4 5 6 7 8 9 10 11
Ipc
/µ
A
[image:5.596.139.455.170.366.2]v1/2/(mV s-1)1/2
Figure 2. Dependence of the cathodic peak current on the square root of the scan rate, c(N2O) = 5,17 mM, c(K2SO4) = 0.2 M, pH = 12.
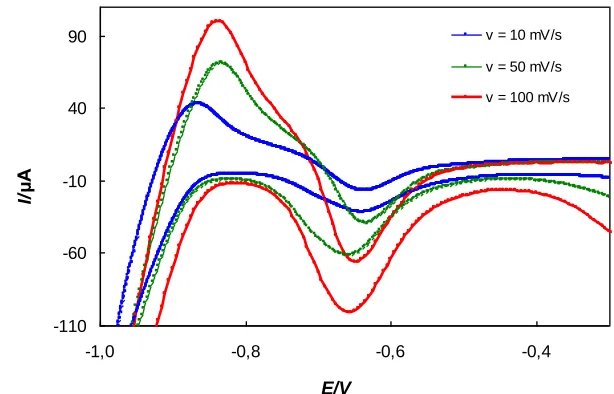
The cyclic voltammograms of N2O solutions, shown in Figure 3, perfomed at scan rates v = 10, 50, and 100 mV s-1 indicate an increase of cathodic peak current with an increasing scan rate. At the same time, the cathodic peak potentials shifted toward more negative potential values, which indicates irreversible electrochemical reactions.
-110 -60 -10 40 90
-1,0 -0,8 -0,6 -0,4
E/V
I/
µA
v = 10 mV/s
v = 50 mV/s
v = 100 mV/s
[image:5.596.142.449.529.726.2]
3.4. Interferences
Generally, the interfering agents are all reducing agents and species that can be electrochemically reduced on the platinum electrode at potentials close to the reduction potential of N2O. Carbon dioxide does not interfere because the measurements are performed in strong alkaline media, where CO2 is easily converted to CO32-. Oxygen does not influence the N2O determination because its peak separation potentials on the platinum electrode are sufficiently different from those of N2O. This was confirmed by performing the measurements in oxygen-free distilled water, which was obtained by the sparging of distilled water with argon. Nitric oxide (NO) ,due to its short half-life and high reactivity, is rarely found in a free form. Also, it is easily oxidized, appearing in aqueous absorbtion media as nitrite and nitrate, and it is detected by various methods. Nitrogen dioxide (NO2) hydrolyzes with disproportionation to give nitric acid. Ascorbic acid seriously disturbs determination of N2O and must be absent in the solution to be analyzed.
3.5. Determination of N2O
3.5.1. Response characteristics of the platinum electrode
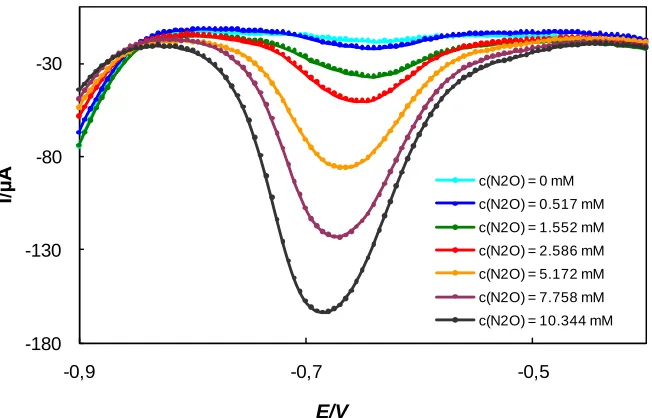
The determination of N2O in aqueous solutions using the platinum disk electrode was accomplished by linear sweep voltammetry (LSV), and the corresponding voltammograms are shown in Figure 4.
-180 -130 -80 -30
-0,9 -0,7 -0,5
I/
µ
A
E/V
c(N2O) = 0 mM
c(N2O) = 0.517 mM
c(N2O) = 1.552 mM
c(N2O) = 2.586 mM
c(N2O) = 5.172 mM
c(N2O) = 7.758 mM
[image:6.596.137.463.450.659.2]c(N2O) = 10.344 mM
Figure 4. LSV of N2O solutions of different concentrations, c(N2O) = 0 – 10.34 mM, c(K2SO4) = 0.2 M, pH = 12, v = 100 mV s-1.
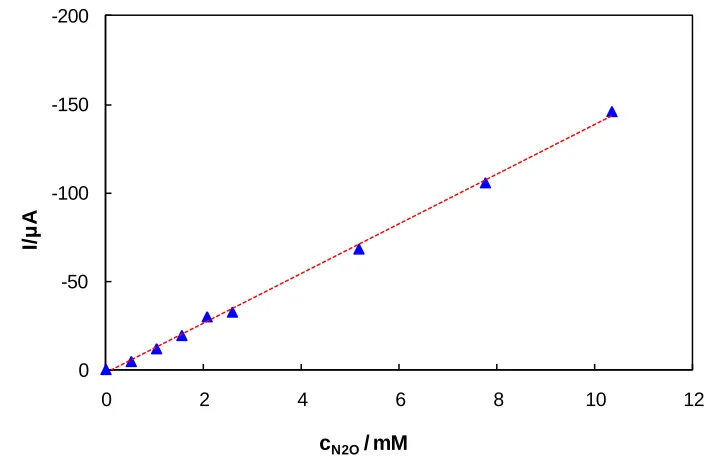
against N2O concentration is shown in Figure 5. The strong linear correlation is seen between the cathodic peak current and N2O concentration in the above concentration range defined by the following equation:
Ipc = 2.19 – 14.12 × c(N2O)
where Ipc is cathodic peak current (μA), c(N2O) is the concentration of dissolved N2O (mM). The regression statistics of LSV responses of platinum electrode toward the solutions of N2O for the above concentration range is shown in Table 1.
-200
-150
-100
-50
0
0 2 4 6 8 10 12
I/
μ
A
cN2O/ mM
Figure 5. The response currents of the platinum electrode towards the solutions of different N2O concentrations using linear sweep voltammetry c(K2SO4) = 0.2 M, pH = 12, v = 100 mV s-1.
Table 1. Regression statistics of the platinum electrode LSV responses in the solutions of different N2O concentrations, c(N2O) = 0 – 10.34 mM, c(K2SO4) = 0.2 M, pH = 12, v = 100 mV s-1.
Parameters Values
Slope (S) -14.12
SES 0.21
CIS (p = 0.05) 0.50
Intercept (I) 2.19
SEI 1.01
CII (p = 0.05) 2.39
Correl. Coef. R2 0.9985
[image:7.596.121.474.222.450.2] [image:7.596.137.457.561.757.2]
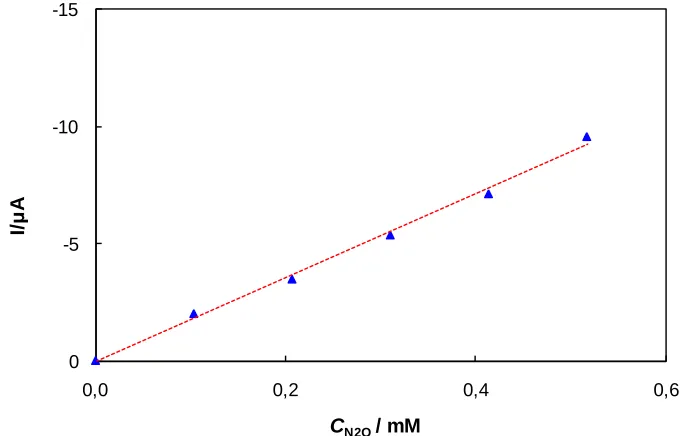
To determine the sensitivity, detection, and quantification limits of these N2O measurements, the response characteristics of the platinum electrode was specifically investigated in the lower N2O concentration regions (c(N2O) = 0 – 0.517 mM). The resulting LSV responses are shown in Figure 6, and the related calibration curve is shown in Figure 7.
-35 -25 -15 -5
-0,8 -0,7 -0,6
I/
µ
A
E/V
c(N2O) = 0 mM
c(N2O) = 0.103 mM
c(N2O) = 0.207 mM
c(N2O) = 0.310 mM
c(N2O) = 0.414 mM
[image:8.596.129.461.165.371.2]c(N2O) = 0.517 mM
Figure 6. LSV of N2O solutions of different concentrations, c(N2O) = 0 – 0.517 mM, c(K2SO4) = 0.2 M, pH = 12, v = 100 mV s-1.
-15
-10
-5
0
0,0 0,2 0,4 0,6
I/
μ
A
CN2O/ mM
Figure 7. The LSV response characteristics of the platinum electrode towards the solutions of lower N2O concentrations, c(N2O) = 0 – 0.517 M, c(K2SO4) = 0.2 M, pH = 12, v = 100 mV s-1.
[image:8.596.127.467.439.657.2]
Ipc = 0.12 – 18.14 × c(N2O)
[image:9.596.133.451.221.389.2]The detection and quantification limit of the developed method amounted to c(N2O) = 0.0104 mM and c(N2O) = 0.0191 mM, respectively.
Table 2. Regression statistics of the platinum electrode responses towards the solutions of lower N2O concentrations using LSV, c(N2O) = 0 – 0.517 mM, c(K2SO4) = 0.2 M, pH = 12, v = 100 mV s-1.
Parameters Values
Slope (S) -18.14
SES 0.92
CIS (p = 0.05) 2.92
Intercept (I) 0.12
SEI 0.31
CII(p = 0.05) 1.00
Correl. Coef. R2 0.9924
SE = standard error CI = confidence interval
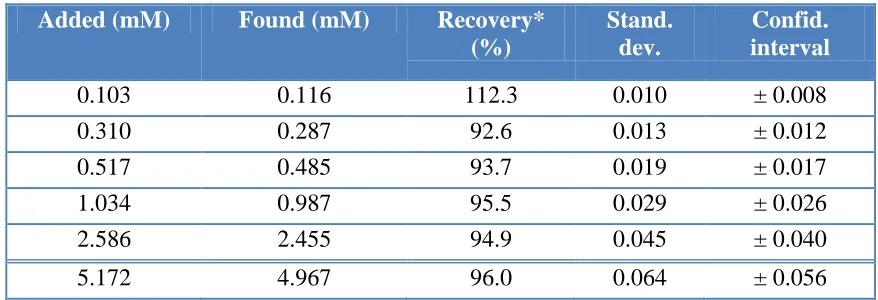
3.5.2. Accuracy of the determination
The accuracy of the voltammetric N2O determination using the developed method was tested by the standard addition method. The results are shown in Table 3. The obtained recoveries can be considered as satisfactory for the determination of gaseous samples, such as N2O, with an error between 4.0 and 5.1 % for higher concentrations (c(N2O) > 1 mM). For the N2O concentrations below 0.5 mM, deviations from the true values totalled 7.4 to 12.3 % (for the lowest concentration measured, c(N2O) = 0.103 mM). The confidence interval given in Table 3 relates to 95% confidence level.
Table 3. The results and statistics of the voltammetric N2O determination.
Added (mM) Found (mM) Recovery*
(%)
Stand. dev.
Confid. interval
0.103 0.116 112.3 0.010 ± 0.008
0.310 0.287 92.6 0.013 ± 0.012
0.517 0.485 93.7 0.019 ± 0.017
1.034 0.987 95.5 0.029 ± 0.026
2.586 2.455 94.9 0.045 ± 0.040
5.172 4.967 96.0 0.064 ± 0.056
[image:9.596.78.517.598.748.2]
4. CONCLUSIONS
Cyclic voltammetry was used to investigate the electrochemical behavior of N2O at a platinum disc electrode. The optimum supporting electrolyte was selected. The influence of pH and scan rates on the magnitude and position of the cathodic reduction peak was investigated. The platinum N2O electrode was characterized by linear sweep voltammetry, and the linear response region, the detection and quantification limits were determined. The presence of O2 and CO2 did not influence the determination of N2O in solutions.
ACKNOWLEDGMENTS
The authors gratefully acknowledge financial support from the Croatian Ministry of Science, Education and Sports given to project No. 291-0580000-0169.
Refrences
1. K. E. Johnson, D. T. Sawyer. Electroanalytical Chemistry and Interfacial Electrochemistry, 49 (1974) 95.
2. W. C. Trogler. Coordin. Chem. Rev., 187 (1999) 303.
3. N. Takaya, M. A. B. Catalan-Sakairi, Y. Sakaguchi, I. Kato, Z. Zhou, H. Shoun. Appl. Environ. Microbiol., 69 (2003) 3152.
4. Intergovernmental Panel on Climate Change. Cambridge University Press, Cambridge (2001) 5. P. Czepiel, P. Crill, R. Harriss. Environ. Sci. Technol., 29 (1995) 2352.
6. M. J. Kampschreur, H. Temmnik, R. Kleerebezem, M. S. M. Jetten, M. C. M. van Loosdrecht. Water Res., 43 (2009) 4093.
7. M. B. Esler, D. W. T. Griffith, F. Turatti, S. R. Wilson, T. Rahn, H. Zhang. Chemosphere-Global Change Sci., 2 (2000) 445.
8. S. R. Drescher, S. D. Brown. J. Chromatogr. A, 1133 (2006) 300. 9. T. Osada, H. B. Rom, P. Dahl. ASABE, 41 (1998) 1109.
10.J. L. Jimenez, J. B. McManus, J. H. Shorter, D. D. Nelson, M. S. Zahniser, M. Koplow, G. J. McRae, C. E. Kolb. Chemosphere-Global Change Sci., 2 (2000) 397.
11.H. J. Hellebrand, W.-D. Kalk. Nutr. Cycl. Agroecosys., 60 (2001) 83. 12.S. Laschi, M. Mascini. Med. Eng. Phys., 28 (2006) 934.
13.W. J. Albery, W. N. Brooks, S. P. Gibson, M. W. Heslop, C. E. W. Hahn. Electrochim. Acta, 24 (1979) 107.
14.P. R. Alefounder, S. J. Ferguson. Biochem. Bioph. Res. Co., 104 (1982) 1149. 15.W. Zimmer, G. Danneberg, H. Bothe. Curr. Microbiol., 12 (1985) 341.
16.N. P. Revsbech, L. P. Nielsen, P. B. Christensen, J. Sørensen. Appl. Environ. Microbiol., 54 (1988) 2245.
17.K. D. Tucker, J. L. Neal. Curr. Microbiol., 17 (1988) 95. 18.Kudo, A. Mine Appl. Surf. Sci., 121/122 (1997) 538.
19.K. Andersen, T. Kjær, N. P. Revsbech. Sensor. Actuator. B, 81 (2001) 42.
20.K. Anuar, W. T. Tan, M. S. Atan, K. Dzulkefly, S. M. Ho, H. M. Jelas, N. PJST, 8 (2007) 252.