This is a repository copy of
Why do stroke survivors not receive recommended amounts of
active therapy? Findings from the ReAcT study, a mixed-methods case-study evaluation in
eight stroke units
.
White Rose Research Online URL for this paper:
http://eprints.whiterose.ac.uk/129847/
Version: Published Version
Article:
Clarke, D.J. orcid.org/0000-0001-6279-1192, Burton, L.-J. orcid.org/0000-0003-3617-1410,
Tyson, S.F. orcid.org/0000-0001-6301-8791 et al. (9 more authors) (2018) Why do stroke
survivors not receive recommended amounts of active therapy? Findings from the ReAcT
study, a mixed-methods case-study evaluation in eight stroke units. Clinical Rehabilitation.
https://doi.org/10.1177/0269215518765329
[email protected] https://eprints.whiterose.ac.uk/ Reuse
This article is distributed under the terms of the Creative Commons Attribution-NonCommercial (CC BY-NC) licence. This licence allows you to remix, tweak, and build upon this work non-commercially, and any new works must also acknowledge the authors and be non-commercial. You don’t have to license any derivative works on the same terms. More information and the full terms of the licence here:
https://creativecommons.org/licenses/
Takedown
If you consider content in White Rose Research Online to be in breach of UK law, please notify us by
https://doi.org/10.1177/0269215518765329
Clinical Rehabilitation 1 –14
© The Author(s) 2018
Reprints and permissions:
sagepub.co.uk/journalsPermissions.nav DOI: 10.1177/0269215518765329 journals.sagepub.com/home/cre
CLINICAL REHABILITATION
Why do stroke survivors not receive
recommended amounts of active
therapy? Findings from the ReAcT
study, a mixed-methods case-study
evaluation in eight stroke units
David J Clarke
1, Louisa-Jane Burton
1,
Sarah F Tyson
2, Helen Rodgers
3, Avril Drummond
4,
Rebecca Palmer
5, Alex Hoffman
6, Matthew Prescott
7,
Pippa Tyrrell
8, Lianne Brkic
1,3, Katie Grenfell
1and Anne Forster
1Abstract
Objective: To identify why the National Clinical Guideline recommendation of 45 minutes of each appropriate therapy daily is not met in many English stroke units.
Design: Mixed-methods case-study evaluation, including modified process mapping, non-participant observations of service organisation and therapy delivery, documentary analysis and semi-structured interviews.
Setting: Eight stroke units in four English regions.
Subjects: Seventy-seven patients with stroke, 53 carers and 197 stroke unit staff were observed; 49 patients, 50 carers and 131 staff participants were interviewed.
Results: Over 1000 hours of non-participant observations and 433 patient-specific therapy observations were undertaken. The most significant factor influencing amount and frequency of therapy provided was the time therapists routinely spent, individually and collectively, in information exchange. Patient factors, including fatigue and tolerance influenced therapists’ decisions about frequency and intensity, typically resulting in adaptation of therapy rather than no provision. Limited use of individual patient therapy timetables was evident. Therapist staffing levels were associated with differences in therapy provision but were not the main determinant of intensity and frequency. Few therapists demonstrated understanding
1 Academic Unit of Elderly Care and Rehabilitation, Leeds
Institute of Health Sciences, Bradford Royal Infirmary, Bradford, UK
2 School of Health Sciences, Manchester Academic Health
Science Centre, The University of Manchester, Manchester, UK
3 Stroke Research Group, Institute of Neuroscience,
Newcastle University, Newcastle, UK
4 Faculty of Medicine and Health Sciences, University of
Nottingham, Nottingham, UK
5 Health Services Research, School of Health and Related
Research, The University of Sheffield, Sheffield, UK
Original Article
6 Sentinel Stroke National Audit Programme, Royal College of
Physicians, London, UK
7 Physiotherapy Department, Bradford Teaching Hospitals
NHS Trust, Bradford, UK
8 Salford Royal NHS Foundation Trust and Manchester
Academic Health Science Centre, The University of Manchester, Manchester, UK
Corresponding author:
David J Clarke, Academic Unit of Elderly Care and Rehabilitation, Leeds Institute of Health Sciences, Bradford Royal Infirmary, Bradford BD9 6RJ, UK.
2 Clinical Rehabilitation 00(0)
of the evidence underpinning recommendations for increased therapy frequency and intensity. Units delivering more therapy had undertaken patient-focused reorganisation of therapists’ working practices, enabling them to provide therapy consistent with guideline recommendations.
Conclusion: Time spent in information exchange impacted on therapy provision in stroke units. Reorganisation of therapists’ work improved alignment with guidelines.
Keywords
Stroke, stroke units, therapy intensity, therapy frequency, rehabilitation
Received: 25 July 2017; accepted: 24 February 2018
Introduction
National clinical guidelines for stroke worldwide recommend providing as much scheduled therapy as possible to stroke survivors.1–4 Therapy
provi-sion (physiotherapy and occupational therapy) has been reported to be lower in England than that pro-vided in comparable countries.5 The CERISE
study5 and systematic review evidence6–10 informed
the United Kingdom, guideline1 which
recom-mends patients should ‘accumulate at least 45 min-utes of each appropriate therapy every day at a frequency that enables them to meet their rehabili-tation goals’ (p. 25).
Recommendations are based on consistent evi-dence that increased frequency and intensity of therapy in the first six months post-stroke can improve recovery rate and outcome.6–10 There are
limitations in the generalisability of this evidence to inpatient stroke units, as two recent randomised controlled trials focussing on task-specific11 and
task-oriented12 upper limb training found no
evi-dence of a dose–response relationship.
The Sentinel Stroke National Audit Programme (SSNAP) monitors therapists’ (self-reported) per-formance against the guideline target, continuously collecting a minimum data set within acute hospi-tals in England, Wales and Northern Ireland,13
pro-viding a high-level summary across 10 care domains. The SSNAP publishes quarterly perfor-mance ratings for each domain (A (first class ser-vice) to E (substantial improvement required)) and consistently identifies that therapy frequency and intensity recommendations are not met in most stroke units.13 Similar problems in providing
rec-ommended therapy levels are reported in Europe, Canada and Australia.14–16 These findings raise
important questions about why recommendations are not being met. The aim of the ReAcT (why do stroke survivors not receive recommended amounts of active therapy) study was therefore to develop an in-depth understanding of therapy provision in stroke units in England, including how clinical guideline recommendations are interpreted and implemented by therapists, and experienced by patients and their carers.
Methods
The study received a favourable ethical opinion from the Health Research Authority, National Research Ethics Service Committee North-West (14/NW/0266). Our approach is summarised in the following; full details are published elsewhere.17
We employed a mixed-methods case-study approach to explore therapy provision (physiotherapy, occupational therapy and speech and language ther-apy). We purposively sampled eight stroke units in four English regions to include a mix of hyper-acute, acute and rehabilitation units, with higher and lower national audit ratings for therapy performance.13
Modified process mapping18 in each unit
pro-vided a staff-reported map of patients’ inpatient therapy journey which we compared with our find-ings. We conducted non-participant observations19
for approximately 16 weeks in each unit using an established framework.20 The researcher was
managed and spent, approaches to multidisciplinary team (MDT) working and on therapy planning and provision. Field notes were recorded contempora-neously. Observations progressed to study of a pur-posively selected patient group (up to 10) in each unit, to understand therapy provision for patients with different post-stroke impairments including those with mild, moderate and severe disability post-stroke and people with aphasia. For these 10 patients (in each unit), we categorised therapy inter-ventions (Supplementary file I), confirming catego-ries with therapists, and recorded reported session aims after each session. These patients’ therapy records were also subject to documentary analysis to identify numerical and textual discrepancies between our observations and therapists’ notes.
Following observations, we conducted audio-recorded semi-structured interviews with purposive samples of 15–20 staff per unit. Interviews lasted about 1 hour; questions explored perceptions and experiences of working towards the recommenda-tion, decision-making processes, service structure, working hours and skill-mix (Supplementary file II). The 10 patients and carers from each of the first six sites were invited to participate in audio-recorded semi-structured interviews in their own homes 4–6 weeks postdischarge. Patient and carer interview data are not reported here.
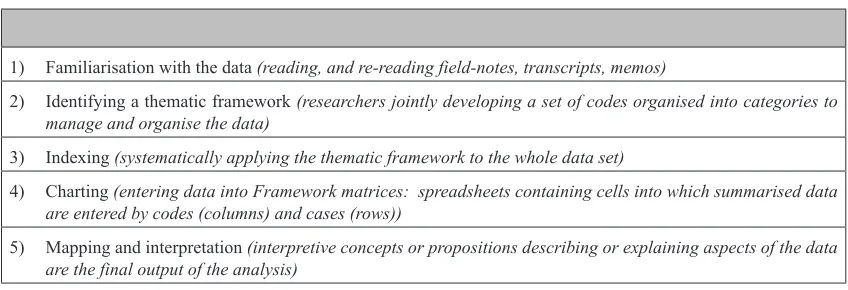
We transcribed interviews verbatim and managed them alongside process maps, field-notes and obser-vational records in QSR-NVivo10 (QSR International Pty Ltd, 2011). These data were analysed by four researchers working through each stage of the frame-work approach (Figure 1) in pairs and as a group.21
An expert advisory group reviewed emerging inter-pretations and explanations.
Quantitative data from observations and docu-mentary analysis were managed in SPSS Statistics 22 (IBM Corporation, New York, USA). We gener-ated descriptive summary statistics and compared therapist-recorded and observer-recorded session lengths using a paired samples t-test. These data were compared with the main factors emerging from the Framework analysis, to confirm, chal-lenge or expand the qualitatively derived explana-tory factors.
Results
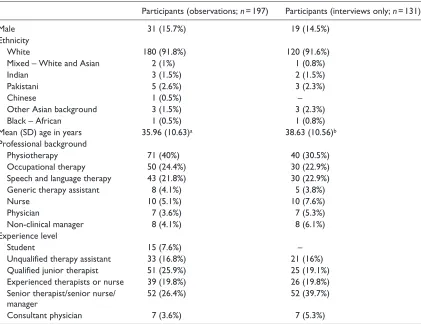
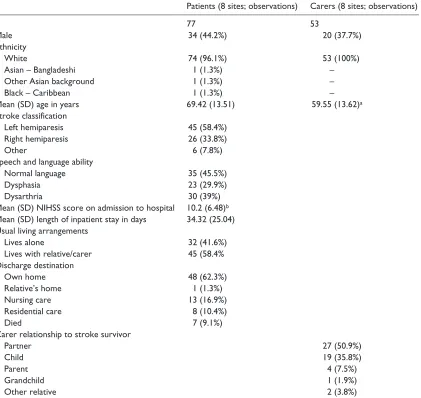
We completed over 1000 hours of non-participant observations, including 433 therapy sessions. One hundred and ninety-seven staff, 77 patients and 53 carers were observed; we interviewed 131 staff, 49 patients and 50 carers. We completed documentary analysis of therapy records of 75 patients. Table 1 provides a summary of site characteristics; Table 2 presents staff characteristics and Table 3 presents patient and carer demographic information.
Factors influencing therapy
provision
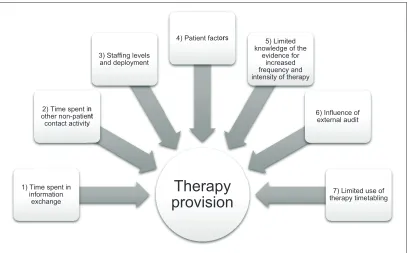
The analysis identified seven major factors (Figure 2), with quantitative data confirming qualitatively derived factors. These factors were interrelated; we separate them here to highlight their influence on providing the recommended frequency and intensity of post-stroke therapy.
1) Familiarisation with the data (reading, and re-reading field-notes, transcripts, memos)
2) Identifying a thematic framework (researchers jointly developing a set of codes organised into categories to manage and organise the data)
3) Indexing (systematically applying the thematic framework to the whole data set)
4) Charting (entering data into Framework matrices: spreadsheets containing cells into which summarised data are entered by codes (columns) and cases (rows))
[image:4.536.63.487.60.205.2]5) Mapping and interpretation (interpretive concepts or propositions describing or explaining aspects of the data are the final output of the analysis)
4
[image:5.536.70.650.133.349.2]Clinical Rehabilitation 00(0)
Table 1. Site characteristics.
Unit Number of beds
Bed types SSNAP rating for therapy provision during study period (OT, PT, SLT)
WTE qualified PT staff per 5 beds (BASP recommendation = 1)
WTE qualified OT staff per 5 beds (BASP recommendation = 1)
WTE qualified SLT staff per 10 beds (BASP recommendation = 1)
Weekly hours per staff member spent in handover/board round (OT/PT only)
Weekly time (hours) per staff member spent in MDT meetings (qualified OT/PT only)
1 67 (5 wards) Hyper-acute, Hyper-acute, rehabilitation
D,D,D 0.45 0.4 0.4 5.2 1.3
2 28 Rehabilitation C,C,E 0.63 0.5 0.43 1.6 No MDT meetings
3 29 Mixed hyper-acute, acute and rehabilitation
B,A,D 0.52 0.41 0.52 0.86 0.65
4 26 Mixed hyper-acute, acute and rehabilitation
C,C,E 0.38 0.38 0.18 1.2 2.2
5 68 (3 wards) Hyper-acute, mixed acute/ rehabilitation
B,D,D 0.57 0.66 0.44 1.7 1.4
6 24 Rehabilitation B,C,E 0.73 0.6 0.25 1.7 1.5
7 24 Hyper-acute/ acute
A,A,A 1.17 1.21 1.13 0.57 0.63
8 36 (2 wards) Hyper-acute, mixed acute/ rehabilitation
A,A,A 0.9 0.76 0.9 2.8 1.25 (mixed acute and
rehabilitation unit only)
Time spent in information
exchange
The most significant factor influencing the amount and frequency of therapy provided in units perform-ing less well in the SSNAP audit was the time thera-pists routinely spent in information exchange activities. These included daily handovers or board rounds where typically, one nurse delivered informa-tion to individual therapists or groups of therapists on a unit. Each handover tended to report on all patients and lasted between 15 and 60 minutes (mean = 32.5, SD = 12.25). Reported information covered new patients, changes in existing patients and planned discharges. Observations indicated that outside of hyper-acute units which had high turnover and length of stay of less than 72 hours, information exchange
activities were repetitious and not always therapy focused; as these staff members noted,
There’s often nothing new to report and sometimes that does seem a waste of time to sit and hear the same thing as the day before. (Stroke co-ordinator, Unit 6)
It’s all mainly medical stuff that gets handed over, they do ask […] discharge questions but I’m not sure if everybody should go on handover. (Occupational therapist, Unit 4)
[image:6.536.65.486.75.399.2]In five units, individual therapists attended rou-tine nurse-led handovers at the start of the daytime shift, before handing over the same information to all other occupational therapists and physiotherapists in
Table 2. Staff demographic data.
Participants (observations; n = 197) Participants (interviews only; n = 131)
Male 31 (15.7%) 19 (14.5%)
Ethnicity
White 180 (91.8%) 120 (91.6%)
Mixed – White and Asian 2 (1%) 1 (0.8%)
Indian 3 (1.5%) 2 (1.5%)
Pakistani 5 (2.6%) 3 (2.3%)
Chinese 1 (0.5%) –
Other Asian background 3 (1.5%) 3 (2.3%)
Black – African 1 (0.5%) 1 (0.8%)
Mean (SD) age in years 35.96 (10.63)a 38.63 (10.56)b
Professional background
Physiotherapy 71 (40%) 40 (30.5%)
Occupational therapy 50 (24.4%) 30 (22.9%)
Speech and language therapy 43 (21.8%) 30 (22.9%)
Generic therapy assistant 8 (4.1%) 5 (3.8%)
Nurse 10 (5.1%) 10 (7.6%)
Physician 7 (3.6%) 7 (5.3%)
Non-clinical manager 8 (4.1%) 8 (6.1%)
Experience level
Student 15 (7.6%) –
Unqualified therapy assistant 33 (16.8%) 21 (16%)
Qualified junior therapist 51 (25.9%) 25 (19.1%)
Experienced therapists or nurse 39 (19.8%) 26 (19.8%)
Senior therapist/senior nurse/ manager
52 (26.4%) 52 (39.7%)
Consultant physician 7 (3.6%) 7 (5.3%)
6 Clinical Rehabilitation 00(0)
an additional session. In the two rehabilitation units, board rounds attended by one or two nurses and all therapists occurred daily (for approximately 1 hour). Speech and language therapists attended nurse-led or therapist-led handovers only in Units 2 and 8.
In the remaining site (Unit 7), two therapists started work 30 minutes before others, receiving a nursing handover from one nurse (10–15 minutes)
[image:7.536.55.476.80.478.2]and then preparing a daily therapy provision schedule (timetable) for all occupational thera-pists and physiotherathera-pists. No further handover occurred and individual therapy was provided according to the timetable; SSNAP data demon-strated that more therapy minutes were routinely delivered in this unit. The mean observed time spent in daily handovers ranged from 34 minutes
Table 3. Patient and carer demographic data.
Patients (8 sites; observations) Carers (8 sites; observations)
n 77 53
Male 34 (44.2%) 20 (37.7%)
Ethnicity
White 74 (96.1%) 53 (100%)
Asian – Bangladeshi 1 (1.3%) –
Other Asian background 1 (1.3%) –
Black – Caribbean 1 (1.3%) –
Mean (SD) age in years 69.42 (13.51) 59.55 (13.62)a
Stroke classification
Left hemiparesis 45 (58.4%)
Right hemiparesis 26 (33.8%)
Other 6 (7.8%)
Speech and language ability
Normal language 35 (45.5%)
Dysphasia 23 (29.9%)
Dysarthria 30 (39%)
Mean (SD) NIHSS score on admission to hospital 10.2 (6.48)b
Mean (SD) length of inpatient stay in days 34.32 (25.04)
Usual living arrangements
Lives alone 32 (41.6%)
Lives with relative/carer 45 (58.4%
Discharge destination
Own home 48 (62.3%)
Relative’s home 1 (1.3%)
Nursing care 13 (16.9%)
Residential care 8 (10.4%)
Died 7 (9.1%)
Carer relationship to stroke survivor
Partner 27 (50.9%)
Child 19 (35.8%)
Parent 4 (7.5%)
Grandchild 1 (1.9%)
Other relative 2 (3.8%)
NIHSS: National Institutes of Health Stroke Scale.
(Unit 7) to 5.2 hours per therapist per week (Unit 1) (Table 1).
Some therapists reported handovers were valu-able provided that the process was based on exchange of information and not simply receipt:
Some days it may feel as though the information that we get is not appropriate, but it’s important that we have handover, as the therapy team, we have our input as well as taking information from them. (Physiotherapist, Unit 4)
Additional information exchange activities included MDT and goal-setting meetings. Typically, only one qualified therapist per discipline attended MDT meet-ings but delays to start times and meetmeet-ings over-run-ning were common. These meetings took up large amounts of therapists’ time in units 1, 4, 5 and 6 where multiple consultant physicians each held weekly MDT meetings (Table 1). When mean time spent in MDT and goal-setting meetings is added to that spent in handovers, qualified therapists each spent between 1.2 and 6.5 hours per week in information exchange activi-ties, with most spending 3–5 hours per week.
Time spent in other non-patient
contact activity
This included planning therapy, documenting ther-apy provided; discharge planning, ordering equip-ment and transport; developing patient and family/ carer training and information packages; supervis-ing and trainsupervis-ing staff. Discharge plannsupervis-ing for patients with complex needs increased administra-tion, which therapists (usually occupational thera-pists) prioritised over face-to-face therapy. As one occupational therapist described
[image:8.536.72.481.62.315.2]We have a large indirect role; because indirect isn’t included in your 45 minutes therapy it’s not part of [achieving] your target, but it is a vital part of somebody’s treatment with us. Sometimes it can take 30 minutes to fill out a bed-rail risk assessment. (Occupational therapist, Unit 4)
In six units, therapy was documented in shared MDT notes. Unit 8 used electronic patient records (EPRs) with no obvious reduction in documenta-tion time. Speech and language therapists in six
8 Clinical Rehabilitation 00(0)
units duplicated therapy provision documentation in departmental records. In units where therapy timetabling occurred (5, 7, 8), documentation time (10–15 minutes) was factored into hour-long scheduled ‘slots’; in the remainder, documenta-tion mainly occurred before 09.30 or after 15.30.
The most time-consuming other non-patient contact activity was duplication of documenta-tion; completion of SSNAP and internal audit records is an example of this duplication. In all units, including that using EPRs, therapists recorded therapy minutes provided per patient on paper records. These were also entered into the on-line SSNAP audit and into internal audit sys-tems, for example, SystmOne. These systems do not allow data sharing. In four units, dedicated clerks entered data, in others therapists or nurses completed data entry.
Staffing levels and deployment
Occupational therapists and physiotherapists were commonly co-located on stroke units; for speech and language therapists, this occurred in only two units (7 and 8). In all sites, speech and language therapists covered more than one ward; in five, they provided services for the whole hospital and community.
We found marked between unit variations in therapist numbers. In all but one unit, these were lower than recommended.1,22 particularly for
speech and language therapists (Table 1). The two units (Units 7 and 8) with the highest therapist numbers had the highest ratings (AAA) for SSNAP therapy domains, indicating more therapy minutes were delivered (Table 1). Even in those units, maintaining or increasing staffing levels and pro-viding therapy consistent with guideline recom-mendations was challenging, as this speech and language therapist suggests:
When you have the staff, you’re able to deal with other things that come up because there’s more of you and you’ve got more time. A couple of weeks ago we were fully staffed, our stats looked amazing, everyone was seen for 45 minutes, we had the groups, that [being fully staffed] really helps. (Speech and language therapist, Unit 8)
In seven of eight units, therapists worked 08.00/08.30 to 16.00/16.30 but rarely provided therapy before 09.30. There were exceptions; occupational therapists in Unit 4 conducted meal-time assessments from 07.30 to 08.00, and in Unit 7 washing and dressing practice occurred before 08.00. Protected patient mealtimes (1 hour) and staff meal breaks (30 minutes taken during pro-tected mealtimes) reduced time available for ther-apy in seven units. In six units, documentation was typically completed after 15.30; little therapy was delivered after this time. In Unit 7, therapists’ start, finish and mealtimes were staggered to extend the working day; protected patient meal-times were reduced (30 minutes). Therapists or therapy assistants were observed supporting patients at mealtimes. While no therapist in Unit 7 worked longer than 7.5 hours per day, they deliv-ered more therapy minutes and achieved ‘A’ rat-ings for physiotherapy, occupational therapy and speech and language therapy.
Six units provided seven-day occupational therapy and physiotherapy and two provided speech and language therapy on six days. Weekend therapy provision occurred mainly in hyper-acute services and focused on meeting SSNAP targets that newly admitted patients should be assessed and managed by at least one member of the specialist rehabilitation team within 24 hours, and all relevant members within 72 hours.13 In three units, weekend services were
covered by stroke unit staff and therapists from the wider hospital/community, or stroke unit staff working overtime. In the other three units, the stroke unit team covered seven-day services; therapists took weekdays off in lieu, which depleted their numbers; some therapists ques-tioned the effectiveness of this:
I think seven-day working is exactly what we should be doing but not how this Trust is doing it because you’re making five day working less effective because you’re just spreading it [therapists] too thinly to tick a box. (Speech and language therapist, Unit 1)
Patient factors
Patient factors divided into two categories: (1) those relating to patients’ condition and (2) those relating to patients’ physical readiness and availa-bility to participate in therapy.
Category 1 factors identified by therapists included clinical instability, post-stroke fatigue and concurrent medical illness. Experienced therapists reported these factors did not mean therapy would be withheld. Instead, they discussed intervention safety with medical and nursing colleagues, com-pleted individual assessments and adapted therapy accordingly, as this physiotherapist comments:
If we feel patients can do more then we’ll try and push them, if we feel a patient is too fatigued, then we like to end on a good note because that’s the carry over they’re going to get. So, we’re restricted by patients’ fatigue rather than NICE guidelines or staffing levels. (Physiotherapist, Unit 2)
Therapists frequently provided shorter, less intensive treatments for fatiguing patients, report-ing that ideally they would return to them later the same day to provide an appropriate overall therapy ‘dose’. As one occupational therapist described,
There are patients who can’t concentrate for that length of time so they’d be better being trained in two or three 10-minute sessions throughout the day which we might try to do. (Occupational therapist, Unit 2)
However, our observations indicated this rarely occurred. Some therapists described conflict between their clinical judgement that these patients could not tolerate longer, more intensive sessions, and their awareness of the guideline recommenda-tion for 45 minutes of therapy daily, fearing the negative impact that regularly recording single short episodes could have on SSNAP performance ratings.
Category 2 factors included patients’ physical preparedness and availability to participate in ther-apy. Ensuring patients were ready for therapy was largely viewed as a nursing role. Numerous factors impacted on the process of ensuring patients were out of bed, had received meals and medication and
were appropriately dressed for scheduled therapy, as one physiotherapist explained:
A lot of the time patients are not ready for the therapy session, so you end up spending half that session getting them out of bed, assisting them, change their pads, nets, pyjamas, by the time you get to do active therapy you’re limited to 15 minutes, so that’s a big factor. (Physiotherapist, Unit 6)
Nursing staff reported better communication could support them in their role:
If the day before, they [therapists] could let us know who they’re going to first in the morning, then obviously nursing staff would be able to prepare for that. (Registered nurse, Unit 2)
As staffing levels were often less than recom-mended (Table 1), this influenced patient prepara-tion; nurses prioritised other tasks; as one ward manager explained,
They [therapists] do a lot of group sessions to try and get the 45 minutes in, if I’m short staffed we may not be able to get a patient up in time … you’re not going to leave [someone who’s been incontinent] in a wet bed, to get a patient up for breakfast club. (Registered nurse, Unit 5)
Therapists’ limited knowledge
of the evidence that increased
frequency and intensity of
therapy improves outcomes
within the first six months after
stroke
Although all therapists were aware of recom-mended daily therapy minutes, few were aware of evidence underpinning the recommendations, or discussed how this informed clinical decision-making and therapy provision. The evidence that more therapy more often is associated with improved outcomes was rarely referenced during observations or in interviews. On occasion, a con-tradictory perspective was voiced:
10 Clinical Rehabilitation 00(0)
therapy is appropriate and that is not going to be the same every day. […] We’ve got to get out of this habit that just because a patient needs physiotherapy that the more they have, the better it is, that’s completely wrong thinking. (Physiotherapist, Unit 5)
However, some therapists’ views indicated knowl-edge of the evidence underpinning recommendations. This comment identified the need to interpret and apply the evidence to specific areas of rehabilitation:
The 45 minutes, doesn’t always fit with my, our model of working, it’s not specific to OT necessarily where it came from, some of the evidence that they’re basing on is very physio-orientated, rather than this type of ward, rehab people going in and out on visits. (Occupational therapist, Unit 2)
All therapists referred to clinical reasoning as the basis for decision-making regarding therapy frequency and intensity. In each unit, this followed patient assessment involving direct observation, ‘hands-on’ assessment, pencil and paper testing (of language, cognition), verbal/written information from colleagues regarding patient engagement, and from patients and their families about pre-stroke functioning. Clinical reasoning was discussed in terms of deciding whether patients were suitable for therapy on specific days and appropriate inter-ventions. Patients’ engagement in and tolerance of particular interventions appeared to be the primary determinant of subsequent therapy provision. Therapists relied on tacit understanding of improve-ment with limited reference to or observed use of validated outcome measures.
Influence of external audit of
stroke services
Therapists described an ambivalent relationship with national audit requirements. They recognised the contribution that the SSNAP has made in improving stroke services, and the value of a ther-apy provision target, as described by this stroke co-ordinator:
It’s better to have some standard about the amount of therapy that patients should be receiving, because that gives a target to work towards and you’re more
likely to give patients adequate therapy […]. That is measured and known throughout your region and to the public, and the Trust is going to be judged upon it. (Stroke co-ordinator, Unit 6)
However, therapists viewed audit of therapy pro-vision as different to other audited targets (with dichotomous responses), for example, whether computerized tomography (CT) scanning was completed within 1 hour of hospital arrival. There was disquiet across disciplines and sites that provi-sion of individualised therapy, and indirectly, the quality of therapy services, was measured and per-formance-rated against a numerical target: as this therapist indicates
It makes me wonder how some units are getting the results they are […] the numbers, the letters [performance rating]. It’s kind of out of your control, but it’s made us, the 72 hour [assessment target] thing, I would never have wanted to stand at the bottom of somebody’s bed and say, ‘oh they’re too poorly to be seen,’ and call that [specialist assessment], but if we do that then it makes a massive difference to the results so, we’ve introduced ourselves to the patient and checked that they’re positioned well within 12 hours of them being admitted. (Physiotherapist, Unit 2)
Despite these reservations, a concern to achieve the ‘45-minute’ target dominated the thinking of senior therapists and therapy services managers, who accounted for SSNAP performance ratings to hospital managers and service commissioners. In contrast, inexperienced therapists, who provided a substantial proportion of therapy, often had very limited understanding of the guideline recommen-dations, the underpinning evidence, the purpose of the SSNAP or the wider purpose of clinical audit. They recorded therapy minutes data routinely but without a clear sense of the purpose or importance of these data.
The SSNAP defines therapy as assessment and/ or treatment (individual or within a group), provided by qualified therapists or supervised assistants.23
was recorded in some units while in others, lead therapists actively directed colleagues not to record these minutes. Similarly, some speech and language therapists were unclear whether time spent docu-menting their recommendations and advising other staff or patients’ families should be recorded. Although the SSNAP provides comprehensive information about completing the audit to registered staff via on-line help pages, few therapists were aware of this or how to access it.
Observations indicated over-estimation and error in SSNAP data entry. We observed 433 ther-apy sessions and accessed SSNAP data for 364. Therapists did not routinely record session start and finish times, typically estimating times after-wards. On average, sessions recorded by physio-therapists, occupational therapists and assistants were 5.48 (SD = 12) minutes longer than observed (t = –8.75, df = 363, p < 0.01). Recording accuracy varied between units and professions. Speech and language therapists recorded a mean session length of 30.34 minutes (SD = 12.82), while observed length was 18.98 minutes (SD = 10.5; n = 44). Where group therapy was provided (five units), therapists recorded a mean of 56.51 minutes (SD = 15.45), compared to an observed mean of 47.28 minutes (SD = 14.54; n = 43).
The SSNAP shaped many therapists’ behav-iour; their focus was on increasing recorded ther-apy minutes to improve performance ratings, rather than on providing more patients with more therapy more frequently. Practices developed spe-cifically to improve performance ratings were observed. These included routine use of joint-working, with therapists from different disciplines treating a patient requiring multiple staff for man-ual handling, and therapy minutes recorded for each discipline ‘active’ in a session. Therapists perceived joint-working to increase efficiency, allowing them to record more minutes; however, it effectively reduced the amount of daily time patients spent in therapy. Group therapy was sometimes used strategically to increase the num-ber of patients treated. In some units, the thera-peutic value of groups was clearly evident and the number of minutes recorded for each discipline appeared appropriate. In others, groups appeared to provide only social stimulation; the number of
minutes recorded was questionable in terms of therapeutic value and therapist involvement, as one physiotherapist stated,
We count [group activity] as contact time, sometimes it feels like a bit of a cheat because I know it’s not therapy, we’re just seeing the patients, making sure they’re okay and seeing them from a mental point of view, trying to perk their moods up. (Physiotherapist, Unit 6)
Although most senior therapists understood the primary purpose of the SSNAP as providing data to drive service improvement, use of data for this pur-pose varied across sites. However, Units 7 and 8 had used their data in business cases to demon-strate the need for and achieve increased staffing levels. They reported that this contributed, along-side other service improvement initiatives, to increased therapy provision.
Limited use of a planned therapy
timetable
Therapists commonly understood ‘timetabling’ to mean weekly allocation of patients’ treatment ses-sions with assigned staff members, at specified times. This occurred in four units: two timetabled daily and two (rehabilitation units) held weekly timetabling meetings. However, whether labelled timetabling or not, therapists in all units spent time planning which patients would receive therapy and who would provide it. A concern highlighted by therapists not timetabling weekly was the perceived time commitment. In practice, when totalled, we observed little difference between weekly (90– 120 minutes) and daily timetabling (90–150 min-utes). Therapists felt daily timetabling should happen after nurse handover so they had informa-tion about who was appropriate for therapy. This often delayed planning until 10 a.m. In seven sites, all physiotherapists and occupational therapists were involved in daily or weekly planning activity.
12 Clinical Rehabilitation 00(0)
involved in timetabling (speech and language ther-apists, dieticians and doctors) using schedules to work around planned therapy. Comments about benefits of timetabling included,
If they are asking [the care staff] to go back to bed, they’ll actually check to make sure they’re not due therapy before they put them back in. (Registered nurse, Unit 6)
Otherwise you clash with another therapist when you want to see them and you waste time. (Physiotherapist, Unit 8)
The net effect of shared timetables was that patients were available for therapy, therapists did not compete for the same time-slot, few sessions were missed and more minutes could be provided.
Discussion
Our findings reveal that a complex array of factors impacts on therapy provision in stroke units. These comprise work organisational and patient factors, and the influence of national audit requirements. While no single factor explained why patients with stroke do not receive the recommended amount of therapy, mean time spent in information exchange and other non-patient contact activity took up between 1.2 and 6.5 hours per therapist per week. Staffing levels for all disciplines were lower in the stroke units in this study than recommended in the National Clinical Guideline for Stroke.1 Therapists’
limited knowledge of the evidence that increased therapy frequency and intensity improves outcomes in the first six months post-stroke was an unexpected finding.
To our knowledge, ReAcT is the largest and most comprehensive study of factors influencing therapy provision in stroke services. The main strengths are sustained, direct observation of the day-to-day work of almost 200 therapists and 77 patients across eight sites providing both hyper-acute services and early hospital-based rehabilita-tion, combined with follow-up interviews with therapists, patients and their carers (n = 230). A limitation is that most were located in the North of England; inclusion of units in other regions may have generated different findings.
Although ReAcT was a UK-based study, it is likely that our findings will be recognised by, and prove relevant for therapists, managers and research-ers in other countries where there are national clini-cal guideline recommendations related to increasing the frequency and intensity of inpatient post-stroke therapy. We recognise that provision of face-to-face or small group therapy by therapists is underpinned by other important activities which collectively con-tribute to high-quality rehabilitation; these include complex discharge planning. Nonetheless, our find-ings draw attention to routine working practices in stroke units, which could be revised to improve effi-ciency, which might allow increased frequency and intensity of therapy, including supervised practice where that is appropriate.
Previous observational studies have reported similar results, with reduced therapy contact time attributed to administrative tasks.15,24 In a European
comparison study, less therapy was provided in the English unit.24 ReAcT contextualises the evidence
in Clinical Guideline recommendations and updates and extends the findings from these impor-tant earlier studies. Our findings indicate that in the last decade, despite major service improvements in acute stroke care in particular, therapists in English stroke units may be spending even more time in information exchange and administration and pro-viding less therapy than their counterparts in com-parable countries.
Single-centre studies of physiotherapists’ deci-sion-making have consistently identified that as well as individual patient factors, established (local) organisational protocols and working practices are influential in shaping decision-making.25–27 We
identified, in a much larger sample of therapists and stroke units, that therapists’ clinical reasoning and awareness of the recommendation for 45 minutes of daily therapy were more influential in shaping ther-apists’ practice than research evidence for increased frequency and intensity.
documentation to use therapists’ time more effi-ciently. Simplifying therapy recording require-ments for national audits and reducing local duplication of documentation would reduce time spent on administration and enable therapists to undertake patient-focused activity. Routine shar-ing of individualised therapy timetables with patients and stroke unit staff may also be benefi-cial. Our study included two high-performing units; both had revised the whole stroke pathway consistent with types of changes highlighted above. While staffing levels are clearly part of the equation, these units and others provide examples of stroke teams as a whole (rather than therapists alone) using audit data and quality improvement methods to improve stroke care. Targeted educa-tion focused on understanding the evidence for and importance of increased frequency and inten-sity is another necessary part of improving post-stroke rehabilitation services.
However, wider service reorganisation may be required which will require action and support from stroke service management groups. In England, the successful Pan-London and Greater Manchester initiatives demonstrate how such changes can be effected at regional level.28 Similar
initiatives focused directly on improving therapy frequency and intensity are also reported in Canada.29 These initiatives highlight the value of
co-ordinated, collaborative approaches to maxim-ising the effectiveness of stroke services.
Clinical Messages
•
• How therapists organise their time has a major influence on face-to-face therapy time.
•
• Much time is spent in non-patient contact activities, especially exchanging information.
•
• Therapists have limited knowledge of the evidence underpinning therapy fre-quency and intensity recommendations.
•
• Therapists use their clinical judgement about individual patients when making decisions.
Declaration of conflicting interests
The author(s) declared the following potential conflicts of interest with respect to the research, authorship and/ or publication of this article: A.H. is Programme Manager for the SSNAP and provided technical infor-mation on SSNAP data collection and analysis. SSNAP is funded by the Healthcare Quality Improvement Partnership on behalf of NHS England. A.D., H.R. and P.T. are members of the Intercollegiate Stroke Working Party who developed the National Clinical Guideline for Stroke, Fifth Edition 2016. The authors declare no other financial relationships with any organisations that might have an interest in the submitted work in the pre-vious three years.
Funding
The author(s) disclosed receipt of the following financial support for the research, authorship and/or publication of this article: This article presents independent research funded by the National Institute for Health Research (NIHR) under its Research for Patient Benefit (RfPB) Programme (grant reference number PB-PG-0213-30019). The views expressed are those of the author(s) and not necessarily those of the NHS, the NIHR or the Department of Health.
Supplement material
Supplement material is available for this article online.
ORCID iDs
David J Clarke https://orcid.org/0000-0001-6279- 1192
Louisa-Jane Burton https://orcid.org/0000-0003- 3617-1410
Sarah F Tyson https://orcid.org/0000-0001-6301- 8791
References
1. Intercollegiate Stroke Working Party. National clinical
guideline for stroke. 5th ed. London: Royal College of
Physicians, 2016.
2. Hebert D, Lindsay MP, McIntyre A, et al. Canadian stroke best practice recommendations: stroke rehabilitation practice guidelines, update 2015. Int J Stroke 2016; 11(4): 459–484. 3. National Stroke Foundation. Clinical guidelines for stroke
management 2017. Melbourne, VIC, Australia: National
Stroke Foundation, 2017.
health-14 Clinical Rehabilitation 00(0)
care professionals from the American Heart Association/ American Stroke Association. Stroke 2016; 47(6): e98– e169.
5. De Wit L, Putman K, Lincoln N, et al. Stroke rehabili-tation in Europe: what do physiotherapists and occu-pational therapists actually do? Stroke 2006; 37(6): 1483–1919.
6. Schneider EJ, Lannin N, Ada L, et al. Increasing the amount of usual rehabilitation improves activity after stroke: a systematic review. J Physiother 2016; 62(4): 182–187.
7. Lohse KR, Lang CE and Boyd LA. Is more better? Using metadata to explore dose-response relationships in stroke rehabilitation. Stroke 2014; 45(7): 2053–2058.
8. Kwakkel G, van Peppen R, Wagenaar RC, et al. Effects of augmented exercise therapy time after stroke a meta-analysis. Stroke 2004; 35(11): 2529–2539.
9. Veerbeek JM, van Wegen E, van Peppen R, et al. What is the evidence for physical therapy poststroke? A sys-tematic review and meta-analysis. PLoS ONE 2014; 9(2): e87987.
10. Brady MC, Kelly H, Godwin J, et al. Speech and language therapy for aphasia following stroke. Cochrane Database
Syst Rev 2016; 6: CD000425.
11. Lang CE, Strube MJ, Bland MD, et al. Dose response of task-specific upper limb training in people at least 6 months poststroke: a phase II, single-blind, randomized, controlled trial. Ann Neurol 2016; 80(3): 342–354. 12. Winstein CJ, Wolf SL, Dromerick AW, et al. Effect of
a task-oriented rehabilitation program on upper extremity recovery following motor stroke: the ICARE randomized clinical trial. JAMA 2016; 315(6): 571–581.
13. Royal College of Physicians, Clinical Effectiveness and Evaluation Unit on behalf of the Intercollegiate Stroke Working Party. Sentinel Stroke National Audit Programme: clinical audit December 2016–March 2017. Public Report, Royal College of Physicians, London, June 2017.
14. Otterman NM, van der Wees PJ, Bernhardt J, et al. Physical therapists’ guideline adherence on early mobi-lization and intensity of practice at Dutch acute stroke units a country-wide survey. Stroke 2012; 43(9): 2395– 2401.
15. Foley N, McClure JA, Meyer M, et al. Inpatient rehabili-tation following stroke: amount of therapy received and associations with functional recovery. Disabil Rehabil
2012; 34(25): 2132–2138.
16. Stroke Foundation. National stroke audit – rehabilitation
services report 2016. Melbourne, VIC, Australia: Stroke
Foundation, 2016.
17. Clarke DJ, Tyson S, Rodgers H, et al. Why do patients with stroke not receive the recommended amount of active therapy (ReAcT)? Study protocol for a multisite case study investigation. BMJ Open 2015; 5(8): e008443. 18. Trebble TM, Hansi N, Hydes T, et al. Process mapping the
patient journey through health care: an introduction. BMJ
2010; 341(7769): 394–397.
19. Hammersley M and Atkinson P. Ethnography: Principles
in Practice. London: Routledge, 2007.
20. Clarke DJ, Hawkins R, Sadler E, et al. Introducing structured caregiver training in stroke care: findings from the TRACS process evaluation study. BMJ Open 2014; 4(4): e004473. 21. Ritchie J, Lewis J, Nicholls CM, et al. Qualitative
research practice: a guide for social science students and
researchers. Thousand Oaks, CA: SAGE, 2013.
22. British Association of Stroke Physicians. Stroke
ser-vice standards. London: British Association of Stroke
Physicians, 2014.
23. Royal College of Physicians. Sentinel Stroke National Audit Programme: therapy related questions and
help-notes. London: Royal College of Physicians, 2016.
24. De Wit L, Putman K, Dejaeger E, et al. Use of time by stroke patients a comparison of four European rehabilita-tion centers. Stroke 2005; 36(9): 1977–1983.
25. McGlinchey MP and Davenport S. Exploring the deci-sion-making process in the delivery of physiotherapy in a stroke unit. Disabil Rehabil 2015; 37(14): 1277–1284. 26. Smith M, Higgs J and Ellis E. Physiotherapy decision
making in acute cardiorespiratory care is influenced by factors related to the physiotherapist and the nature and context of the decision: a qualitative study. Aust J
Physiother 2007; 53(4): 261–267.
27. Jette DU, Grover L and Keck CP. A qualitative study of clinical decision making in recommending discharge placement from the acute care setting. Phys Ther 2003; 83(3): 224–236.
28. Ramsay AI, Morris S, Hoffman A, et al. Effects of central-izing acute stroke services on stroke care provision in two large metropolitan areas in England. Stroke 2015; 46(8): 2244–2251.
29. Ontario Stroke Network. Ontario stroke evaluation report
2016: a focus on stroke rehabilitation. Toronto, ON,