Closing the low-carbon material loop using a dynamic whole system
approach
Jonathan Busch
a,*, David Dawson
b, Katy Roelich
a,b aSustainability Research Institute, University of Leeds, Leeds, UKbInstitute for Resilient Infrastructure, University of Leeds, Leeds, UK
a r t i c l e i n f o
Article history:
Received 4 November 2016 Received in revised form 22 February 2017 Accepted 22 February 2017 Available online 23 February 2017
Keywords: Circular economy Low carbon infrastructure Critical materials
Socio-economic metabolism
a b s t r a c t
The transition to low carbon energy and transport systems requires an unprecedented roll-out of new infrastructure technologies, containing significant quantities of critical raw materials. Many of these technologies are based on general purpose technologies, such as permanent magnets and electric mo-tors, that are common across different infrastructure systems. Circular economy initiatives that aim to institute better resource management practices could exploit these technological commonalities through the reuse and remanufacturing of technology components across infrastructure systems. In this paper, we analyze the implementation of such processes in the transition to low carbon electricity generation and transport on the Isle of Wight, UK. We model two scenarios relying on different renewable energy technologies, with the reuse of Lithium-ion batteries from electric vehicles for grid-attached storage. A whole-system analysis that considers both electricity and transport infrastructure demonstrates that the optimal choice of renewable technology can be dependent on opportunities for component reuse and material recycling between the different infrastructure systems. Hydrogen fuel cell based transport makes use of platinum from obsolete catalytic converters whereas lithium-ion batteries can be reused for grid-attached storage when they are no longer useful in vehicles. Trade-offs exist between the efficiency of technology reuse, which eliminates the need for new technologies for grid attached storage completely by 2033, and the higherflexibility afforded by recycling at the material level; reducing pri-mary material demand for Lithium by 51% in 2033 compared to 30% achieved by battery reuse. This analysis demonstrates the value of a methodology that combines detailed representations of technolo-gies and components with a systemic approach that includes multiple, interconnected infrastructure systems.
©2017 The Authors. Published by Elsevier Ltd. This is an open access article under the CC BY license (http://creativecommons.org/licenses/by/4.0/).
1. Introduction
Limiting climate change to the internationally agreed temper-ature rise of 2.0C on preindustrial levels (United Nations, 2015) will require the almost complete decarbonization of energy and transport infrastructure over the next 35 years (Mulugetta et al., 2014). The scale and rate of this infrastructure transition is un-precedented and, given the high material intensity of infrastruc-ture, it will have a significant impact on the material use of nations (Fishman et al., 2016). Furthermore, the necessity to embed low-carbon technologies into infrastructure involves the use of a wider range of materials than has historically been the case
(Greenfield and Graedel, 2013), including rare earth elements (such as neodymium (Du and Graedel, 2011) and dysprosium (Elshkaki and Graedel, 2014) in wind turbines and tellurium and indium in solar panels (Helbig et al., 2016)) as well as cobalt, lithium and platinum group metals. Some of these materials have been labelled as ‘critical’ due to the resulting high risk of supply disruption (British Geological Survey, 2012), causing concern for US (United States Department of Energy, 2010) and EU (Moss et al., 2011) policy makers, and driving academic research to identify poten-tially critical materials (see e.g (Erdmann and Graedel, 2011; Roelich et al., 2014).). A recognition of the economic importance of critical materials, and the environmental impacts associated with material consumption (Behrens, 2016) highlights the need for more efficient management of material resources. In the context of the climate change challenge and increasing environmental burden of material extraction and waste production, the concept of a *Corresponding author. University of Leeds, Woodhouse Lane, Leeds, LS2 9JT, UK.
E-mail address:[email protected](J. Busch).
Contents lists available atScienceDirect
Journal of Cleaner Production
j o u r n a l h o me p a g e :w w w .e l se v i e r. co m/ lo ca t e / jc le p r o
http://dx.doi.org/10.1016/j.jclepro.2017.02.166
‘circular economy’ isfinding increasing interest across academia (see (Ghisellini et al., 2016) for a recent review) and in policy and industry spheres. At the core of the concept is the idea that the currently dominant linear path of products and materials from production through use to disposal is replaced by a circular path of production, use and recovery. China has held the circular economy as a development goal since 2009 (Mathews and Tan, 2011a), the European Commission published a circular economy action plan in 2015 (European Commission, 2015) and industry interest is re-flected in recent reports from major international consultants (e.g. Accenture, 2014; McKinsey & Company, 2015) and the Ellen MacArthur Foundation (2013).
Whilst these reports and policy initiatives draw on national scale assessments of sustainable material use, their focus is on promoting innovation on the micro level of individual products, processes andfirm business models (Su et al., 2013), and the meso level of connectingfirms to productively use each other's waste products in eco-industrial parks (Mathews and Tan, 2011b). The link between micro and meso level initiatives and the need to scale material use to remain within planetary boundaries (Steffen et al., 2015) is, however, left vague or unaddressed. More systemic ap-proaches to instituting a transition to a circular economy can draw on several decades of academic work in industrial ecology, ecological economics and related disciplines. These have addressed topics including the physical basis of the economy (see ( Fischer-Kowalski and Huttler, 1999) for a review of research between 1970 and 1998 and (Pauliuk and Hertwich, 2015) for a recent dis-cussion) and its sustainable scale (Weisz€acker et al. (1997) and Schmidt-Bleek (2008)have argued for a factor four and factor ten reduction in material intensity), industrial production and con-sumption patterns and practices that minimize environmental impacts (e.g. cradle-to-cradle design (Braungart et al., 2007; McDonough and Braungart, 2002) and the performance economy (Stahel, 2006)), and the dynamics of material accumulation and waste generation in infrastructure (Pauliuk et al., 2012b) and the built environment (Müller, 2006).
Industry and policy approaches draw most directly on eco-efficiency (Ehrenfeld, 2005) with a focus on maximizing the effi -ciency of value creation from resources through innovations in product design, reuse and remanufacturing, and materials recycling (see e.g (Accenture, 2014)). This is also reflected in circularity in-dicators, e.g. (Ellen MacArthur Foundation and Granta Design, 2015), which are primarily based on material flow accounting, lifecycle analysis and supply chain risk analysis. Academic studies mainly focus on interventions to products and processes to enhance circularity; such as enhancing the recovery of resources
from post-consumer waste (Singh and Ordonez, 2015~ ),finding uses for specific waste streams such as sewage sludge ash (Smol et al., 2015), or designs that promote product life extension (Bakker et al., 2014). Whilst this approach, and the methods it employs, give valuable insights into strategies for enhancing the circularflow of material resources in products, and reducing environmental impacts, its application to the resource basis of large-scale infra-structure such as energy and transport systems is not straightfor-ward. Infrastructure, unlike consumer goods, is long-lived and highly interdependent. Materials are embedded in use for periods of decades, or even centuries, only then becoming available for recovery and reuse. Furthermore, the deployment of infrastructure, particularly in energy systems, is subject to long term planning that must take its interaction with other systems into account.
As the concept of the circular economy has taken hold in policy and industry discourses, the concept ofsocio-economic metabolism has emerged as a research paradigm in sustainable development (Pauliuk and Hertwich, 2015). Socio-economic metabolism can be defined as“the set of all anthropogenic flows, stocks, and trans-formations of physical resources and their respective dynamics assembled in a systems context” (Pauliuk and Müller, 2014). In contrast to the circular economy perspective, socio-economic metabolism is explicitly concerned with the total scale of physical resources in the economy and their dynamics. In the context of transitions to low carbon infrastructure systems, this is important because it recognizes the absolute scale of material resource re-quirements, and also the importance of the long lifetimes of in-use stocks that are a significant determinant of the future requirements of primary resources and availability of secondary resources (Voet et al., 2002). Previous work has shown that recycling and reuse can significantly reduce reliance on critical materials in the long term, but there is the potential for a fundamental conflict between the adoption of new infrastructure technologies with novel mate-rial makeup and a circular economy with closed matemate-rialflow loops (Busch et al., 2014).
As complementary approaches, the circular economy and socio-economic metabolism represent a respectively micro and macro focused analysis of sustainable resource management. Circular economy perspectives provide an analysis of technological and process details lacking in socio-economic metabolism, whereas socio-economic metabolism addresses the scale and temporal dy-namics of resourceflows in an entire economy or industrial sector. Emblematic of the gap between circular economy and socio-economic metabolism perspectives is the issue of ‘general pur-pose technologies’(GPTs), and the potential they hold for systemic efficiencies in material use. GPTs are widely discussed in the innovation systems literature (Lipsey et al., 2006) in reference to significant technological inventions that have a broad range of applicability and whose invention and widespread adoption are related to significant economic and social transformations (techno-economic paradigm shifts) (Perez, 2009). Often quoted examples of GPTs include steam power, electricity and information and communication technologies. Renewable energy technologies have now been proposed as new GPTs and the basis for a new techno-economic paradigm (Mathews, 2013).
Renewable energy infrastructure relies on a number of tech-nological components that could be described as GPTs. Permanent magnets, which contain neodymium and dysprosium, are widely used in electric motors and generators in electric vehicles and wind turbines as well as a variety of non-energy applications. Li-ion rechargeable batteries, which contain lithium and cobalt, are used in electric vehicles and grid attached storage as well as mobile phones and laptop computers. The breadth of use of these tech-nologies across the supply and demand side of energy systems exacerbates the criticality of the materials they contain, but could Acronyms
CCS Carbon capture storage
DECC Department for Energy and Climate Change EV Electric battery vehicle scenario
GPT General Purpose Technology GDP Gross Domestic Product
HF Hydrogen fuel cell vehicle scenario ICE Internal Combustion Engine LCA Life Cycle Assessment Li-ion Lithium-ion
NdFeB Neodymium Iron Boron PV Photovoltaic
also be an opportunity for a more efficient use of resources. In this paper, we seek to address the issue of efficient resource management in low carbon infrastructure transitions where GPTs containing critical materials play an important role. A number of methodologies have been applied in recent literature to address the role of materials in sustainability transitions, representing both the micro- and meso-scale perspective of the circular economy para-digm and the macro-level perspective of the socio-economic metabolism paradigm. The most common of these are based on some variant of materialflow analysis (MFA) or life-cycle assess-ment (LCA). Standard MFA and LCA approaches have proven useful for assessing current resource management practices e for example,Ciacci et al. (2015)use MFA to quantify the fraction of metals‘lost by design’and Golev and Corder (2016)to quantify metalsflows in the Australian economyeand informing the design of alternative management practices (see Allesch and Brunner (2015) and Laurent et al. (2014) for recent reviews of MFA and LCA respectively), but their static nature and failure to account for future changes to electricity supply (as well as other) in-frastructures limits their use in analyzing dynamic transitions. Two significant enhancements of MFA and LCA methodologies have been developed to address these shortcomings. Consequential LCA, as compared to standard comparative LCA, integrates the detailed life cycle analysis of the target system to an aggregate representa-tion of the wider economy (Earles and Halog, 2011). In such ap-proaches, the wider economy can be integrated as scenarios that exogenously determine the evolution of connected infrastructures and environments (Hertwich et al., 2014), or as coupled economic models that endogenize the macroeconomic consequences of in-terventions (Igos et al., 2015). Dynamic MFA, meanwhile, attempts to track the temporal changes in material stocks andflows over long time periods. This is particularly relevant for infrastructure systems and the built environment where materials can remain embedded in in-use structures for periods of many decades. A number of studies have analyzed the consequences of this for pri-mary material demand from low carbon power generation (Elshkaki and Graedel, 2013; Kleijn et al., 2011) and low carbon energy and transport systems (Alonso et al., 2012a, 2012b). Some studies have included analyses of resource recovery potentials, for example from automotive aluminum (Løvik et al., 2014), and the consequences for emissions pathways (Liu et al., 2011).
The specific research gap we seek to address in this paper is between socio-economic metabolism studies which address the systemic scale of energy system transitions but lack the ability to analyze the reuse of technology components and circular economy studies which lack the systemic perspective. Our focus is on the material and technology constitution of infrastructure systems, and the more efficient use of these resources in a circular economy. A dynamic MFA approach is more suited to this than alternatives (such as consequential LCA) as it accounts for the effect of long lifetimes of infrastructure technologies. In previous work, the au-thors demonstrated a dynamic material and technology component stocks andflows model that can analyze the reuse of technology components as well as the recycling of their material constituents (Busch et al., 2014). In this paper we show that this model can be applied to study the reuse of technology components across different infrastructure systems that share a common technological basis, a problem that is often discussed qualitatively (e.g (Brand et al., 2012).), but has not before been studied quantitatively. The benefits and limitations of technology component reuse and remanufacturing and material recycling in an infrastructure tran-sition can thus be assessed. As well as this methodological demonstration, we also contribute to the conceptualization of GPTs in technological innovation and development, with an operation-alizing of the concept in the context of circular economy strategies.
The next section details the site, scenarios and the treatment of data used to estimate the critical material demands for an infra-structure transition (Section3). Section4compares the material dependencies inherent to each scenario and the potential for reducing these dependencies in a circular economy, before the conclusions of the study are presented in Section5.
2. Materials, methods&treatment of data
In this study, we consider the transition to decarbonized elec-tricity generation and transport systems on the Isle of Wight, UK. The island is located off the south coast of England in the English Channel, and has an enhanced potential for a wide variety of renewable energy generation technologies, for example, exploiting strong tidal currents, extended sunshine hours (Met Office, 2014), geothermal reservoirs for district heating or power (Ecoisland Partnership, 2012). The relatively small size of the island is also well suited to the limited drive range of currently available electric vehicles. In some cases the adoption of low carbon technologies is already proceeding at a considerable pace: there are a number of solar photovoltaic (PV) farms already operating on the island and rooftop PV installations per capita are far above the UK average (DECC, 2014a). The island scale also provides benefits for the study in terms of deriving a relatively simple electricity and transport system transition scenario. Due to the islands natural boundaries and potential for renewables we are able to dismiss certain choices in energy supply technologies (e.g. fossil fuels with carbon capture and storage and nuclear), and assume that grid attached storage is restricted to technologies that are feasible given the scale and ge-ography of the Isle of Wight. Furthermore, at this local scale we are able to include realistic assumptions of the potential supply of GPTs, and more simplified synergies between renewable technologies and potential recycling and reuse options that would be more complex at a national level. The implications that these limitations have on the potential upscaling of this study to a national context are addressed in the discussion section.
To calculate the future demand for materials and technologies we require technology roll-out scenarios based on the electricity and transport demand and supply requirements of the island over the transition period we study. The hierarchy and estimated ma-terial intensities (e.g. kilograms per unit or kilograms per mega-watt) of technologies, components and the materials in the system can then be established, along with the expected lifetime of each technology, component and material. Finally, the recyclability or reusability of each component and material embedded in the technology roll-out scenarios can be established and analyzed. Details of the data and approach are provided below and inTable 1, further details are provided in the supporting information.
(HM Government, 2011a). This scenario is best aligned with the likely future of Isle of Wight's energy system for two reasons. Firstly, the scenario aligns with the island's renewable generation potential (Ecoisland Partnership, 2012) and potential for electric vehicle use. Secondly, it does not include large-scale nuclear or fossil fuel plants with CCS which are not feasible on the island scale but characterize the alternative scenarios. The DECC‘Renewables’ scenario was scaled down from national to Isle of White scale using details on the future demand for electricity from buildings, trans-port and industry; and the technologies used in the supply and demand side.
Details of the roll-out of technologies used for electricity gen-eration are also contained in the DECC scenario. Although we as-sume the same technologies are used throughout the period of analysis, we change their roll-out according to more granular data from other sources. These alterations are described in more detail in the following sections.
The DECC Renewables scenario includes two general technolo-gies for low carbon transport, namely hydrogen fuel cells and electric batteries. At a national scale, these technologies both play a significant role by 2050. We assume that it is unlikely that both battery electric vehicles and hydrogen fuel cell vehicles will gain significant market share on the island because both require sig-nificant supporting energy carrier infrastructures.
For renewable electricity generation, the DECC Renewables scenario includes a wider range of technologies: wind turbines, solar photovoltaics (PV) (rooftop and farms), micro-wind, tidal, energy from waste and geothermal. In this study we are primarily interested in highlighting potential synergies that exist between energy supply technology and transport demand technologies, and we therefore focus on technologies that share similar/identical materials or components. For example, both wind turbines and electric vehicles use permanent magnets that require the critical rare-earth material neodymium. Solar PV plays an important role in the energy generation scenario we use but we do not include this technology or the materials it contains in our analysis. This is because solar PV technologies and materials are contained only in
this infrastructure and therefore offer opportunities only for closed loop recycling, and not the cross-system reuse and recycling that is the focus of our study.
Based on these considerations we construct two scenarios for the low carbon electricity and transport transition on the Isle of Wight based on a hydrogen fuel cell or electric battery vehicle choice for transport. These two scenarios are denoted:
EVTransport uses battery electric vehicles.
HFTransport uses hydrogen fuel cell vehicles.
The next step is to establish the driver of demand for these technologies: the demand and supply of electricity and transport services on the island.
2.1. Electricity demand
The DECC Renewables pathway disaggregates national elec-tricity demand into six categories: industrial; commercial heating and cooling; commercial lighting and appliances; domestic heat-ing; domestic lighting and appliances; and transport. To downscale the national estimates to the island level we need scaling factors to apply to each of these demand categories that represent the frac-tion of nafrac-tional demand that the Isle of Wight requires. For do-mestic demand, we scale proportionally by the number of households on the island, and for commercial and industrial de-mand by relative GDP. Both the number of households and GDP are assumed to grow at the same rate as the national averages assumed in the DECC scenarios. To derive transport demand scenarios for the Isle of Wight, we use a scaling factor calculated by dividing the vehicle-km travelled on the Isle of Wight by the national total. Again, the growth in transport demand on the island is in direct proportion to national demand growth.
2.2. Electricity supply
[image:4.595.32.556.94.225.2]The supply scenario is derived from a combination of the DECC
Table 1
A listing of the infrastructures, technologies and materials included in the stocks andflows model. Material intensities, recycling and reuse rates. and lifetimes are given for each technology object or component. Values are taken from a variety of sources, listed in the Supporting Information.
Infrastructure Technology Structures
Technology Components
Materials Material Intensity Recycling Rates (current/ estimated)
Reuse Rate
Life time
Internal Combustion Engine Vehicles
Car, Bus, Van Catalytic Converter Platinum 0.0015e0.0025 kg/vehicle 55/90 N/A 13±3 years
Electric Vehicles Electric Car, Bus, Van Li-ion Battery Lithium 0.14e0.52 kg/kWh 0/70 100 8±2 years Cobalt 0e0.39 kg/kWh 0/90
NdFeB motor magnet Neodymium 0.22e1.7 kg/vehicle 1/80 N/A 13±3 years Hydrogen Vehicles Hydrogen Car, Bus, Van Hydrogen Fuel Cell Platinum 0.005e0.0125 kg/vehicle 0/90 N/A 13±3 years
NdFeB motor magnet Neodymium 0.22e1.7 kg/vehicle 1/80 N/A
Hydrogen Electrolysis Electrolysis Unit Platinum 0.05e0.125 kg/MW 0/90 N/A 13±3 years Wind Generation Offshore Turbines NdFeB generator
magnet
Neodymium 150-203 kg/MW 1/80 N/A 25±5 years
Grid Storage Li-ion Batteries Lithium, Cobalt Same as Electric Vehicle N/A 8±2 years
Table 2
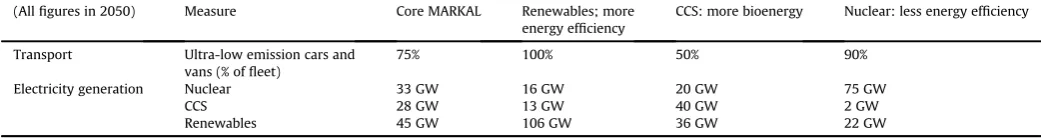
Summary of 2050 futures in DECC's low carbon transition pathways (HM Government, 2011a).
(Allfigures in 2050) Measure Core MARKAL Renewables; more energy efficiency
CCS: more bioenergy Nuclear: less energy efficiency
Transport Ultra-low emission cars and vans (% offleet)
75% 100% 50% 90%
Electricity generation Nuclear 33 GW 16 GW 20 GW 75 GW
CCS 28 GW 13 GW 40 GW 2 GW
[image:4.595.32.553.267.336.2]Renewables scenario and opportunities specific to the Isle of Wight. Alterations are made to the DECC transition to accommodate planned infrastructure deployment and with the goal of achieving an annual average balance between supply and demand by 2050. Alterations for specific technology roll-out of solar PV and wind turbines are based on a number of sources including data on existing installations from DECC (DECC, 2014a), and estimates of potential capacities taken from publications from the local council (for full details of sources see the supporting information). To bal-ance the intermittent energy generation inherent to solar PV and wind turbines, we also include grid-attached storage in the island's energy system. The capacity of storage is set to equal 12 h of annual average generation from intermittent sources, i.e. rooftop PV, PV farms, micro-wind turbines and wind farms (Rudolf and Papastergiou, 2013). In the case of an electric battery-based trans-port system the grid attached storage is assumed to be provided by the same type of lithium-ion batteries as are used in the vehicles (Fthenakis and York, 2012). Our hydrogen fuel cell based scenario assumes a corresponding increase in electrolysis capacity on the island.
2.3. Technologies and materials
The two technology scenarios each contain a variety of mate-rials, many of which are identified as being‘critical’in previous assessments. To analyze the demand for these materials, and the potential for recycling or reuse to reduce that demand, we use a hierarchical stocks andflows (S&F) modelfirst developed inBusch et al. (2014). The model dynamics are driven by scenarios that define the level of infrastructure service that is to be provided over the study period. These infrastructure services include, for example, the amount of electricity generated from a renewable energy source (in units of kWh) or the amount of passenger road transport (in passenger km). These services are provided by infra-structure technologies, such as wind turbines or electric vehicles. The technologies can be composed of components, such as Li-ion batteries or permanent magnets, and both technologies and com-ponents are composed of materials. The hierarchical nesting of components can include several layers. Both technologies and components have a given lifetime, with an uncertainty range which is modelled using a Gaussian distribution. The model calculations at each time step begin at the top of the hierarchy, setting the stocks of infrastructure technologies to provide the level of service required by the scenarios. The outflow O of technology m at time t is determined by the outflow equation (the same procedure applies also to components and materials):
OmðtÞ ¼
Zt
t0
d
k
Lmðk;
tÞImðk
Þwhere the integral covers all previous times that technologies have been installed,Lmð
k
;tÞis the lifetime function that gives the fraction of technologies installed at timekthat reach end-of-life at timet, andImðk
Þis the amount of technologymthat was installed at timek
. The required inflow ImðtÞof new technology (or component or material) is then determined by the balance equation:ImðtÞ ¼dtdKmðtÞ þOmðtÞ
whereKmðtÞis the in-use stock of technologym. When a technology or component reaches end-of-life any components or materials that are embedded in it also reach end-of-life. Reuse of component and recycling of materials is represented in the model by making a
fraction of the end-of-life outflow of components and materials available as secondary inflows that substitute for primary inflows. The complete set of equations required to account for the hierar-chical setup of the model are explained in detail inBusch et al. (2014).
Table 1lists the technologies and components included in the model and the critical materials they contain. We quantify material demand for only those considered critical, and consequently the potential reductions in demand achievable through component reuse or material recycling. Internal combustion engine vehicles that dominate the current in-use vehicle stocks are included as they represent a significant source of platinum for recycling at end-of-life.
2.4. Recovery and reuse of materials and technology components
As our analysis seeks only to quantify material efficiency and not cost or environmental impacts we do not distinguish in terminol-ogy between reuse and remanufacturing. The term reuse is used in this paper to refer to any process whereby a technology component can be recovered at end of life and used for the same or an alter-native purpose without decomposition into material constituents and production of new components. For both recycling and reuse we model the maximum achievable rates using demonstrated technologies and assume extremely high collection efficiencies. The resulting reuse and recycling rates therefore reflect only the tech-nological dimensions of recycling processes and not the economic and social factors that are responsible for substantially lower real-world recycling rates (Reck and Graedel, 2012). This is consistent with the intent of this study to demonstrate the optimal technical potential of a circular economy subject to technical trade-offs.
To quantify the potential for secondary materials and compo-nents to replace for primary demand the model allows for the re-covery of end-of-life components and materials that substitute for their primary requirements. To demonstrate this at the component scale we reuse Li-ion batteries from electric vehicles for grid-attached storage of the islands' generated electricity, this process does not involve any form of remanufacturing. At the material level, we consider the possibility of recycling platinum from catalytic converters and hydrogen fuel cells, lithium and cobalt from Li-ion (lithium-ion) batteries and neodymium from NdFeB (neodymium iron boron) permanent magnets in motors and generators. The recycling rates used in our analysis consider technological feasi-bility and collection rates only; other relevant social and economic considerations are outside the scope of this study.
At present recycling rates of most of the materials we study are relatively low (SeeTable 1). Only platinum is recycled at a signifi -cant rate: about 50% globally (UNEP, 2011). However, the collection efficiencies of some low carbon technologies in the future could be much higher, for example, end-of-life vehicles enter a highly regulated waste stream with a very high collection efficiency (European Commission, 2000; European Commission - DG Environment, 2014). This regulatory environment should enable high collection efficiencies for the platinum, lithium, cobalt and neodymium contained in those vehicles. In the case of fuel cells and wind turbines, the value of the platinum and the large permanent magnets they contain is likely to lead to high collection efficiencies, although the current number of fuel cells and wind turbines reaching end-of-life is still relatively small.
et al., 2006). Recycling rates for lithium and cobalt from Li-ion batteries are assumed to be 70% and 90% respectively, based on laboratory proven techniques (Kushnir and Sanden, 2012; Xu et al., 2008). Neodymium recycling rates are currently at less than 1%, due primarily to a lack of incentives (UNEP, 2011). Given the technical feasibility for neodymium recycling exceeds 90% efficiency (Binnemans et al., 2013; Walton et al., 2015), we assume a total recycling rate of 80%.
As mentioned earlier, at the component scale our analysis con-siders a system where an electric battery is reused for grid-attached storage at the end of their service life. Once the battery reaches its end of life (8 years), a 30% reduction in capacity makes them un-suitable for vehicles (Fernandez et al., 2013). In grid-attached storage, however, weight is not a consideration so the batteries are still useful despite their reduced capacity. Commercial solutions are already available for this conversion (ABB, 2014), and we as-sume all end-of-life vehicle batteries are recovered and used for grid attached storage. The recycling and reuse rates used in this study are extremely optimistic and represent the highest possible rates in an idealized circular economy. Although this may limit the realism of the results, it serves to illustrate the potentials and trade-offs in recycling and reuse strategies that this study is intended to highlight.
3. Results
Each of the two scenarios involves a dependence on a different set of materials in varying quantities (seeTable 1). In the following, wefirst present the total demand and in-use stock of each scenario, the results of material recycling and component reuse on the pri-mary demand for materials are then presented.
3.1. Material demands and in-use stocks
Lithium and cobalt are contained in the same component, the Li-ion battery, and therefore have the same shape of demand curve. Only the scale is different. For this reason, only the stocks andflows of lithium and platinum under the EV and HF scenarios respectively are shown inFig. 1.
In the transition to electric battery vehicles, demand for plat-inum falls rapidly and after 2020 the outflow of platinum is higher than the inflow. The demand for lithium in contrast increases rapidly, going from zero in 2010 to about 110,000 kg per year in 2040. This is equivalent to 700 g of lithium per capita, up from the 2014 global average consumption of less than 4 g (British Geological Survey, 2016). For cobalt, the demand, in use stocks and outflow follow the same patterns as Lithium reaching a demand of 63,000 kg per year in 2040. This is equivalent to 460 g of cobalt per capita, a 780% increase on the approximately 59 g per capita apparent consumption in 2010 (British Geological Survey, 2010). The results also show that there will be significant quantities of lithium and cobalt coming out of use at end-of-life and potentially available for recycling.
Alternatively, the transition to hydrogen fuel cell vehicles for transport and hydrogen fuel cell grid attached storage does not involve technologies containing lithium or cobalt, but an increase in demand for platinum. Demand for platinum increases rapidly be-tween 2010 and 2020 before leveling off to a value of around 200 kg per year. Fluctuations around this value take the form of oscillations resulting from an initially rapid adoption of fuel cell technologies, thefirst generation of which then all reach end-of-life approxi-mately 13 years later causing another peak in demand for replacement. 200 kg is equivalent to 1.45 g of platinum per capita, approximately the amount contained in a catalytic converter. The outflow of platinum from end-of-life technologies is also shown in
Fig. 1. In the EV scenario, the outflow of platinum exceeds demand after 2020 indicating that recycling could completely substitute primary demand. In the HF scenario platinum outflows are also significant and almost equal to demand after 2030.
The final material included in this analysis is neodymium. Neodymium is used in both transport and electricity supply tech-nologies; namely in the permanent magnets used in both electric vehicle motors and wind turbine generators. The demand, in-use stocks and end-of-life outflows of neodymium for the two sce-narios are shown inFig. 2.
The demand for neodymium is lower in the EV scenario than the HF scenario for two reasons. First, there is an increase in neo-dymium demand for motors in hydrogen fuel cell vehicles as there are no hydrogen hybrids so all hydrogen fuel cell vehicles use battery electric vehicle sized motors and none of the smaller plug-in hybrid vehicle motors that are plug-included plug-in the EV scenario. Second, the lower efficiency of hydrogen fuel cell vehicles neces-sitates a higher scale of roll-out of wind turbines. The peak demand of 3900 kg of neodymium per year is equal to a 27 g per capita consumption, added to the approximately 5 g per person con-sumption in the UK in 2010 (although this is based on direct import statistics only) (British Geological Survey, 2010). The outflow of end-of-life neodymium begins to increase only from 2030 onwards, but by 2035 it is almost equal to demand.
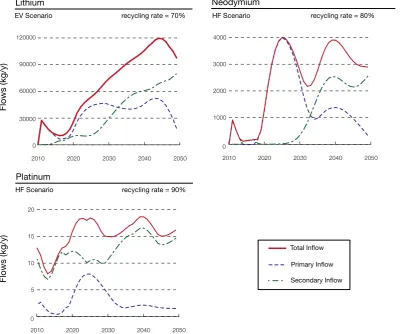
3.2. Material recycling&component reuse
As previously discussed, most of the technological uses of the materials presented here offer significant potential for end-of-life recycling. As well as quantifying the primary demand, the stocks andflows model employed for this study also allows us to quantify the potential impact of recycling on primary material demand, based on the possible recycling rate for each material.
Recycling of lithium and cobalt has the potential to significantly reduce primary demand from ~2025 onwards (Fig. 3), as this is when thefirst generation of Li-ion batteries reach end of life and are available for recycling. In the EV scenario, there is more sec-ondary lithium inflow than primary from 2033 onwards with more than 43 tonnes of lithium recycled in that year. The same effect can be seen for neodymium in the HF scenario, except that in this case the delay is longer due to the 13 year lifespan of NdFeB motors, compared to the 8 year lifespan of Li-ion batteries. The impact of recycling thus only becomes significant after 2030, but secondary inflow also overtakes primary already in 2033 with over 1.1 tonnes of neodymium recycled in that year. Only platinum recycling has no delay, because platinum is also in the current generation end-of-life internal combustion engine vehicles. The primary demand for platinum is hence reduced throughout the HF scenario with pri-mary inflow peaking at 8 kg in 2025 and secondary inflow peaking at 16.5 kg in 2039.
Reusing Li-ion batteries from electric vehicles to grid attached storage promises significant reductions in the demand for lithium and cobalt.Fig. 4shows this reduction in lithium demand, both in terms of the total demand (vehicles and storage), and in terms of the reduced demand for storage alone. It illustrates that the reuse of batteries from vehicles to grid-attached storage can serve to reduce primary lithium demand by up to 30,000 kg per year after 2030. Considering just the reduction in demand for storage, reuse of batteries can completely replace primary demand for lithium in storage after 2033.
4. Discussion
Isle of Wight. The dynamic whole system methodology developed to support this analysis highlights two key issues that can address the limitations of the circular economy and socio-economic meta-bolism perspectives described in the introduction, (1) the impor-tance of understanding the technological basis of infrastructure (including components and materials), (2) the importance of the whole system perspective when identifying material efficiencies.
4.1. Understanding the technological basis of infrastructure
[image:7.595.104.502.71.399.2]The results of our analysis demonstrate the value of considering technology in more detail to identify effective opportunities for more efficient management of critical materials. This addresses the limitations of the more qualitative analysis in Circular Economy approaches and the macro-level perspective of socio-economic
Fig. 1.Material in-use stocks, inflow demand, and end-of-life outflow for lithium and platinum under the EV (electric vehicle) and HF (hydrogen fuel cell) scenarios.
[image:7.595.101.507.439.636.2]metabolism.
Including technology components in modelling allows analysis of the trade-offs between technologies and their implications for material criticality. For example, the choice between battery elec-tric and hydrogen fuel cell vehicles involves a trade-off between reliance on lithium and cobalt vs. platinum and neodymium. On
[image:8.595.95.498.68.402.2]this basis, a transition to battery electric vehicles may be the less risky as it depends on less neodymium in the short term, and neodymium is considered the most critical of the four materials (Ad-hoc Working Group on defining critical raw materials, 2010; British Geological Survey, 2012; United States Department of Energy, 2010). A further material benefit of choosing hydrogen
Fig. 3.Total, primary and secondary inflow for Lithium, Neodymium and Platinum in the EV and HF scenarios as indicated. In each case, secondary inflow has the potential to significantly reduce primary demand.
[image:8.595.95.492.449.639.2]fuel cell vehicles lies in the potential for recycling of platinum from the current stock of ICE vehicles. With stringently implemented recycling strategies, our results show that it is possible to reduce the demand for primary platinum for hydrogen fuel cells by over 50% in the short term, and over 80% in the long term (after 2030) using secondary platinum from end-of-life catalytic converters and fuel cells.
A second benefit of introducing greater technology granularity is the additional detail provided on material outflows from the system as a result of modelling both component and technology lifetimes. For all of the materials included in this paper, the results demonstrate the potential for significant reductions in primary demand by recycling from end-of-life technologies. However, for many technologies this material does not become available until the technologies deployed at the beginning of the scenario come to the end of their life. Platinum stands out as the only material where significant in-use stocks already exist in catalytic converters of the current car stock.
By including the stocks andflows of components as well as the technology within which they are contained, we demonstrate that some materials may be available for recycling earlier than antici-pated. For example, the quantities of lithium and cobalt from Li-ion batteries become available after 8 years (the lifespan of a battery) compared to the 13-year vehicle lifespan. This provides greater certainty with regard to the availability of material outflows, which could encourage more effective planning of recovery and recycling facilities, taking into account the time-lag in material availability.
Considering technology and component efficiency, and its impact across the whole system, is an important aspect of this analysis. For example, hydrogen fuel cell vehicles are also signifi -cantly less efficient than battery electric vehicles. The total effi -ciency of turning electricity from the grid into electricity that drives the vehicles motor is 90% for Li-ion batteries compared to 56% for hydrogen fuel cells. Hydrogen fuel cell vehicles hence demand more electricity to provide the same level of transport service. This requires that more generation technologies are deployed to provide this additional electricity, which incites demand for critical mate-rials in the electricity generation technologies, potentially increasing exposure to risks from critical material supply disrup-tion overall.
4.2. Applying whole-system perspectives
The technologies and reuse strategies included in the modelling carried out in this study include Li-ion batteries as a general pur-pose low carbon technology that is used across different infra-structure sectors. Applying a whole system stocks andflows model that includes technology components as well as materials has allowed us to quantify the material demand implications of the reuse of such GPTs across different infrastructure sectors. In the case of Li-ion batteries, wefind that the demand for lithium and cobalt can be reduced by around 30% in 2033 by reusing end-of-life vehicle batteries for grid-attached storage. This is a significant reduction, possible because end-of-life vehicle batteries still retain around 70% of their original capacity when they are no longer suitable for use in vehicles. The demand for lithium and cobalt from grid-attached storage can be completely eliminated after 2032. At this point there will be enough Li-ion batteries available from end-of-life vehicles to meet demand for grid-attached storage batteries. The results for Li-ion battery reuse represent a scenario where there is no recycling of materials, only the reuse of components. This is presented to illustrate the potential of reuse strategies in isolation of any other circular economy initiatives, enabling a fair comparison between the two strategies to be presented. The reduction in primary material demand under the reuse strategy is
in fact somewhat lower than the 51% reduction achieved through recycling in the same year, despite the reuse rate of 100% compared to the 70% lithium recycling rate. There are two reasons for this: firstly, the reuse rate of batteries is not functionally 100% as the reused batteries are at 70% of their initial capacity; and secondly, only the electric vehicle batteries are reused and not those whose first use was already in grid attached storage. These two factors limiting the reuse of Li-ion batteries illustrate the limitations of the reuse of GPTs in a circular economy; a cascade of use is lessflexible than open-loop recycling and locks materials into less efficient use for longer.
4.3. Issues of governance and scale
Although the case study of the Isle of Wight has interesting geographical implications, the results of our model do not address the operational requirements of the relative scale of material recycling and component reuse described. The reuse of Li-ion batteries is a process that is more likely to be economical than the recycling of materials at the scale of the case study we present, both because of the investment needed for processing facilities and the scale of value retained in components compared to their ma-terial constituents. Although our results do not quantify this in any economic sense, the results show that the number of batteries available for reuse will be enough to meet the demand for grid-attached storage batteries after 2032. The prospect of this being a local activity suggests there could be significant economic benefits to the local economy of a material and technology stewardship model that retains value within local infrastructure systems, and this is also likely to create social value in the form of increased employment. This issue is likely to be of relevance in the context of the UK's devolution of previously centralized powers to city gov-ernments and local authorities (HM Government, 2011b). The 2011 Localism Act (HM Government, 2011b) and a series of City Deals have given city regions increasing responsibility for infrastructure planning and thefinancial tools to fund projects (O'Brien and Pike, 2015a, 2015b). This devolution introduces local authorities and local enterprise partnerships as new actors whose interests span across multiple infrastructure systems, breaking through the existing silos (Roelich et al., 2015). These actors could be in a po-sition to adopt a whole system planning process that integrates and exploits interconnections between infrastructure systems, informed by the type of analysis we have presented in this paper.
4.4. Integrated technical and socio-economic analysis
The potential for integrating materialflow models with wider sustainability assessment methodologies has also been demon-strated already.Liu et al. (2012)and Pauliuk et al. (2012a)have linked dynamic material flow analysis to carbon emissions, demonstrating the important role of stock dynamics in future car-bon emissions. AndHertwich et al. (2014)have integrated a ma-terialflow model with LCA to analyze the life cycle environmental impacts of global energy transitions. Pauliuk et al. (2017) have recently proposed a deeper integration of dynamic materialflow models with integrated assessment models. We suggest that a similar integration of the methodology we present in this paper would also enable more comprehensive analyses of circular econ-omy practices across economic, social and environmental di-mensions of sustainability. It would also support the use of more technical indicators, such as resource duration (Franklin-Johnson et al., 2016), for circular economy performance.
5. Conclusions
Low carbon infrastructure is widely recognized as being heavily reliant on critical materials that are at risk of supply disruptions. These materials are often embedded in so-called low carbon technologies such as Li-ion batteries or NdFeB magnets that are used across different infrastructure sectors. Circular economy in-terventions such as recycling and reuse of technologies are advo-cated as solutions that reduce the reliance on critical materials, as well as reducing primary material demand and the associated environmental impacts of their extraction. By applying a dynamic stocks andflows model of material and technology components to the transition of two infrastructure sectors reliant on common low carbon technologies, we have shown that it is possible to quantify the material demand implications of such circular economy interventions.
Further to this, two key insights have been demonstrated in the analysis that justify the uptake of this approach. Thefirst is the importance of understanding the technological basis of the in-frastructures utilized in low carbon transitions, particularly at the detailed level of general purpose components and materials. Applying a methodology that quantitatively accounts for these technological details can identify opportunities and trade-offs in circular economy interventions that are missed when applying standard techniques in the socio-economic metabolism literature. The hierarchical stocks andflows model of technologies, compo-nents and materials we demonstrate quantifies the potential for low carbon technology reuse and the limitations inherent to this. Secondly, we have demonstrated the importance of taking a whole-system perspective in analyzing circular economy initiatives in low carbon infrastructure transitions. The use of general purpose technologies in low carbon infrastructures create opportunities for component reuse across different infrastructure sectors that can only be identified by widening the system boundaries of analysis beyond single, isolated infrastructure systems.
Acknowledgments
We gratefully acknowledge support of the UK Engineering and Physical Sciences Research Council under the Undermining Infra-structure and iBuild projects (Grant No.’s EP/J005576/1 and EP/ K012398/1), the UK Economic and Social Research Council under the Centre for Climate Change Economics and Policy (Grant No. ES/ K006576/1) and the Leverhulme Trust (Grant No. ECF/2014/144). We would also like to thank Julia Steinberger and Phil Purnell for their support and discussions of this research, and three anony-mous reviewers for their constructive comments.
Appendix A. Supplementary data
Supplementary data related to this article can be found athttp:// dx.doi.org/10.1016/j.jclepro.2017.02.166.
References
ABB, 2014. ABB and Partners to Evaluate the Reuse of the Nissan LEAF Battery for Commercial Purposes [WWW Document]. URL.www.abb.co.uk/cawp/seitp202/
a2b2d2aff96520bec1257989004e62ae.aspx(Accessed 2 November 2014).
Accenture, 2014. Circular Advantage: Innovative Business Models and Technologies to Create Value in a World without Limits to Growth. AccentureStrategy. URL. https://www.accenture.com/gb-en/insight-circular-advantage-innovative-business-models-value-growth(Accessed 22 February 2017).
Ad-hoc Working Group on defining critical raw materials, 2010. Critical Raw Ma-terials for the EU (Brussels, Belgium).
Allesch, A., Brunner, P.H., 2015. Materialflow analysis as a decision support tool for waste management: a literature review. J. Ind. Ecol. 19, 753e764. http:// dx.doi.org/10.1111/jiec.12354.
Alonso, E., Field, F.R., Kirchain, R.E., 2012a. Platinum availability for future auto-motive technologies. Environ. Sci. Technol. 46, 12986e12993.http://dx.doi.org/ 10.1021/es301110e.
Alonso, E., Sherman, A.M., Wallington, T.J., Everson, M.P., Field, F.R., Roth, R., Kirchain, R.E., 2012b. Evaluating rare earth element availability: a case with revolutionary demand from clean technologies. Environ. Sci. Technol. 46, 3406e3414.http://dx.doi.org/10.1021/es203518d.
Bakker, C., Wang, F., Huisman, J., Den Hollander, M., 2014. Products that go round: exploring product life extension through design. J. Clean. Prod. 69, 10e16. http://dx.doi.org/10.1016/j.jclepro.2014.01.028.
Behrens, A., 2016. The climate change impact of material use. Intereconomics 51, 209e212.http://dx.doi.org/10.1007/s10272-016-0604-0.
Binnemans, K., Jones, P.T., Blanpain, B., Van Gerven, T., Yang, Y., Walton, A., Buchert, M., 2013. Recycling of rare earths: a critical review. J. Clean. Prod. 51, 1e22.http://dx.doi.org/10.1016/j.jclepro.2012.12.037.
Brand, M., Quinger, D., Walder, G., Jossen, A., Lienkamp, M., 2012. Ageing in-homogeneity of long-term used BEV-batteries and their reusability for 2nd-life applications. In: EVS26 International Battery, Hybrid and Fuel Cell Electric Vehicle Symposium (Los Angeles, California, USA).
Braungart, M., McDonough, W., Bollinger, A., 2007. Cradle-to-cradle design: creating healthy emissionsea strategy for eco-effective product and system design. J. Clean. Prod. 15, 1337e1348.http://dx.doi.org/10.1016/j.jclepro.2006.08.003. British Geological Survey, 2010. United Kingdom Minerals Yearbook 2010
(Not-tingham, UK).
British Geological Survey, 2012. Risk List 2012 (Nottingham, UK). British Geological Survey, 2016. Mineral Profile. Lithium, Nottingham, UK. Busch, J., Steinberger, J.K., Dawson, D.A., Purnell, P., Roelich, K., 2014. Managing
critical materials with a technology-specific stocks andflows model. Environ. Sci. Technol. 48, 1298e1305.http://dx.doi.org/10.1021/es404877u.
Ciacci, L., Reck, B.K., Nassar, N.T., Graedel, T.E., 2015. Lost by design. Environ. Sci. Technol. 49, 9443e9451.http://dx.doi.org/10.1021/es505515z.
Colombo, E., Rocco, M.V., Toro, C., Sciubba, E., 2015. An exergy-based approach to the joint economic and environmental impact assessment of possible photo-voltaic scenarios: a case study at a regional level in Italy. Ecol. Modell. 318, 64e74.http://dx.doi.org/10.1016/j.ecolmodel.2014.11.006.
DECC, 2014a. Regional Energy Statistics Map [WWW Document]. URL.www.restats. org.uk(Accessed 2 November 2014).
DECC, 2014b. 2050 Pathways Calculator [WWW Document]. URL. www.2050-calculator-tool.decc.gov.uk/(Accessed 5 January 2014).
Du, X., Graedel, T.E., 2011. Global rare earth in-use stocks in NdFeB permanent magnets. J. Ind. Ecol. 15, 836e843. http://dx.doi.org/10.1111/j.1530-9290.2011.00362.x.
Earles, J.M., Halog, A., 2011. Consequential life cycle assessment: a review. Int. J. Life Cycle Assess. 16, 445e453.http://dx.doi.org/10.1007/s11367-011-0275-9. Ecoisland Partnership, 2012. Investment Prospectus: Pioneering Sustainable
Growth (Cowes, UK).
Ehrenfeld, J.R., 2005. Eco-efficiency: philosophy, theory, and tools. J. Ind. Ecol. 9, 6e8.http://dx.doi.org/10.1162/108819805775248070.
Ellen MacArthur Foundation, 2013. Towards the Circular Economy, vol. 1 (Cowes, UK).
Ellen MacArthur Foundation, Granta Design, 2015. Project Overview: an Approach to Measuring Circularity (Cowes, UK).
Elshkaki, A., Graedel, T.E., 2013. Dynamic analysis of the global metalsflows and stocks in electricity generation technologies. J. Clean. Prod. 59, 260e273.http:// dx.doi.org/10.1016/j.jclepro.2013.07.003.
Elshkaki, A., Graedel, T.E., 2014. Dysprosium, the balance problem, and wind power technology. Appl. Energy 136, 548e559. http://dx.doi.org/10.1016/ j.apenergy.2014.09.064.
Erdmann, L., Graedel, T.E., 2011. Criticality of non-fuel minerals: a review of major approaches and analyses. Environ. Sci. Technol. 45, 7620e7630. http:// dx.doi.org/10.1021/es200563g.
European Commission - DG Environment, 2014. Ex-post Evaluation of Certain Waste Stream Directives. Final Report (Brussels, Belgium).
of the Council on End-of Life Vehicles doi:2004R0726-v.7 of 05.06.2013. European Commission, 2015. Closing the Loop - an EU Action Plan for the Circular
Economy. Communication from the Commission to the European Parliament, the Council, the European Economic and Social Committee and the Committee of the Regions, Brussels, Belgium. http://dx.doi.org/10.1017/ CBO9781107415324.004.
Fernandez, I.J., Calvillo, C.F., Sanchez-Miralles, a., Boal, J., 2013. Capacity fade and aging models for electric batteries and optimal charging strategy for electric vehicles. Energy 1e9.http://dx.doi.org/10.1016/j.energy.2013.07.068. Fischer-Kowalski, M., Huttler, W., 1999. Society's metabolism: the intellectual
his-tory of materials flow analysis, Part II, 1970-1998. J. Ind. Ecol. 2 http:// dx.doi.org/10.1162/jiec.1998.2.4.107.
Fishman, T., Schandl, H., Tanikawa, H., 2016. Stochastic analysis and forecasts of the patterns of speed, acceleration, and levels of material stock accumulation in society. Environ. Sci. Technol. 50, 3729e3737. http://dx.doi.org/10.1021/ acs.est.5b05790.
Franklin-Johnson, E., Figge, F., Canning, L., 2016. Resource duration as a managerial indicator for circular economy performance. J. Clean. Prod. 133, 589e598. http://dx.doi.org/10.1016/j.jclepro.2016.05.023.
Fthenakis, V.M., York, N., 2012. Storage options for photovoltaics. Compr. Renew. Energy 1, 199e212.http://dx.doi.org/10.1016/B978-0-08-087872-0.00106-2. García-Gusano, D., Iribarren, D., Martín-Gamboa, M., Dufour, J., Espegren, K.,
Lind, A., 2016. Integration of life-cycle indicators into energy optimisation models: the case study of power generation in Norway. J. Clean. Prod. 112, 2693e2696.http://dx.doi.org/10.1016/j.jclepro.2015.10.075.
Ghisellini, P., Cialani, C., Ulgiati, S., 2016. A review on circular economy: the ex-pected transition to a balanced interplay of environmental and economic sys-tems. J. Clean. Prod. 114, 11e32.http://dx.doi.org/10.1016/j.jclepro.2015.09.007. Golev, A., Corder, G., 2016. Modelling metalflows in the Australian economy. J. Clean. Prod. 112, 4296e4303.http://dx.doi.org/10.1016/j.jclepro.2015.07.083. Gordon, R.B., Bertram, M., Graedel, T.E., 2006. Metal stocks and sustainability. Proc.
Natl. Acad. Sci. U. S. A. 103, 1209e1214. http://dx.doi.org/10.1073/ pnas.0509498103.
Greenfield, A., Graedel, T.E., 2013. The omnivorous diet of modern technology. Resour. Conserv. Recycl 74, 1e7.http://dx.doi.org/10.1016/j.resconrec.2013.02.010. Guinee, J.B., Heijungs, R., Huppes, G., Zamagni, A., Masoni, P., Buonamici, R.,
Ekvall, T., Rydberg, T., 2011. Life cycle assessment: past, present, and future. Environ. Sci. Technol. 45, 90e96.http://dx.doi.org/10.1021/es101316v. Hagelüken, C., 2012. Recycling the platinum group metals: a European perspective.
Platin. Met. Rev. 56, 29e35.http://dx.doi.org/10.1595/147106712X611733. Helbig, C., Bradshaw, A.M., Kolotzek, C., Thorenz, A., Tuma, A., 2016. Supply risks
associated with CdTe and CIGS thin-film photovoltaics. Appl. Energy 178, 422e433.http://dx.doi.org/10.1016/j.apenergy.2016.06.102.
Hertwich, E.G., Gibon, T., Bouman, E. a., Arvesen, A., Suh, S., Heath, G. a., Bergesen, J.D., Ramirez, A., Vega, M.I., Shi, L., 2014. Integrated life-cycle assessment of electricity-supply scenarios confirms global environmental benefit of low-carbon technologies. Proc. Natl. Acad. Sci.http://dx.doi.org/ 10.1073/pnas.1312753111, 201312753.
HM Government, 2010. 2050 Pathways Analysis (London, UK).
HM Government, 2011a. The Carbon Plan: Delivering Our Low Carbon Future (London, UK).
HM Government, 2011b. Localism Act 2011. The Stationary Office, UK.
Igos, E., Rugani, B., Rege, S., Benetto, E., Drouet, L., Zachary, D.S., 2015. Combination of equilibrium models and hybrid life cycle-inputeoutput analysis to predict the environmental impacts of energy policy scenarios. Appl. Energy 145, 234e245.http://dx.doi.org/10.1016/j.apenergy.2015.02.007.
Kleijn, R., van der Voet, E., Kramer, G.J., van Oers, L., van der Giesen, C., 2011. Metal requirements of low-carbon power generation. Energy 36, 5640e5648.http:// dx.doi.org/10.1016/j.energy.2011.07.003.
Kushnir, D., Sanden, B.A., 2012. The time dimension and lithium resource con- straints for electric vehicles. Resour. Policy 37, 93e103. http://dx.doi.org/ 10.1016/j.resourpol.2011.11.003.
Laurent, A., Clavreul, J., Bernstad, A., Bakas, I., Niero, M., Gentil, E., Christensen, T.H., Hauschild, M.Z., 2014. Review of LCA studies of solid waste management sys-temsePart II: methodological guidance for a better practice. Waste Manag. 34, 589e606.http://dx.doi.org/10.1016/j.wasman.2013.12.004.
Lipsey, R.G., Carlaw, K.I., Bekar, C.T., 2006. Economic Transformations: General Purpose Technologies and Long Term Economic Growth. Oxford University Press, New York, USA.
Liu, G., Bangs, C.E., Daniel, B.M., 2011. Unearthing potentials for decarbonizing the U. S. aluminum cycle. Environ. Sci. Technol. 45, 9515e9522.http://dx.doi.org/ 10.1021/es202211w.
Liu, G., Bangs, C.E., Müller, D.B., 2012. Stock dynamics and emission pathways of the global aluminium cycle. Nat. Clim. Chang. 3, 338e342. http://dx.doi.org/ 10.1038/nclimate1698.
Løvik, A.N., Modaresi, R., Müller, D.B., 2014. Long-term strategies for increased recycling of automotive aluminum and its alloying elements. Environ. Sci. Technol. 48, 4257e4265.http://dx.doi.org/10.1021/es405604g.
Mathews, J.A., 2013. The renewable energies technology surge: a new techno-economic paradigm in the making? Futures 46, 10e22. http://dx.doi.org/ 10.1016/j.futures.2012.12.001.
Mathews, J.A., Tan, H., 2011a. Progress toward a circular economy in China. J. Ind. Ecol. 15, 435e457.http://dx.doi.org/10.1111/j.1530-9290.2011.00332.x. Mathews, J.A., Tan, H., 2011b. Progress toward a circular economy in China: the
drivers (and inhibitors) of eco-industrial initiative. J. Ind. Ecol. 15, 435e457.
http://dx.doi.org/10.1111/j.1530-9290.2011.00332.x.
McDonough, W., Braungart, M., 2002. Cradle to Cradle: Remaking the Way We Make Things. Noth Point Press, New York, USA.
McKinsey&Company, Ellen MacArthur Foundation, 2015. Growth within: a Cir-cular Economy Vision for a Competitive Europe (Cowes, UK).
Met Office, 2014. UK Climate Maps [WWW Document]. URL.www.metoffice.gov.uk/ public/weather/climate(Accessed 2 November 2014).
Moss, R.L., Tzimas, E., Kara, H., Willis, P., Kooroshy, J., 2011. Critical Metals in Strategic Energy Technologies: Assessing Rare Metals as Supply-Chain Bottlenecks in Low-carbon Energy Technologies. Luxembourg.http://dx.doi.org/10.2790/35600. Müller, D.B., 2006. Stock dynamics for forecasting materialflowsdcase study for
housing in The Netherlands. Ecol. Econ. 59, 142e156.http://dx.doi.org/10.1016/ j.ecolecon.2005.09.025.
Mulugetta, Y., Hertwich, E.G., Riahi, K., Gibon, T., Neuhoff, K., 2014. Climate Change 2014: Mitigation of Climate Change. IPCC Fifth Assess. Rep, pp. 527e532.http:// dx.doi.org/10.1017/CBO9781107415416.
O'Brien, P., Pike, A., 2015a. The governance of local infrastructure funding and financing. Infrastruct. Complex 2, 9. http://dx.doi.org/10.1186/s40551-015-0007-6.
O'Brien, P., Pike, A., 2015b. City deals, decentralisation and the governace of local infrastructure funding andfinancing in the UK. Natl. Inst. Econ. Rev. 14e26. http://dx.doi.org/10.1177/002795011523300103.
Pauliuk, S., Hertwich, E.G., 2015. Socioeconomic metabolism as paradigm for studying the biophysical basis of human societies. Ecol. Econ. 119, 83e93. http://dx.doi.org/10.1016/j.ecolecon.2015.08.012.
Pauliuk, S., Müller, D.B., 2014. The role of in-use stocks in the social metabolism and in climate change mitigation. Glob. Environ. Chang. 24, 132e142. http:// dx.doi.org/10.1016/j.gloenvcha.2013.11.006.
Pauliuk, S., Dhaniati, N.M. a., Müller, D.B., 2012a. Reconciling sectoral abatement strategies with global climate targets: the case of the Chinese passenger vehicle fleet. Environ. Sci. Technol. 46, 140e147.http://dx.doi.org/10.1021/es201799k. Pauliuk, S., Wang, T., Müller, D.B., 2012b. Moving toward the circular economy: the
role of stocks in the chinese steel cycle. Environ. Sci. Technol. 46, 148e154. http://dx.doi.org/10.1021/es201904c.
Pauliuk, S., Arvesen, A., Stadler, K., Hertwich, E.G., 2017. Industrial ecology in inte-grated assessment models. Nat. Clim. Chang. 7, 13e20. http://dx.doi.org/ 10.1038/nclimate3148.
Perez, C., 2009. Technological revolutions and techno-economic paradigms. Camb. J. Econ. 34, 185e202.http://dx.doi.org/10.1093/cje/bep051.
Reck, B.K., Graedel, T.E., 2012. Challenges in metal recycling. Science 337, 690e695. http://dx.doi.org/10.1126/science.1217501.
Roelich, K., Dawson, D., Purnell, P., Knoeri, C., Revell, R., 2014. Assessing the dynamic material criticality of infrastructure transitions: a case of low carbon electricity. Appl. Energy 123, 378e386.http://dx.doi.org/10.1016/j.apenergy.2014.01.052. Roelich, K., Knoeri, C., Steinberger, J.K., Varga, L., Blythe, P.T., Butler, D., Gupta, R.,
Harrison, G., Martin, C., Purnell, P., 2015. Towards resource-efficient and service-oriented integrated infrastructure operation. Technol. Forecast. Soc. Change 92, 40e52.http://dx.doi.org/10.1016/j.techfore.2014.11.008.
Rudolf, V., Papastergiou, K.D., 2013. Financial analysis of utility scale photovoltaic plants with battery energy storage. Energy Policy 63, 139e146. http:// dx.doi.org/10.1016/j.enpol.2013.08.025.
Schmidt-Bleek, F., 2008. Factor 10: the future of stuff. Sustain. Sci. Pract. Policy 4, 1e4.
Singh, J., Ordo~nez, I., 2015. Resource recovery from post-consumer waste: impor-tant lessons for the upcoming circular economy. J. Clean. Prod. 134, 342e353. http://dx.doi.org/10.1016/j.jclepro.2015.12.020.
Smol, M., Kulczycka, J., Henclik, A., Gorazda, K., Wzorek, Z., 2015. The possible use of sewage sludge ash (SSA) in the construction industry as a way towards a cir-cular economy. J. Clean. Prod. 95, 45e54. http://dx.doi.org/10.1016/ j.jclepro.2015.02.051.
Stahel, W.R., 2006. The Performance Economy. Palgrave MacMillan UK, London, UK. Steffen, W., Richardson, K., Rockstr€om, J., Cornell, S., Fetzer, I., Bennett, E., Biggs, R., Carpenter, S., 2015. Planetary boundaries: guiding human development on a changing planet. Science 348, 1217.http://dx.doi.org/10.1126/science.aaa9629. Su, B., Heshmati, A., Geng, Y., Yu, X., 2013. A review of the circular economy in
China: moving from rhetoric to implementation. J. Clean. Prod. 42, 215e227. http://dx.doi.org/10.1016/j.jclepro.2012.11.020.
UNEP, 2011. Recycling Rates of Metals - a Status Report, a Report of the Working Group on the Global Metal Flows to the International Resource Panel (Graedel, T.E., Allwood, J., Birat, J.-P., Reck, B.K., Sibley, S.F., Sonnemann, G., Buchert, M., Hagelüken, C).
United Nations, 2015. Paris Agreement doi:FCCC/CP/2015/L.9. United States Department of Energy, 2010. Critical Materials Strategy.
Voet, E., Van Der, Kleijn, R., Huele, R., Ishikawa, M., Verkuijlen, E., 2002. Predicting future emissions based on characteristics of stocks. Ecol. Econ. 41, 223e234. Walton, A., Yi, H., Rowson, N.A., Speight, J.D., Mann, V.S.J., Sheridan, R.S.,
Bradshaw, A., Harris, I.R., Williams, A.J., 2015. The use of hydrogen to separate and recycle neodymium-iron-boron-type magnets from electronic waste. J. Clean. Prod. 104, 236e241.http://dx.doi.org/10.1016/j.jclepro.2015.05.033. Weisz€acker, E., von Lovins, A., Lovins, L.H., 1997. Factor Four: Doubling Wealth
-Halving Resource Use. Earthscan Publications Ltd., London, UK.