Rochester Institute of Technology
RIT Scholar Works
Theses
Thesis/Dissertation Collections
4-30-1962
Production Sensitometric Testing of Lithographic
Films Correlated with Customer Quality
Acceptance
Lawrence Albertson
Follow this and additional works at:
http://scholarworks.rit.edu/theses
This Thesis is brought to you for free and open access by the Thesis/Dissertation Collections at RIT Scholar Works. It has been accepted for inclusion
in Theses by an authorized administrator of RIT Scholar Works. For more information, please contact
ritscholarworks@rit.edu
.
Recommended Citation
Lawrence
P.
Albertson
Abstract
Various
methods ofproduction
sensitometrictesting
oflithographic
films
areinvestigated
to
establish correlationbetween
atesting
parameter and customer acceptance ofline
copy
reproduction
in
the
field.
The
chosenparameter,
"gamma,"is
comparedstatistically
for
acceptable and unacceptable reproduction
based
onfield
appraisals.Results
indicate
that
nocorrelation exists
between
the
chosentesting
parameter andfield
acceptance.Information
is
also obtainedconcerning
the
development
and exposure conditions which yield acceptableline
copy
reproductionin
the
field.
Introduction
It
is
desirable
in the manufacturing
of all photo-sensitivematerials
to
have
correlationbetween
production sensitometricparameters and customer
acceptability
ofthe
product.In
otherwords,
the
ideal
situationis
one where customer acceptanceis
predicted
by
parametric values obtainedduring
production.In
the
manufacturing
of most photographic materialsthere
is
atleast
somedegree
of correlationin
this
respect.Many
materialshave
production sensitometric systems which correlatevery
highly
with consumer acceptance.
Photographic
papers aregenerally
very
good examples ofthis
type
of situation.However,
Graphic
Arts
materials,
in
particularhigh-contrast
lithographic
films,
seemto
lack
this
correlation.The
litera
manufacturers
certainly have
production sensitometric systemsin
effect.
Whether
or notthese
systemshave
any
correlation withcustomer
acceptance
is
notknown.
An
Investigation
was madeto
obtainInformation
in
th6
Graphic
Arts
field
ofline
copy
reproductionconcerning
the
degree
ofcorrelation
between
a production sensitometric parameter andcustomer acceptance of
the
product.Also
ofinterest
werethe
conditions of exposure and
development
under whichline
copy
reproduction
is
acceptable.Chosen
for
this
experiment werethree
methods of
measuring
the
"gamma" oflithographic
films
taken
from
published material
in the
field.
It
is
notknown
definitely
that
these
methods areactually
usedin.
industrial
applications.It
should
be
notedthat
"gamma"in
referenceto
lithographic
films
does
nothave
the
conventionalmeaning
ofthe
slope ofthe
straight-line
portion ofthe
characteristiccurve,
but
ratherthe
slope ofa
line
connecting
two
arbitrarily
defined
points onthe
characteristic
curve.It
is
in
this
latter
sensethat
the
term
"gamma"will
be
usedin
this
paper.An
explanation andillustration
ofthe
three
methods ofmeasuring
gammafollows;
V) Z
D-
0.1
net
LOG EXPOSURE
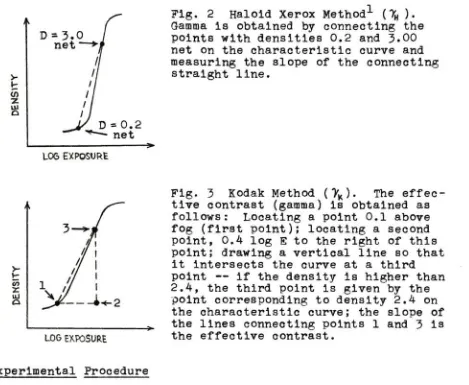
Fig.
1
Ansco
Method
(%).
The
averagegradient
(gamma)
is
obtainedby
connecting
the
points withdensities
0.1
and2.5
net onthe
characteristic curveand
measuring
the
slope ofthe
connecting
straightline.
If
this
line
intersects
the
characteristic curveat a
density
below
2.5
net,
it
is
tilted,
using
the
point withdensity
0.1
as apivot,
untilit
becomes
atangent
to
the
characteristic curve.In
this
case,
the
tangent
slopeis
tk
D
=3.
net
0_
/
//
Ul1
t1
ll lI
y
D
=0.2
"*- net
-.
-
3
-Fig.
2
Haloid
Xerox
Method1(
?H
)
.Gamma
is
obtainedby
connecting
the
points with
densities
0.2
and3.00
net on
the
characteristic curve andmeasuring
the
slope ofthe
connecting
straight
line.
LOS EXPOSURE
t
CO r UJ L06EXPOSURE
Fig.
3
Kodak Method
(?K).
The
effective
contrast(gamma)
is
obtained asfollows:
Locating
a point0.1
abovefog
(first
point);
locating
a secondpoint,
0.4
log
E
to
the
right ofthis
point;
drawing
a verticalline
sothat
it
intersects
the
curve at athird
point
if
the
density
is
higher
than
2.4,
the
third
pointis
givenby
the
point
corresponding
to
density
2.4
onthe
characteristiccurve;
the
slope ofthe
lines
connecting
points1
and3
is
the
effective contrast.Experimental
Procedure
Basically
the
procedurefor
this
experimentinvolved
photographing
atest
copy
containing
representative samples of variousline
originals;
exposing
sensitometricstrips;
andcomparing
statistically
gamma valuesfor
acceptable negatives with gammavalues
for
unacceptablenegatives,
negativeacceptability
being
determined
by
field
appraisal.To
test
the
three
methods of gamma measurement asoutlined
above,
two
films
known
to
have
different
performance characteristics
in
the
field,
Kodak
Kodalith
Ortho
Type
3
andHaloid
-*-The names attached
to
the
methodsindicate
the
source ofthe
[image:5.558.38.507.87.472.2]Halolith,
were selected.Kodak Kodalith
Developer,
whichis
widely
usedin field
applications withthe
abovefilms,
waschosen
for
developing
all negatives and sensitometric strips.The
test
copy
was composed of representativeline
copy
samples suggested
by
Graphic
Arts
field
personnellocated
withvarious
printing
establishmentsin
Rochester.
Included
in
the
test
copy
were samples of registermarks,
typing
material,
vari-type,
phototype,
pen andink
drawings,
serifs,
letterpress,
anda
resolving
power chart.In
attempting
to
encompassthe
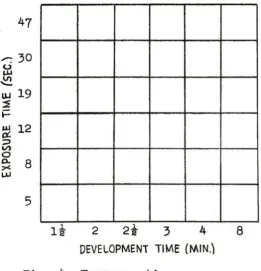
rangeof conditions which produce acceptable negatives an exposure
time-development
time
matrix wasdesigned using
practicallimitations
of
both
variables as extreme values.Figure
4
showsthe
matrixform.
o
U-oi
o o. m
47
30
19
12
8
5
li
2
2i
3
4
DEVELOPMENT
TIME
(MH)
Fig.
4
Exposure
time-development
time
matrix [image:6.558.151.413.419.690.2]
-5
-In
order
to
performthe
statistical correlation a sensitometric
strip
was neededfor
each negative.To
minimize variability,
sensitometric
strips were exposedin the
camera withthe
negatives.
Thus
each11
x14
sheet offilm
contained a negativeof
the
test
copy,
and a sensitometricstrip
exposedfrom
a0-3.0
density,
continuous wedge placedin
contact withthe
film
in
the
camera.
The
continuous wedge allowed sensitometric curvesto
be
traced
with a continuousrecording
densitometer.
Statistical
considerations
indicated
that
the
matrix shouldbe
twice
replicated
for
eachfilm,
resulting
in
atotal
of144
negatives and144
corresponding
sensitometric strips.In
exposing
the
negatives and sensitometric strips a processcamera
utilizing
a vacuumcopy
board,
a vacuum cameraback,
anelectric
timer,
and a voltage-regulatedtungsten light
source wasmade available
through
Graphic
Arts
Research
andDevelopment
atRochester
Institute
ofTechnology.
Although
the
tungsten light
source
did
notcompletely
conformto
practice,
it
offereddistinct
advantages
In minimizing light
source variation and was of considerable
importance
in
assuring
consistent results.The
negatives and sensitometric strips were exposed andde
veloped as
indicated
in
the
matrixin Figure
4.
The
matrix wastwice
replicatedfor
eachfilm.
To
minimizethe
effect oftest
time
the
test
order was establishedby
use of atable
of randomnumbers.
The
negatives werethen
taken
into
the
Graphic
Arts
field
as
being
either acceptable or unacceptable.Sensitometric
curveswere prepared
from
the
sensitometric stripsby
use of a continuous
recording densitometer.
The
three
methods of gamma measurement were
then
appliedto
each sensitometric curve.Results
The
data
from
the
evaluations offive
appraisersin
the
field
appears
in
Figure
5.
Each
ofthe
matricesin
Figure
5
is
a combination of
the
appraisal resultsfrom
the
twice
replicated matricesfor
eachfilm.
The
numbersin
the
boxes
indicate
the
number oftimes
the
negativesfrom
corresponding
boxes
in the
twice
replicated matrices
wereJudged
as acceptable.Since
there
weretwo
matricesfor
each
film
andthese
were shownto
five
appraisers,
the
maximum number
of acceptable appraisalsis
ten
for
eachbox
in
Figure
5.
Haloid
Halolith
Film
Kodak
Kodalith
Ortho
Type
3
Film
r-r47
0
1*2
0
0
0
47
&
30
|19
^12
3
g
8
X u.5
0
9
4
2
0
0
Hi
>-630 ID
^19
12
0
0
1
0
0
0
0
9
9
10
0
0
0
0
4*1
0
0
0
0
1
10
0
0
0
0
0
5*2
0
0
0
1
6
9
0
3
o o
0
0
0
0
5* 1*0
0
0
0
6
1
m
5
0
0
0
0
1*0
0
0
0
0
1* 1*2
2i
3
4
8
DEVELOPMENT
T\ME
6*1*0
Is
li
2
2i
3
4
8
DEVELOPMENT
TIME
(MIN.)
Fig.
5
Appraisal
Data
*The
asteriksindicate
occurrences of acceptable negativequality
where gamma values could not
be
obtainedfrom
the
corresponding
sensitometric strips
by
one or#ore
ofthe
methods of gamma measurement.
Comparison
ofthe
matricesin
Figure
5
withthose
in
Figure
6
will point out which ofthe
methods of gammameasurement
[image:8.558.53.504.423.647.2]Kodak
Kodalith
Ortho
Type
3
Film
(%)
tt
47
tfN^
UJ
30
2
h
19
lu
12
(D
8-8
>< Ul
5
5.610
7.710
9.245
14.680
4.660
7.890
7.975
9.660
8.140
4.175
7.740
10.065
8.900
4.105
10.000
10.065
9.750
4.215
12.050
3.940
ii
2
2i
3
4
DEVELOPMENT TINAE
(MIN)
8
Haloid
Halolith
Film
(
?A)
U*7
Hi
42.30
Ui
w
5
3.200
4.355
5.060
4.950
3.120
4.440
4.670
4.360
3.020
4.800
4.700
2.840
3.810
4.320
2.800
4.440
2.730
ii
8
Kodak
Kodalith
Ortho
Type
3
Film
(Tfe)
o47
40-30
u_
Il9
2
12
2
8
us
5
2.900
5.450
7.425
9.130
14.925
4.160
7.870
7.945
9.335
8.760
3.810
7.600
9.930
9.1303.835
9.910.
10.170
10.720
3.875
13.025
3.510
3.385
ii
2
2i
3
4
DEVELOPMENT
TIME
(MIN.)
8
Haloid
Hal
ollth
Film
(
7K
)
^47
<n19
ul a
12
/>
2
8
X
UJ _
3.350
4.535
5.165
5.065
1.800
3.875
4.850
4.050
1.730
4.550
4.450
3.485
1.450
4.370
4.110
1.745
4.220
1.650
4.050
1.050
ii
2
2i
3
4
DEVELOPMENT
TIME
(MIN.)
8
[image:10.558.69.462.99.570.2]Kodak
Kodalith
Ortho
Type
3
Film
(%)
d47
UJ
HI
30
h9
*12
tn
2
8
x
UJ
6.590
9-560
11.535
17.775
4.790
9.040
10.605
13.860
8.005
4.445
8.750
10.760
9.065
4.245
10.000
9
.515
9.505
4.340
9.380
4.150
li
2
2i
3
4
DEVELOPMENT
TIME
(MIN.)
8
Haloid
Halolith
Film
(7M)
o
UJ
Ui
47
30
pl9
ul a
12
3
2
8
X Ui r
4.420
5.160
5.135
3.640
4.370
4.795
4.745
3.545
4.830
5.000
3.360
4.635
3.360
li
2
2i
3
4
DEVELOPMENT
TIME
(MIN.)
The
gammadata
obtainedfrom
applying
each ofthe
three
methods of gamma measurement
to
each sensitometric curve appearsin Figure
6.
As
withthe
appraisaldata,
the
gamma measurementshave
been
combinedfrom
the
twice
replicated matricesfor
eachfilm
into
a single gamma matrixfor
eachfilm
containing
averagegamma values.
There
are no gamma valuesfor
someboxes
because
of gross underexposure and/or underdevelopment which prevented
measurements
from
being
made.There
were alsoborderline
caseswhere,
because
ofthe
criteria
for
a particularmethod,
only
one gamma value couldbe
obtained
for
corresponding
boxes
from
the
twice
replicated matricesfor
eachfilm.
In
these
cases ajudgment
had
to
be
made asto
whether
the
situation was a result of errorin
the
experimentalprocedure or variation
in
the
process,in
the
cases of an errorjudgment
the
data
wasdiscarded;
in
the
cases of a variationjudgment
the
single value wastaken
as anindication
ofthe
average value.
Average
gamma valuesfor both
films
andthe
three
methodsof gamma measurement were calculated
for
acceptable and unacceptable negatives.
In
all casesthe
acceptable negative averagegamma was a weighted calculation
based
on appraisaldata
eachgamma value
being
used oncein
the
calculationfor
each acceptableappraisal
(i.e.,
if
a negative was appraised as acceptablefour
times,
than
the
corresponding
gamma value was usedfour
times
in
calculating
the
average valuefor
acceptable negatives.)
Using
the
samedata
in
the
similarmanner,
standarddeviations
(s)
werealso calculated.
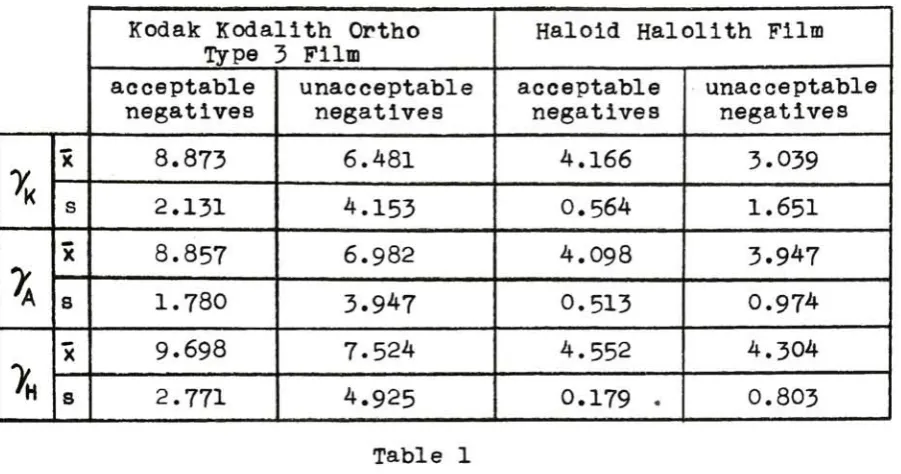
Table
I
lists
the
calculated values of average
-9
-Kodak Kodalith
Oftho
Type
3
Film
Haloid
Halolith
Film
acceptable negatives unacceptable negatives acceptable negatives unacceptable negatives
Ic
X
8.873
6.481
4.166
3.039
S
2.131
4.153
0.564
1.651
/a
X
8.857
6.982
4.098
3.947
s
1.780
3.947
0.513
0.974
J,
X
9.698
7.524
4.552
4.304
s
2.771
4.925
0.179
.0.803
Table
1
The
valuesfor
average gammas and standarddeviations
ofacceptable and unacceptable negatives were compared
statistically
for
eachfilm
and each methodto
determine
significantdiffer
ences.
An
"f"test
was runcomparing
variances(s2)
and a "t"test
was runcomparing
average gamma values.The
results ofthese
tests
are shownin
Table
2
andTable
3.
Kodak Kodalith
Ortho
Type
3
Film
Haloid
Halolith
Film
calculated
11fii
book
"f"2 calculated11fti
book
"f">K
3.789
3.09,<**0.001
8.600**3.46,*o.01
X
4.918***4.37,<**0.001
3.608*2.64,ed0.05
X
**3.159
3.12,cc0.01
20.156
10.3,OL*0.01
Table
2
"f"Test
onVariances
^Duncan,
Ache
sonJ.,
"Quality
Control andIndustrial
Statistics,"1952,
p.878,
Table
J.
*The
asteriksindicate
the
valuesfound
to
be
significant.One
asterik represents significance with
the
probability
ofbeing
wrong
onetime
in
20;
two
asteriks,
onetime
in
100;
andthree
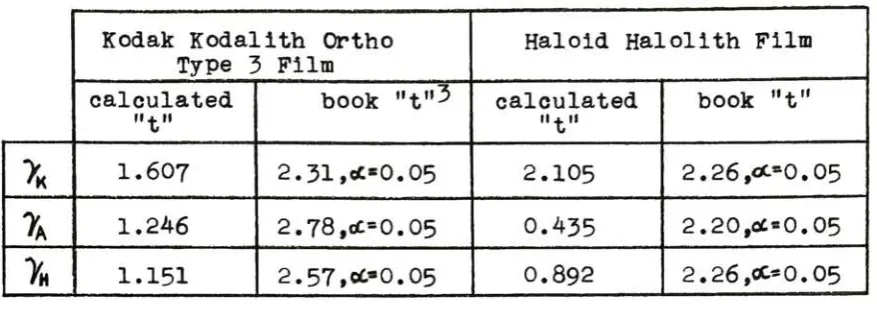
[image:13.558.45.496.56.293.2] [image:13.558.32.496.327.691.2]Kodak Kodalith
Ortho
Type
3
Film
Haloid
Halolith Film
calculated "t"
book
"t"3 calculated"t"
book
"t">K
1.607
2.31,cC0.05
2.105
2.26,0^0.05
?A
1.246
2.78,oc=0.05
0.435
2.20,ot0.05
>
1.151
2.57,ct0.05
0.892
2.26,eC*0.05
Table
3
"t"Test
onAverage
Gammas
Analysis
ofResults
From
Table
3
it
canbe
seenthat
there
are no significantdifferences
between
the
average gammas of acceptable negativesand
those
for
unacceptable negativesfor
any
ofthe
three
methodsof gamma measurement with either of
the
two
films.
It
canbe
seen
from
Table
2
that
the
variances(s2)
were allsignificantly
different.
From
this
fact
aloneit
appears asif
this
parametermay
be
a usefulindication
of customeracceptability,
ratherthan
gamma.
Closer
examination ofthe
standarddeviations,
however,
shows
that
the
data
overlapsfor
acceptable and unacceptablenegatives.
Because
ofthis
overlapping
ofdata
it
wouldbe
impossible
to
clearly
separatethe
distributions,
andit
wouldtherefore
be
unwiseto
determine
the
acceptability
ofthe
productin
the
field
by
this
measurement.The
fact
that
there
were occurrences of acceptable negativeswhere gamma measurements could not
be
madehelps
to
supportthe
above analysis.
Further
examination ofthis
point revealsimpor
tant
information
and a possible cluetowards
the
solution
ofthe
[image:14.558.48.487.80.245.2]
-11
-problem of
lack
of correlationbetween
production sensitometrictesting
and customer acceptance ofthe
product.Inspection
ofthe
characteristiccurves,
for
the
occurrences of acceptable negatives
where gamma measurements could notbe
made,
indicate
one ofthe
shortcomings ofthe
various gamma measurement methods.Although
peoplein
the
Graphic
Arts
field
maintainthat
a minimumbackground
density
of about2.5
is
necessary
for
acceptableline
copy
reproduction,
the
sensitometric curves of acceptable negatives
indicate
that
this
value couldbe
aslow
as1.8.
It
is
easily
seenwhy
two
ofthe
methods of gammameasurement,
7^
andO^
fail
to
measure gammasfor
acceptable negatives withlow
back
ground
densities,
orin
the
case of sensitometricstrips,
low
maximum
densities,
y^
and*Vh
require maximumdensities
of atleast
2.5
net and3-0
net,
respectively,
before
the
methods canbe
applied,"V.
is
not aswholly
dependent
on a mimimum value ofDmax
asthe
othertwo
methods,
but
this
factor
is
stillextremely
important
withthis
method also.A
method of gamma measurementwhich
is
going
to
satisfy
the
desired
correlation as stated previously
must,
then,
be
ableto
makethe
measurementfor
the
entirerange of possible maximum
densities
for
acceptableline
copy
reproduction.
Figure
5
contains considerableinformation
concerning
the
range of exposure and
development
conditions which will produceacceptable
line
copy
reproduction.From
these
two
matricesit
is
easily
seen which combinations of exposuretime
anddevelopment
time
produce acceptable negatives, whatthe
ranges of each varifilms
the
area of acceptable negatives appearsto
lie
along
adiagonal
with slopeapproximately
equalto
-1.In
producing
acceptable
line
copy
reproductionKodak
Kodalith
Ortho
Type
3
Film
appears superior
to
Haloid
Halolith
Film.
Conclusions
Using
just
the
measurement of gammaby
any
ofthe
three
methods and with either
film
it
is
not possibleto
predictacceptability
ofthe
productby
the
customer.For
Kodak
Kodalith
Ortho
Type
3
Film
the
optimum exposuretime
appearsto
be
30
seconds underthe
experimentalconditions,
with
development
variedfrom
two
to
three
minutesfor
maximumnumber of acceptable negatives.
For the
samefilm
optimumdevelop
ment
time
appearsto
be
three
minutes under experimental conditionswith exposure varied
from
12
to
30
secondsfor
maximum number ofacceptable negatives.
For
Haloid HalolithFilm
there
does
not appearto
be
clear-cut optimum exposure and
development
times
for
maximum productionof acceptable negatives.
However,
the
area of acceptable negativesin
the
experimental matrix appearsto
coincide quiteclosely
withthe
areafor
the
Kodak
film.
The
minimum backgrounddensity
for
acceptableline
copy
reproduction
appearsto
be
1.8.
With
the
information obtainedin
this
experiment,
especially
that
concerning
the
backgrounddensity
of acceptablenegatives,
amethod of
measuring
gamma which would correlate with acceptable
-13
-Acknowledgments
The
author wishesto
acknowledgethe
kind
assistance ofthe
following
people:Professor
Hollis
M.
Todd
andProfessor
Albert
D.
Rickmers,
Rochester
Institute
ofTechnology;
Mr.
Robert
P.
Smith,
and
Dr.
Chung
Wei
Chen,
Xerox
Corporation;
Mr.
Warren
Rhodes,
Graphic
Arts
Research
andDevelopment,
Rochester
Institute
ofTechnology;
Mr.
Anson
Halsey,
Mr.
C.
Peterson,
andMr.
John
Schoonhagen,
Case-Hoyt
Corporation;
Mr.
Fred
Hess,
Stecher-Traung
Lithographic
Corporation;
andMr.
E3
Potter,
Smith-Hart
Printing