This is a repository copy of
Relationship of Patient-Reported Outcomes with MRI
Measures in Rheumatoid Arthritis
.
White Rose Research Online URL for this paper:
http://eprints.whiterose.ac.uk/102688/
Version: Accepted Version
Article:
Baker, JF, Conaghan, PG orcid.org/0000-0002-3478-5665, Emery, P et al. (2 more
authors) (2017) Relationship of Patient-Reported Outcomes with MRI Measures in
Rheumatoid Arthritis. Annals of the Rheumatic Diseases, 76 (3). pp. 486-490. ISSN
0003-4967
https://doi.org/10.1136/annrheumdis-2016-209463
© 2016, BMJ Publishing Group Ltd and the European League Against Rheumatism. This is
an author produced version of a paper published in Annals of the Rheumatic Diseases.
Uploaded in accordance with the publisher's self-archiving policy.
eprints@whiterose.ac.uk https://eprints.whiterose.ac.uk/ Reuse
Items deposited in White Rose Research Online are protected by copyright, with all rights reserved unless indicated otherwise. They may be downloaded and/or printed for private study, or other acts as permitted by national copyright laws. The publisher or other rights holders may allow further reproduction and re-use of the full text version. This is indicated by the licence information on the White Rose Research Online record for the item.
Takedown
If you consider content in White Rose Research Online to be in breach of UK law, please notify us by
Relationship of Patient-Reported Outcomes with Magnetic Resonance Imaging Measures in Rheumatoid Arthritis
Joshua F. Baker1,2,3
Philip G. Conaghan4
Paul Emery4
Daniel G. Baker5
Mikkel Ostergaard6
1. Philadelphia Veterans Affairs Medical Center, Philadelphia, PA, USA 2. University of Pennsylvania, School of Medicine, Philadelphia, PA, USA 3. Center for Clinical Epidemiology and Biostatistics, University of Pennsylvania,
Philadelphia, PA, USA
4. Leeds Institute of Rheumatic and Musculoskeletal Medicine, University of Leeds, and NIHR Leeds Musculoskeletal Biomedical Research Unit, Leeds UK
5. Janssen Research & Development, LLC., Horsham PA, USA
6. Copenhagen Center for Arthritis Research, Center for Rheumatology and Spine Diseases, Rigshospitalet, Glostrup, and Department of Clinical Medicine, Faculty of Health and Medical Sciences, University of Copenhagen, Denmark.
Correspondence and requests for reprints should be addressed to: Joshua F. Baker, MD, MSCE
Division of Rheumatology, Department of Medicine, 5 White Building
3600 Spruce Street
Hospital of the University of Pennsylvania Philadelphia, PA 19104
Phone: (215) 662-4659 Fax: (215) 662-4500 Email: bakerjo@uphs.upenn.edu Funding: Dr. Baker is supported by a Veterans Affairs Clinical Science Research and Development Career Development Award (IK2 CX000955). This ancillary study did not receive additional funding.
Abstract
Purpose
We assessed whether magnetic resonance imaging (MRI) measures of inflammation and damage were associated with patient-reported outcomes (PROs) in a longitudinal clinical trial setting.
Methods
This longitudinal cohort was derived from the MRI sub-study of the GO-BEFORE randomized clinical trial of golimumab among methotrexate-naïve patients. Correlations between RAMRIS scores (synovitis, osteitis, bone erosion) and disability (Health
Assessment Questionnaire), pain, and global patient scores were determined at 0, 12, 24, and 52 weeks. Correlations between interval changes were also assessed.
Multivariable regression models using robust generalized estimating equations
evaluated associations over all time-points and their relationship to other clinical disease activity measures.
Results
Greater synovitis, osteitis, and bone erosion scores were positively associated with disability at all time-points (all p<0.05) and with pain and patient global scores at 24 and 52 weeks. Over all visits, synovitis was associated with disability, pain, and patient global scores (p<0.03) independent of clinical disease activity measures. Improvements in synovitis and bone erosion were also associated with improvements in PROs. Less improvement in synovitis and progression in MRI erosion at 52 weeks were both
independently associated with worsening in all PROs at 52 weeks while progression on x-ray was not associated. Similar associations were observed across treatment groups.
Conclusions
MRI measures of inflammation and structural damage correlate independently with disability, pain, and patient global assessments. These observations support the validity of MRI biomarkers.
Key Words: magnetic resonance imaging; rheumatoid arthritis; disability; pain;
Introduction
The use of patient-reported outcomes (PROs) in clinical care of patients with rheumatoid arthritis (RA) enhances communication between patients and their providers. However, PROs are not always reflective of the inflammatory disease burden and may be influenced by comorbid conditions and other factors with disagreement between patients and their providers being common.[1-3] In addition, patients who feel well and are in clinical remission can have structural damage progression.[4] Thus objective measures of disease activity are of interest. Because objective outcomes might be expected to correlate more modestly with patient assessments, it is important to determine whether a reduction in objective measures translates to improvement in PROs. Magnetic Resonance Imaging (MRI) measures of synovitis, osteitis, and bone erosion correlate with clinical disease activity and predict progression of structural damage.
[5-7]
However, the relationship between MRI measures and PROs has been poorly described.Studies previously showed that patients who experience structural damage progression as imaged by X-ray have greater disability as measured by the Health Assessment Questionnaire (HAQ).[8, 9] Averaged over 9 years, an annual increase of 6 units in the van der Heijde-Sharp (vdHS) score was associated with an approximate increase in 0.2 in the HAQ.[10] However, while progression of damage on X-ray at one year has been an important clinical trial endpoint for many years, it is not clear that progression on X-ray at one year is associated with functional decline.
One small study reported that MRI measures at baseline could predict functional outcomes.[11] However, we are aware of no studies that have comprehensively
disease activity (PtGl) and to determine if changes in MRI measures are associated with changes in these PROs.
Methods
This study was a secondary analysis of the GO-BEFORE (Clintrials.gov identifier NCT00361335) randomized trial MRI sub-study. Details of the trial design and results have been previously published.[12-14] The GO-BEFORE study was performed in 637 methotrexate (MTX) and biologic-naïve subjects; 291 of these were included in this analysis who had MRIs scored for synovitis, osteitis, and/or bone erosion.
Patients 18 years or older who met American College of Rheumatology (ACR) 1987 criteria for RA for at least the past 3 months and had active disease were recruited into the MRI sub-study at participating sites. Eligible patients were randomly assigned to receive placebo subcutaneous injection with methotrexate (MTX) (group 1), golimumab 100 mg injection with placebo (group 2), golimumab 50 mg injection with MTX (group 3), or golimumab 100 mg injection with MTX (group 4). Subjects remained in their assigned group for 28 weeks and were then allowed pre-defined increases in treatment intensity (early escape) if they had less than 20% improvement in both swollen and tender joint counts. Overall, 43/291 (15%) met the early escape criteria between 28 and 52 weeks, including 14/77 (20%) in group 1, 8/70 (11%) in group 2, 10/71 (14%) in group 3, and 13/73 (15%) in group 4. An additional 55 (71%) from group 1 were started on golimumab after 52 weeks. Similarly, an additional 38 (62%) patients in group 2 crossed over from placebo to MTX at 52 weeks.
Magnetic Resonance Imaging
The details of the acquisition of MRI images has been described elsewhere.
[7,
8, 15]
Briefly, MRIs of the patient’s dominant wrist and 2nd-5th metacarpophalangeal(MCP) joints were obtained using 1.5T MRI with contrast enhancement. Images were scored by two independent readers who were blinded to the image time-point or sequence, patient identity, and treatment group. The average score of 2 readers was determined for synovitis (0–21 for wrist plus MCP joints), osteitis (0–69) and bone erosion (0–230), using the RAMRIS system.[7, 16] Progression in the MRI erosion score was defined as a change >0.5, as previously described.
[7, 8, 17]
Radiographs of Hands and Feet
Radiographs of hands and feet were performed at baseline, week 24, and week 52 and scored by two blinded, centralized readers using the vdHS method as previously described.[18, 19] X-ray progression was defined as a change in vdHS score of greater than 0.5 as in previous studies.[7, 15, 17, 20-22]
Statistical Analysis
Data were analyzed with STATA 14 software (StataCorp, LP, College Station, TX). Correlations between synovitis, osteitis, and bone erosion scores on MRI were assessed at individual time-points using Spearman’s correlations and over all
associations between changes in synovitis, MRI progression, and X-ray progression and changes in PROs at 1 year were assessed using multivariable linear regression.
Assessment for altered associations across treatment groups was performed by testing the significance of multiplicative interaction terms.
Results
The basic characteristics of the study cohort are shown in Table 1 and have been previously described.[7, 17, 23] The correlations between MRI measures (synovitis, osteitis, bone erosion) with PROs (HAQ, pain, and PtGl scores) are presented in Table 2. MRI measures were associated with HAQ over all time-points. MRI measures were
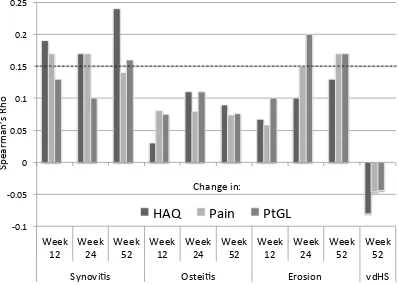
increasingly associated with pain and PtGl scores at later follow-up times. Spearman correlations between observed changes in MRI measures and changes in the PROs are shown in Figure 1. Improvements in synovitis at 12, 24, and 52 weeks were generally associated with greater improvements in HAQ, pain, and PtGl scores. Changes in osteitis were not significantly associated with changes in PROs at any follow-up time. Changes in bone erosion were associated positively with changes in pain and patient global at later follow-up times. In contrast, changes in vdHS at 52 weeks were not associated with changes in PROs and the relationship was numerically inverse.
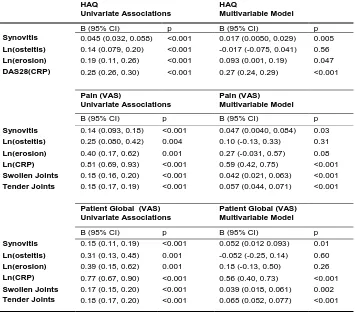
In longitudinal models incorporating all study observations, synovitis was
significantly associated with HAQ, and this was independent of the DAS28(CRP) (Table 3). Synovitis was also associated with pain and PtGl scores independent of CRP,
swollen, and tender joint counts. Greater bone erosion was associated with greater HAQ independent of synovitis and DAS28(CRP).
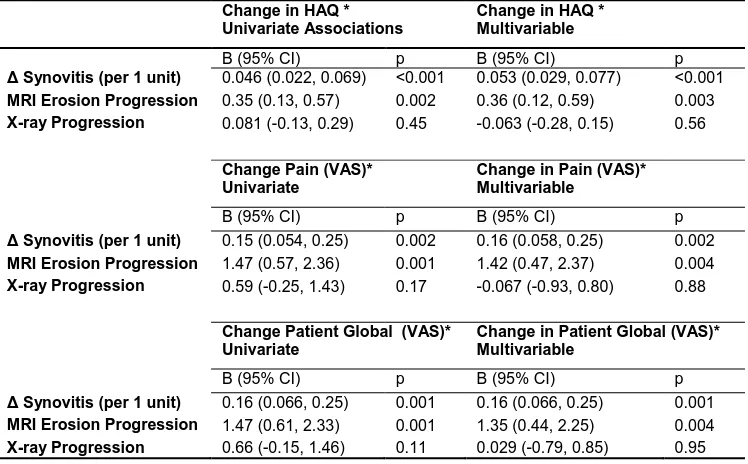
significant associations were observed between the change in synovitis at 1-year and the change in HAQ [ : 0.053 (0.029, 0.077) p<0.001], pain [ : 0.16 (0.058, 0.25) p=0.002], and PtGl score [ : 0.16 (0.066, 0.25) p=0.001] over the same interval. MRI erosion progression was associated with greater increase in HAQ, pain, and PtGl scores (all p<0.01), while X-ray progression was not associated (all p>0.11). In a similar
analysis, a unit change of 1 in the MRI erosion score at one year was associated with a positive change in HAQ [ : 0.045 (0.014, 0.076) p=0.005].
There was substantial overall improvement in HAQ over the first 52 weeks of the clinical trial [-0.75 (0.73)] while no significant improvement occurred between 52 and 104 weeks [-0.042 (0.34)]. There was similar correlation between the change in MRI erosion and the change in HAQ in the first (rho=0.13) and second year (rho=0.13) of follow up. In contrast, while there was a strong correlation between change in synovitis and change in HAQ over year 1 (rho=0.24), poor correlation was seen in year 2 (rho=0.032). These relationships were similar across treatment groups
In these analyses no attenuation of the coefficients were noted with adjustment for treatment group. In addition, no significant interactions by treatment group were noted.
Discussion
The current study is the first to systematically assess relationships between MRI measures of synovitis, osteitis, and bone erosion with PROs in a large clinical trial setting. MRI measures correlated with physical functioning over the entire study period, and it was observed that 1) less improvement in synovitis and 2) MRI erosion
Over all study visits, synovitis was associated with all PROs independent of clinical disease activity. Greater bone erosion scores were also associated
independently with higher HAQ. Thus for two individuals with similar clinical
assessments, the individual with greater synovitis on MRI is likely to have worse pain and function. These data indicate that synovitis and bone erosion are complementary to other clinical parameters in terms of relevance to the patient experience.
Improvements in MRI measures of synovitis were generally correlated with greater improvements in all PROs. Specifically, at 52 weeks, the reduction in synovitis noted on MRI was significantly correlated with improvements in HAQ, pain, and patient global scores. The correlations between PROs and MRI measures were similar across treatments received. These observations suggest that MRI measures of synovitis may be a reasonable surrogate endpoint in observational and early interventional studies.
While synovitis showed strong correlations with PROs, osteitis was not
significantly associated. One previous study evaluated associations between osteitis and HAQ and found that, while there was correlation at baseline, there was no correlation after 6 years of follow-up.[11] The current study, which found poor correlation between the change in HAQ and change in osteitis over time, supports this previous observation
An important additional observation is that MRI erosion progression was
independently associated with greater increases in PROs. We recently showed that MRI erosion has improved discriminative characteristics in the identification of the effective treatment arm.[8] The observations from the current study show that short-term progression in bone erosion on MRI is also associated with declines in physical
However, as noted, earlier studies have observed such an association averaged over 9 years (6 units of vdHS = 0.2 units of HAQ).[10] Our results suggest that MRI provides comparable, if not improved, discrimination of functional decline. Of note, we found that changes in synovitis were more strongly correlated with HAQ during the treatment of active inflammation in year 1, while changes in bone erosion were correlated with similarly throughout the 2-year period.
The current study is within a clinical trial population and thus may not be entirely generalizable to other populations. Further study in longitudinal observational studies may be helpful to characterize these associations in other populations. This study was also limited in the evaluation of PROs that were available as part of the original clinical trial. Future study should consider incorporating additional PROs in order to better understand their relationships with MRI measures. In addition, there have been advances in MRI techniques since this study was performed that may improve the visualization of inflammatory and structural changes.
In conclusion, MRI measures of synovitis and bone erosion correlate with patient-reported outcomes. Improvements over time in MRI inflammation and deterioration in MRI damage correlate with changes in function, pain, and patient global scores
suggesting that these objective measures reflect how patients experience their disease.
Acknowledgements
Dr. Baker would like to acknowledge the support of a Veterans Affairs Clinical Science Research & Development Career Development Award (IK2 CX000955). The contents of this work do not represent the views of the Department of the Veterans Affairs or the United States Government.
JF Baker has nothing to disclose. PG Conaghan has done speakers bureaus or consultancies for Abbvie, BMS, Janssen, Lilly, Novartis, Pfizer, and Roche. P Emery has received consulting fees, speaking fees, and/or honoraria from Pfizer, Merck, Abbvie, UCB, Roche, BMS, Lilly, and Novartis (less than $10,000 each). DG Baker is an employee of Janssen Biotech, Inc. M Østergaard has received fees for consultancy or speaker fees and/or research support from Abbott, AbbVie, BMS, Boehringer-Ingelheim, Celgene, Centocor, Eli-Lilly, GSK, Janssen, Merck, Mundipharma, Novo, Pfizer,
Tables
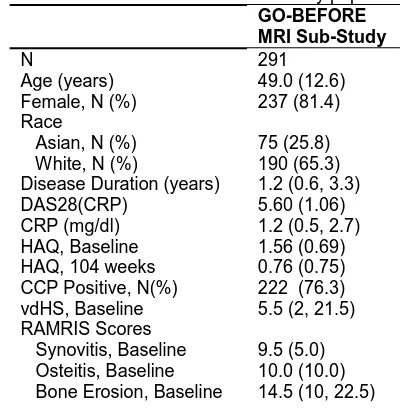
Table 1: Basic characteristics of the study population. GO-BEFORE MRI Sub-Study
N 291
Age (years) 49.0 (12.6) Female, N (%) 237 (81.4) Race
Asian, N (%) 75 (25.8) White, N (%) 190 (65.3) Disease Duration (years) 1.2 (0.6, 3.3) DAS28(CRP) 5.60 (1.06) CRP (mg/dl) 1.2 (0.5, 2.7) HAQ, Baseline 1.56 (0.69) HAQ, 104 weeks 0.76 (0.75) CCP Positive, N(%) 222 (76.3) vdHS, Baseline 5.5 (2, 21.5) RAMRIS Scores
Table 2: Spearman correlations at 0, 12, 24, and 52 weeks between synovitis, osteitis, bone erosion, and HAQ, pain, and patient global.
HAQ
Week 0 Week 12 Week 24 Week 52 Synovitis 0.24 ‡ 0.20 ‡ 0.26 ‡ 0.27 ‡ Osteitis 0.13 † 0.19 † 0.23 ‡ 0.22 ‡ Bone Erosion 0.18 † 0.23 ‡ 0.27 ‡ 0.28 ‡ Pain
Week 0 Week 12 Week 24 Week 52 Synovitis 0.093 0.13 * 0.17 † 0.21 † Osteitis 0.0073 0.14 * 0.14 * 0.21 † Bone Erosion 0.072 0.12 * 0.14 * 0.20 † Patient Global
Table 3: Longitudinal univariate and multivariable regression models using robust generalized estimating equations assessing independent associations of synovitis, osteitis, and bone erosion with HAQ scores, pain and patient global, over all visits. Treatment interactions with MRI measures were tested and non-signfiicant.
HAQ
Univariate Associations
HAQ
Multivariable Model
B (95% CI) p B (95% CI) p
Synovitis 0.045 (0.032, 0.058) <0.001 0.017 (0.0050, 0.029) 0.005
Ln(osteitis) 0.14 (0.079, 0.20) <0.001 -0.017 (-0.075, 0.041) 0.56
Ln(erosion) 0.19 (0.11, 0.26) <0.001 0.093 (0.001, 0.19) 0.047
DAS28(CRP) 0.28 (0.26, 0.30) <0.001 0.27 (0.24, 0.29) <0.001
Pain (VAS)
Univariate Associations
Pain (VAS) Multivariable Model
B (95% CI) p B (95% CI) p
Synovitis 0.14 (0.093, 0.18) <0.001 0.047 (0.0040, 0.084) 0.03
Ln(osteitis) 0.25 (0.080, 0.42) 0.004 0.10 (-0.13, 0.33) 0.31
Ln(erosion) 0.40 (0.17, 0.62) 0.001 0.27 (-0.031, 0.57) 0.08
Ln(CRP) 0.81 (0.69, 0.93) <0.001 0.59 (0.42, 0.75) <0.001
Swollen Joints 0.18 (0.16, 0.20) <0.001 0.042 (0.021, 0.063) <0.001
Tender Joints 0.18 (0.17, 0.19) <0.001 0.057 (0.044, 0.071) <0.001
Patient Global (VAS) Univariate Associations
Patient Global (VAS) Multivariable Model
B (95% CI) p B (95% CI) p
Synovitis 0.15 (0.11, 0.19) <0.001 0.052 (0.012 0.093) 0.01
Ln(osteitis) 0.31 (0.13, 0.48) 0.001 -0.052 (-0.25, 0.14) 0.60
Ln(erosion) 0.39 (0.15, 0.62) 0.001 0.18 (-0.13, 0.50) 0.26
Ln(CRP) 0.77 (0.67, 0.90) <0.001 0.56 (0.40, 0.73) <0.001
Swollen Joints 0.17 (0.15, 0.20) <0.001 0.039 (0.018, 0.061) 0.002
Table 4: Multivariable regression to identify independent associations between MRI and X-ray progression with change in PROs at 52 weeks of follow-up. Osteitis was not associated independently (not shown). Treatment interactions with MRI measures were tested and non-signfiicant.
Change in HAQ * Univariate Associations
Change in HAQ * Multivariable
B (95% CI) p B (95% CI) p
Synovitis (per 1 unit) 0.046 (0.022, 0.069) <0.001 0.053 (0.029, 0.077) <0.001
MRI Erosion Progression 0.35 (0.13, 0.57) 0.002 0.36 (0.12, 0.59) 0.003
X-ray Progression 0.081 (-0.13, 0.29) 0.45 -0.063 (-0.28, 0.15) 0.56
Change Pain (VAS)* Univariate
Change in Pain (VAS)* Multivariable
B (95% CI) p B (95% CI) p
Synovitis (per 1 unit) 0.15 (0.054, 0.25) 0.002 0.16 (0.058, 0.25) 0.002
MRI Erosion Progression 1.47 (0.57, 2.36) 0.001 1.42 (0.47, 2.37) 0.004
X-ray Progression 0.59 (-0.25, 1.43) 0.17 -0.067 (-0.93, 0.80) 0.88
Change Patient Global (VAS)* Univariate
Change in Patient Global (VAS)* Multivariable
B (95% CI) p B (95% CI) p
Synovitis (per 1 unit) 0.16 (0.066, 0.25) 0.001 0.16 (0.066, 0.25) 0.001
MRI Erosion Progression 1.47 (0.61, 2.33) 0.001 1.35 (0.44, 2.25) 0.004
X-ray Progression 0.66 (-0.15, 1.46) 0.11 0.029 (-0.79, 0.85) 0.95
Figures
Figure 1: Spearman correlations between changes MRI measures of synovitis, osteitis, and bone erosion with patient-reported outcomes including HAQ, pain, and patient global scores over 12, 24, and 52 weeks of follow-up. The dashed line represents a p-value of 0.05.
-0.1 -0.05 0 0.05 0.1 0.15 0.2 0.25 Week 12 Week 24 Week 52 Week 12 Week 24 Week 52 Week 12 Week 24 Week 52 Week 52
Synovi s Ostei s Erosion vdHS
HAQ
Pain
PtGL
Reference