Appetite Suppression and Altered Food Preferences Coincide
with Changes in Appetite-Mediating Hormones During Energy
Deficit at High Altitude, But Are Not Affected by Protein Intake
J. Philip Karl,1Renee E. Cole,1Claire E. Berryman,1,2Graham Finlayson,3Patrick N. Radcliffe,1,2 Matthew T. Kominsky,1Nancy E. Murphy,1John W. Carbone,2,4 Jennifer C. Rood,5
Andrew J. Young,1,2and Stefan M. Pasiakos1
Abstract
Karl, J. Philip, Renee E. Cole, Claire E. Berryman, Graham Finlayson, Patrick N. Radcliffe, Matthew T.
Kominsky, Nancy E. Murphy, John W. Carbone, Jennifer C. Rood, Andrew J. Young, and Stefan M. Pasiakos.
Appetite suppression and altered food preferences coincide with changes in appetite-mediating hormones
during energy deficit at high altitude, but are not affected by protein intake.
High Alt Med Biol
. 19:156–169,
2018.—Anorexia and unintentional body weight loss are common during high altitude (HA) sojourn, but
underlying mechanisms are not fully characterized, and the impact of dietary macronutrient composition on
appetite regulation at HA is unknown. This study aimed to determine the effects of a hypocaloric higher protein
diet on perceived appetite and food preferences during HA sojourn and to examine longitudinal changes in
perceived appetite, appetite mediating hormones, and food preferences during acclimatization and weight loss
at HA. Following a 21-day level (SL) period, 17 unacclimatized males ascended to and resided at HA (4300 m)
for 22 days. At HA, participants were randomized to consume measured standard-protein (1.0 g protein/kg/d) or
higher protein (2.0 g/kg/d) hypocaloric diets (45% carbohydrate, 30% energy restriction) and engaged in
pre-scribed physical activity to induce an estimated 40% energy deficit. Appetite, food preferences, and
appetite-mediating hormones were measured at SL and at the beginning and end of HA. Diet composition had no effect
on any outcome. Relative to SL, appetite was lower during acute HA (days 0 and 1), but not different after
acclimatization and weight loss (HA day 18), and food preferences indicated an increased preference for
sweet-and low-protein foods during acute HA, but for high-fat foods after acclimatization sweet-and weight loss. Insulin,
leptin, and cholecystokinin concentrations were elevated during acute HA, but not after acclimatization and
weight loss, whereas acylated ghrelin concentrations were suppressed throughout HA. Findings suggest that
appetite suppression and altered food preferences coincide with changes in appetite-mediating hormones during
energy deficit at HA. Although dietary protein intake did not impact appetite, the possible incongruence with
food preferences at HA warrants consideration when developing nutritional strategies for HA sojourn.
Keywords:
ingestive behavior, hypoxia, energy restriction, hunger, satiety, craving
Introduction
L
owlanders sojourningat high altitude (HA; 2500–5000 m) commonly experience unintentional weight loss (Westerterp and Kayser, 2006; Pasiakos et al., 2017). The
etiology is multifactorial, but reduced energy intake is a contributing factor (Hamad and Travis, 2006; Westerterp and Kayser, 2006), and coincides with a loss of appetite puta-tively characterized by a rapid reduction in hunger during meals and early satiation (Westerterp-Plantenga et al., 1999).
1
Military Nutrition Division, U.S. Army Research Institute of Environmental Medicine, Natick, Massachusetts. 2
Oak Ridge Institute of Science and Education, Oak Ridge, Tennessee. 3
School of Psychology, University of Leeds, Leeds, United Kingdom. 4
School of Health Sciences, Eastern Michigan University, Ypsilanti, Michigan. 5
Pennington Biomedical Research Center, Baton Rouge, Louisiana.
ªJ. Philip Karl et al., 2018; Published by Mary Ann Liebert, Inc. This article is available under the Creative Commons License CC-BY-NC (http://creativecommons.org/licenses/by-nc/4.0). This license permits non-commercial use, distribution and reproduction in any medium, pro-vided the original work is properly cited. Permission only needs to be obtained for commercial use and can be done via RightsLink. Mary Ann Liebert, Inc.
DOI: 10.1089/ham.2017.0155
Some evidence suggests that this HA anorexia may be related to hypoxia-induced increases in the anorexigenic hormones, leptin (Tschop et al., 1998; Shukla et al., 2005; Barnholt et al., 2006; Sierra-Johnson et al., 2008; Snyder et al., 2008) and cholecystokinin (CCK) (Bailey et al., 2000), and suppression of the orexigenic hormone ghrelin (Shukla et al., 2005; Riepl et al., 2012; Wasse et al., 2012; Matu et al., 2017a, 2017b). However, findings are not consistent across all studies (Zaccaria et al., 2004; Benso et al., 2007; Vats et al., 2007; Riepl et al., 2012; Aeberli et al., 2013; Debevec et al., 2014, 2016; Mekjavic et al., 2016; Morishima and Goto, 2016). These inconsistencies and heterogeneous study designs have impeded reaching consensus on the role of appetite-mediating hormones in the development and persistence of HA anorexia (Hamad and Travis, 2006; Westerterp and Kayser, 2006; Raff et al., 2008; Sierra-Johnson et al., 2008; Debevec, 2017). An improved understanding of the contri-bution of appetite-mediating hormones to HA anorexia, and how that impact evolves with acclimatization, could help develop optimized strategies for mitigating HA anorexia.
Higher protein (>1.2 g protein/kg body weight/d) diets preserve fat-free mass during weight loss (Wycherley et al., 2012; Leidy et al., 2015; Pasiakos et al., 2015a, 2015b) which may be beneficial for maintaining physical function and health. These benefits underpin recommendations supporting higher protein diets for athletes (Thomas et al., 2016) and military personnel (Pasiakos et al., 2013a, 2013b, 2015a, 2015b) and have stimulated recent interest in studying the ef-fectiveness of higher protein diets for mitigating fat-free mass loss during HA sojourn (Pasiakos et al., 2017). However, protein increases fullness (Dhillon et al., 2016) and is more satiating than carbohydrate or fat (Leidy et al., 2015). These effects may be potentiated at HA due to the higher thermogenic effect of protein relative to fat (Veldhorst et al., 2008) which could worsen hypoxia by increasing postprandial oxygen consumption (Westerterp and Kayser, 2006; Veldhorst et al., 2008). Higher protein diets may also be incompatible with food preferences at HA, which have favored carbohydrate in some (Boyer and Blume, 1984; Kayser et al., 1993; Westerterp-Plantenga et al., 1999; Bailey et al., 2004; Hamad and Travis, 2006; Matu et al., 2017a, 2017b), but not all (Rose et al., 1988; Reynolds et al., 1998; Aeberli et al., 2013), studies. Collec-tively, these effects could prove counterproductive to retaining fat-free mass during HA-induced weight loss by exacerbating HA anorexia and further reducing energy intake. Although these possibilities have been acknowledged (Westerterp and Kayser, 2006; Pasiakos et al., 2017), to date, the effects of higher protein diets on appetite and food preferences during HA sojourn are undetermined.
We recently reported that consuming a controlled higher protein hypocaloric diet relative to a controlled standard-protein hypocaloric diet did not protect fat-free mass during weight loss over 22 days at HA (Berryman et al., 2017). This report details changes in perceived appetite, appetite-mediating hormones, and food preferences measured as secondary outcomes during that study. The objectives asso-ciated with these outcomes were: (1) to determine the effects of a higher protein hypocaloric diet relative to a standard-protein hypocaloric diet on perceived appetite and food preferences during HA sojourn and (2) to examine longitu-dinal changes in perceived appetite, appetite-mediating hor-mones, and food preferences during acclimatization and weight loss at HA.
Materials and Methods
Participants
Twenty-one men gave their free and informed voluntary consent to participate in this randomized controlled trial. Participants were 18–42 years, exercised‡2 days/week, were born at altitudes <2100 m, had not traveled to altitudes
>1200 m for ‡5 days within 2 month of participation, and were not taking any medications. Exclusion criteria included musculoskeletal injury, metabolic, cardiovascular, and gas-trointestinal abnormalities or disorders, diseases affecting macronutrient metabolism or ability to participate in strenu-ous exercise, sleeping disorders or apnea, history of HA pulmonary or cerebral edema, alcoholism, substance abuse, anabolic steroid use, anemia, sickle cell trait, and elevated prothrombin time. Participants were asked to abstain from alcohol, caffeine, dietary supplements, and nicotine products throughout the study. The study was approved by the In-stitutional Review Board at the U.S. Army Research Institute of Environmental Medicine (Natick, MA) and conducted May-Aug 2016. Investigators adhered to the policies re-garding the protection of human subjects as prescribed in Army Regulation 70–25, and the research was conducted in adherence with the provisions of 32 CFR Part 219. The trial was registered on www.clinicaltrials.gov as NCT02731066.
Study design
The 43-day study included a 21-day sea level (SL) phase (50 m; Natick, MA), which was immediately followed by 22 days at HA (4300 m; Pikes Peak, CO) (Berryman et al., 2017) (Fig. 1). Upon enrollment, investigators randomized participants using computer-generated randomization to consume a standard-protein or higher protein diet at HA. During SL, participants were free living but visited the lab-oratory daily and maintained habitual exercise. Compliance with diet instructions and body weight maintenance was verified by diet records and daily body weight monitoring.
On SL day 21 participants were flown from Boston, MA to Denver, CO where they were placed on supplemental oxygen until ascent. In the early morning after arrival in Colorado (HA day 0), participants ascended to 4300 m by car where they resided for 22 days in a temperature-controlled indoor environment at the U.S. Army Research Institute of En-vironmental Medicine Maher Memorial Laboratory.
The shortened version of the Environmental Symptoms Questionnaire was administered at SL and daily during HA to assess the incidence of acute mountain sickness, which was defined as a Lake Louise score of >0.7 (Beidleman et al., 2007). Oxygen saturation was measured at SL and daily during HA by finger pulse oximetry (Nonin Model 7500 or 8600; Plymouth, MN).
Study diets
During SL, all participants consumed a self-selected weight maintaining diet. Registered dietitians provided in-struction on consuming a diet containing 1.0 g protein/kg/d, 45%–65% energy from carbohydrate, and 20%–35% energy from fat. Twenty-four hour food records were completed and reviewed every 2–3 days, and additional education was provided as needed to promote adherence. During SL, most participants consumed meals from the local cafeteria or local restaurants.
During HA, all food and caloric beverages consumed were strictly controlled, weighed and measured, and provided by study staff. Meals and snacks were supervised, and partici-pants were instructed to consume all provided food and beverages. Any uneaten foods were weighed and docu-mented. Diets were individualized, followed a five-day ro-tating menu, and were designed to provide a standard (SP; 1.0–02 g/kg/d) or higher (HP; 2.0–0.2 g/kg/d) amount of protein, and 45% of total energy as carbohydrate each day. Fat intake was reduced in HP to accommodate the higher protein intake (Table 1). Most of the foods were entre´es, sides, and snack items included in U.S. military Meals Ready-to-Eat rations. These items were supplemented with fresh fruits and vegetables, fruit snacks, olive oil, and ranch-flavored salad dressing. Protein intake was also manipulated using a whey-protein beverage (IsopureZero Carb; Isopure Co., Hauppauge, NY). Although the diets differed in ap-pearance, participants were not told to which dietary group
they were assigned. Whether participants could correctly identify their group assignment was not assessed. Water and noncaffeinated calorie-free sodas were allowedad libitum. Dietary intake was assessed using daily food records, the Combat Rations Database (U.S. Army Natick Soldier Re-search Development and Engineering Center and USAR-IEM), and Food Processor SQL v.10.14 (ESHA Research, Salem, OR).
Effects of protein intake on appetite and food preferences during energy deficit at HA (objective 1)
[image:3.612.127.487.58.285.2]Appetite testing. To determine the effects of protein in-take on appetite at HA, perceived appetite was measured using visual analog scales administered hourly, and imme-diately before and after meals on SL day 12 and HA days 1 and 18. Participants consumed the same individualized menu
FIG. 1. Study design. Volunteers were followed for 21 days at SL, then for 22 days while living at HA (4300 m) and consuming standard-protein or higher protein hypocaloric diets. CCK, cholecystokinin; CHO, carbohydrate; Ghr, acylated ghrelin; Ins, insulin; Lep, leptin; VAS, visual analog scale measuring appetite; SL, sea level; HA, high altitude.
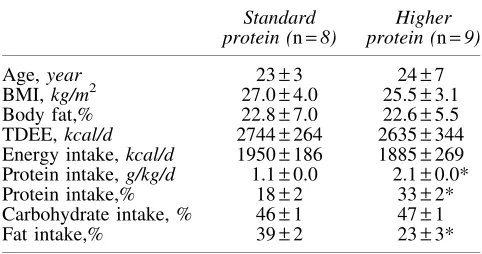
Table1. Baseline Participant Characteristics and Actual Dietary Intakes Over22Days
at High Altitude(4300m) Standard protein (n=8)
Higher protein (n=9)
Age,year 23–3 24–7 BMI,kg/m2 27.0–4.0 25.5–3.1 Body fat,% 22.8–7.0 22.6–5.5 TDEE,kcal/d 2744–264 2635–344 Energy intake,kcal/d 1950–186 1885–269 Protein intake,g/kg/d 1.1–0.0 2.1–0.0* Protein intake,% 18–2 33–2* Carbohydrate intake, % 46–1 47–1 Fat intake,% 39–2 23–3*
Values are mean–SD. TDEE, total daily energy expenditure during weight maintenance at sea level. Adapted from Berryman et al. (2017).
[image:3.612.312.553.581.708.2]on all three test days and ate all meals and snacks at the same times each day. On SL day 12 the prescribed meals matched the HA energy prescription and diet assignment to eliminate any confounding resulting from differences in energy intake between SL and HA. Diets were constant within participants across test days, but because the diets were individualized, the types of foods and the volume of food and beverages consumed differed between participants. Water was allowed
ad libitumbetween meals.
Food preferences and cravings. Questionnaires were administered on SL day 12 and HA days 1 and 18 to deter-mine the effects of protein intake on food preferences and cravings at HA. Food preferences were measured using the Leeds Food Preference Questionnaire (LFPQ), which was administered before and after lunch. The LFPQ is a com-puterized platform that uses pictures of individual food items selected from a validated database of common foods to measure different components of food preferences and he-donics (Finlayson et al., 2007). Pictures for each test varied in two separate dimensions; fat (low and high) and taste (sweet and savory) or protein (low and high) and taste (sweet and savory). Four pictures from each food type were selected resulting in 16 separate pictures being used within each test (Supplementary Table S1; Supplementary materials are available online at http://www.liebertpub.com/ham).
The LFPQ measures three constructs as follows: explicit liking (i.e., perceived hedonic impact of the food), explicit wanting (i.e., conscious desire to consume a food), and im-plicit wanting (i.e., subconscious motivation for a food). To measure explicit liking, the participant was shown each picture in random order and asked to respond to the question ‘‘how pleasant would you find the taste of this food right now’’ using a visual analog scale. To measure explicit wanting, the participant was shown each picture in random order and asked to respond to the question ‘‘how much do you want to eat this food right now’’ using a visual analog scale. Implicit wanting was measured using forced choice meth-odology in which pairs of food images from separate food categories were presented in randomized order on the com-puter screen. Participants were asked to as quickly as possible select the food that they most wanted to eat at that moment. Both frequencies of selections within each food category and response time (i.e., relative preference) were recorded. The preference for different food types was computed for each metric by subtracting the mean scores (visual analog scale scores or frequency of selection and reaction time) from a comparator group (low fat/protein and savory) relative to the matched reference group (high fat/protein and sweet, respectively). Food cravings were assessed before lunch us-ing the Food Cravus-ings Inventory (White and Grilo, 2005) and Control of Eating Questionnaire (Dalton et al., 2015).
Longitudinal changes in appetite and appetite-mediating hormones during acclimatization and weight loss at HA (objective 2)
Longitudinal changes in appetite and related hormones were examined on SL day 7 and HA days 0 and 21 by mea-suring circulating hormone concentrations throughout the day and by measuring appetite, CCK, and acylated ghrelin responses to a standardized meal. On these days participants did not consume their prescribed diets to conduct testing for
unrelated study objectives which have been (Berryman et al., 2017) or will be reported elsewhere. Hormone concentrations were not measured on SL day 12 and HA days 1 and 18 (i.e., full-day appetite testing) for logistical reasons. Therefore, because prescribed SP and HP diets were not consumed until after HA day 0, and because diet habituation has been re-ported not to influence fasting hormone concentrations in-dependent of body weight changes (Ellis et al., 2012), we did not expect hormone concentrations to differ by diet group unless differential changes in body composition were ob-served. As such, determining the effects of protein intake on appetite-mediating hormones was not a study objective. However, these study days provided an opportunity to ex-amine appetite-mediating hormone responses to acute HA exposure and whether those responses persisted after accli-matization and weight loss. In addition, these days allowed us to examine whether the rates of change of postprandial ap-petite responses, as was previously reported (Westerterp-Plantenga et al., 1999), and related hormones differed be-tween HA and SL.
Fasting blood samples were collected shortly after waking following a>10-hour fast on SL day 7 and HA days 0 and 21. Additional blood samples were collected from an indwelling venous catheter 4 hours and 9.5 hours later and during a standardized meal test beginning 10 hours after the fasting blood draw (Fig. 1). No food was consumed after dinner the evening prior until the standardized meal test. However, participants consumed beverages containing 145 g (n=9) or 0 g (n=8) of carbohydrate during an 80-minute submaximal aerobic exercise bout 3.5–5 hours before the meal test, and all participants drank 25 g of whey-protein (IsopureZero Carb) 3 hours before the meal test. The rationale for providing these beverages was to conduct testing for unrelated study objec-tives (Berryman et al., 2017). Potential confounding due to carbohydrate intake was addressed by including this variable in statistical models.
Standardized meal tests occurred between 1530 and 1630 hours. For each meal test, participants were provided a fixed-portion meal to consume at a controlled eating rate and 240 g water to drink. The meal was macaroni and cheese with added butter and provided 20% of individual weight main-tenance energy needs determined during SL (41%, 49%, and 10% energy from carbohydrate, fat, and protein, respective-ly). Participants were instructed to consume all of the food and water provided in 12 minutes while eating at a constant rate (Karl et al., 2011). Over the subsequent 105 minutes, water intake was prescribed, and no additional food or bev-erage was allowed. Blood samples were collected approxi-mately 30 minutes before the meal and at 7.5, 15, and 30 minutes after starting the meal. Perceived appetite was measured before, during, and periodically for 105 minutes after completing the meal using visual analog scales.
chilled Monovettes containing EDTA-K3 and
4-(2-aminoethyl)benzenesulfonyl fluoride hydrochloride (1 mg/ mL whole blood) for acylated ghrelin determination or pro-tease inhibitor cocktail (40lL/mL whole blood; cOmplete, EDTA-free) for CCK determination. Acylated ghrelin ali-quots were combined with 50lL 1N HCl/mL plasma, and all samples were stored at-20C to-80C until analysis. Plasma acylated ghrelin was determined by RIA (EMD Millipore) and plasma CCK by ELISA (Cusabio, College Park, MD) according to manufacturer’s instructions.
Visual analog scales
Four separate visual analog scales were used to measure self-perceived appetite (Blundell et al., 2010). Participants rated their levels of hunger and fullness, their desire to eat, and the amount of food they thought they could eat ‘‘right now’’ (i.e., prospective consumption) by marking anywhere on a 10-cm scale anchored by phrases representing opposite extremes of a spectrum (e.g., ‘‘not at all hungry’’ and ‘‘extremely hun-gry’’). A total appetite score was computed as follows:
Overall appetite¼(hungerþdesire to eat
þprospective consumption
þ(10fullness))=4
Statistical analyses
Sample size estimates based on the primary study out-come, fat-free mass, indicated n=8/grp were required to detect a 1 kg between-group difference in fat-free mass loss (Berryman et al., 2017). This sample size was estimated to allow detection of a 25% difference in mean between-group appetite ratings ata=0.05 and power=0.80 based on vari-ability measured in our previous work (Karl et al., 2016). Although a 25% difference in appetite ratings is larger than the 8%–10% difference deemed to be of practical relevance (Blundell et al., 2010),>25% differences have been reported in previous studies comparing the impact of higher and lower protein meals on appetite (Dhillon et al., 2016). Statistical analyses were completed using SPSS v.21 (IBM Analytics; Armonk, NY). All data were checked to verify adherence to model assumptions and log10-transformed when necessary.
Data are presented as mean–SD unless otherwise noted, and statistical significance was set atp£0.05.
The effects of study day, diet (SP and HP), and their in-teraction on outcomes measured on SL day 12 and HA days 1 and 18 were tested using linear mixed models, generalized linear mixed models, and repeated measures ANOVA. Ap-petite ratings measured hourly on SL day 12 and HA days 1 and 18 were analyzed using area under the curve calculated from ground (AUC; where ground is y=0).
The effects of study day, diet, carbohydrate ingestion during exercise (145 g and 0 g carbohydrate), time, and their interactions on appetite ratings and hormone concentrations measured on SL day 7 and HA days 0 and 21 were tested using linear mixed models. All possible interactions except any between dietary protein group and carbohydrate sup-plement group were included in these models. Appetite rat-ings measured during and after the standardized meal test were analyzed using the metrics AUC, rate of change in ap-petite ratings during the meal, and rate of change in apap-petite
ratings after the meal, and therefore, models did not include time as a variable. To calculate rates of change, slopes were extracted from linear regression models run separately for each individual using the appetite ratings measured from 0 to 15 minutes during the meal and from 15 to 120 minutes after the meal. To aid in interpretation of hormone analyses, models were reduced by removing effects that did not sig-nificantly contribute to the overall model fit until the most parsimonious model was reached. As expected, dietary pro-tein group did not impact outcomes measured on SL day 7 and HA days 0 and 21, and therefore, results are presented with groups combined for outcomes measured on those days. In addition, hormones were analyzed both as measured and after adjusting for plasma volume changes (Dill and Costill, 1974). Plasma volume adjustment did not affect interpreta-tion of the results, and only unadjusted values are reported. For all models, when a significant interaction or main effect was observed,t-tests with Bonferroni corrections were used to identify pairwise differences.
Results
During SL testing, one individual from each diet group withdrew, and one individual from each diet group was withdrawn for nonadherence with study procedures. As such, 17 of 21 enrolled participants completed both the SL and HA phases (Table 1). Primary study outcomes are reported elsewhere (Berryman et al., 2017). Briefly, participants were weight stable during SL (mean weight change 0.7 kg [95% CI:-0.3 to 1.7],p=0.21). Total weight loss during HA (SP: 7.2–2.4 kg vs. HP: 7.0–0.9 kg; diet-by-day interaction,
p=0.88) and fat-free mass loss during HA as measured by dual energy X-ray absorptiometry (SP: 4.0–3.3 kg vs HP: 3.2–1.5 kg; diet-by-day interaction,p=0.53) did not differ by dietary protein group.
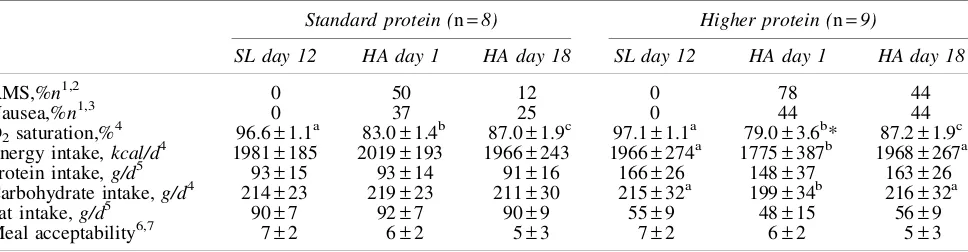
Lake Louise scores were elevated on HA days 0–3 relative to SL, but not thereafter (main effect of day,p<0.01), and did not differ by diet group (data not shown). On HA days 1 and 18 (i.e., full-day appetite testing) the incidence of acute mountain sickness was higher relative to SL (main effect of day,
p<0.001), but did not differ by diet group (Table 2). Oxygen saturation decreased upon arrival at HA and remained below SL values throughout HA (main effect of time,p<0.01) and did not differ by diet group (data not shown). However, when only SL day 12 and HA days 1 and 18 were included in the model, oxygen saturation was lower in HP relative to SP on HA day 1 (diet-by-day interaction,p=0.02; Table 2).
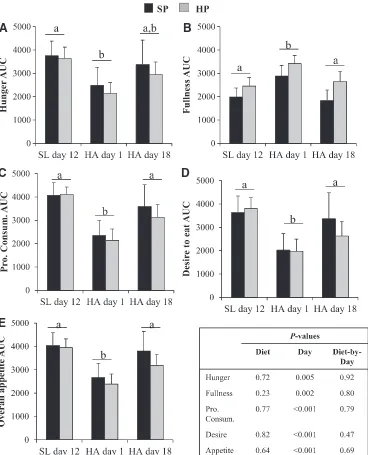
Effects of protein intake on appetite and food preferences during energy deficit at HA (SL day 12 and HA days 1 and 18)
Overall meal acceptability was lower on HA days 1 and 18 relative to SL (main effect of day,p<0.001) independent of dietary protein group (Table 2).
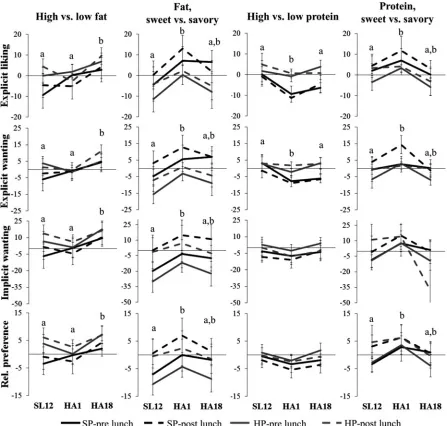
Responses to the LFPQ indicated changes in food prefer-ences over time independent of dietary protein group (Fig. 3). Specifically, an increased preference for sweet over savory foods across all domains of the LFPQ and a conscious pref-erence for low-protein over high-protein foods was observed on HA day 1 (main effect of day,p<0.05), but not HA day 18, relative to SL. An increased preference for high-fat over low-fat food across all domains of the LFPQ was observed on HA day 18 relative to SL day 12 and HA day 1 (main effect of day,p<0.05).
Scores on the Control of Eating Questionnaire indicated that the overall strength and frequency of food cravings were higher during the final week of HA relative to the final week at SL (main effect of day,p=0.03) (Supplementary Table S2). Si-milarly, scores on the Food Craving Inventory indicated higher total food cravings during HA relative to the final week at SL (main effect of day, p=0.03) which was attributable to an increase in cravings for high fat and fast foods (main effect of day, p£0.02) (Supplementary Table S2). No food craving metric differed between dietary protein groups.
Longitudinal changes in appetite and appetite-mediating hormones during acclimatization and weight loss at HA (SL day 7 and HA days 0 and 21)
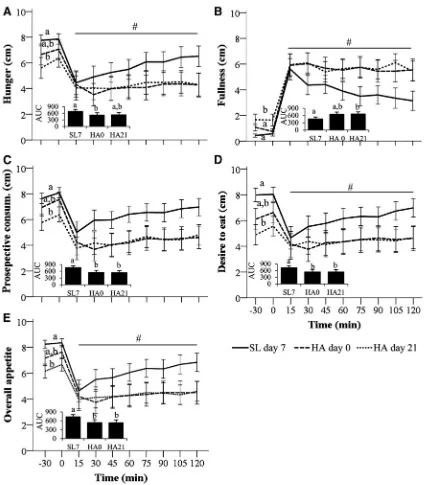
Appetite responses to a standardized test meal. Appetite responses to the standardized meal test administered on SL day 7 and HA days 0 and 21 indicated changes in appetite responses over time that were independent of both dietary protein group and carbohydrate supplementation during ex-ercise. Specifically, hunger AUC was lower on HA day 0, but not HA day 21, relative to SL, whereas fullness AUC was higher on HA day 21, but not HA day 0, relative to SL (main effect of day, p£0.03; Fig. 4A, B). Overall appetite,
pro-spective consumption, and desire to eat AUC were lower on HA days 0 and 21 relative to SL (main effect of day,p£0.01; Fig. 4C–E). These differences were attributable to a combi-nation of differences in premeal appetite ratings (main effect of day, p<0.05) and differences in the rate of change in appetite ratings during the postprandial period (main effect of day,p£0.01) across study days (Fig. 4). No differences be-tween days in the rate of change in any appetite rating mea-sured during the meal (0–12 minutes) were observed (main effect of day,p>0.05). The overall acceptability of the meal was rated as ‘‘moderately liked’’ (mean score=7.1–1.6), which did not change over time (main effect of day,p=0.10) or differ between dietary protein groups (main effect of diet,
p=1.00).
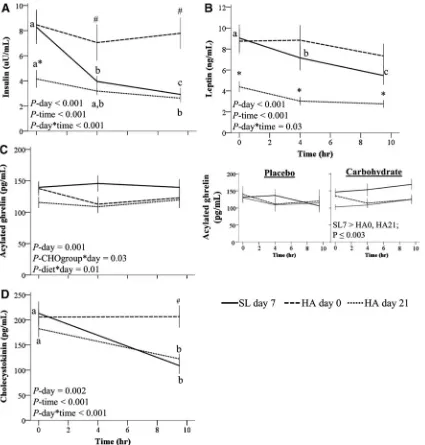
Appetite-mediating hormones. Insulin, leptin, acylated ghrelin, and CCK concentrations measured before the stan-dardized meal test indicated changes over time that were independent of dietary protein group. Specifically, fasting insulin concentrations were higher on SL day 7 and HA day 0 relative to HA day 21 and decreased during the day on SL day 7 and HA day 21, but not on HA day 0 (Fig. 5A). Leptin concentrations decreased during the day at SL but not during HA days 0 and 21 and were higher at all time points on SL day 7 and HA day 0 relative to HA day 21 (Fig. 5B).
Acylated ghrelin concentrations measured during the day were affected by carbohydrate supplementation during ex-ercise (Fig. 5C). In the carbohydrate group, mean acylated ghrelin concentrations were lower during HA days 0 and 21 relative to SL. In the placebo group, ghrelin concentrations did not differ across study days. A diet-by-day interaction was observed for aclyated ghrelin concentrations measured before the fixed meal (p=0.01). However,post hoctesting indicated that the interaction was due to higher acylated ghrelin concentrations at HA day 0 in HP relative to SP (p=0.03). As consumption of the intervention diets did not start until HA day 1, this result was considered unrelated to
Table 2. Acute Mountain Sickness, Oxygen Saturation, Actual Dietary Intakes, and Meal Acceptability Measured During Appetite Testing Days Conducted at Sea Level and While Living at High Altitude(4300m)
Standard protein (n=8) Higher protein (n=9)
SL day 12 HA day 1 HA day 18 SL day 12 HA day 1 HA day 18
AMS,%n1,2 0 50 12 0 78 44
Nausea,%n1,3 0 37 25 0 44 44
O2saturation,%4 96.6–1.1a 83.0–1.4b 87.0–1.9c 97.1–1.1a 79.0–3.6b* 87.2–1.9c
Energy intake,kcal/d4 1981–185 2019–193 1966–243 1966–274a 1775–387b 1968–267a Protein intake,g/d5 93–15 93–14 91–16 166–26 148–37 163–26 Carbohydrate intake,g/d4 214–23 219–23 211–30 215–32a 199–34b 216–32a Fat intake,g/d5 90–7 92–7 90–9 55–9 48–15 56–9 Meal acceptability6,7 7–2 6–2 5–3 7–2 6–2 5–3
Values are%nor mean–SD. 1
Generalized linear mixed model with Bonferroni corrections; subject included as a random factor, and diet, day, and their interaction as fixed factors. Main effect of day (p<0.001); incidence higher on HA days 1 and 18 relative to SL.
2
Acute mountain sickness (AMS) was defined as a Lake Louise score>0.7 on the shortened version of the Environmental Symptoms Questionnaire (Beidleman et al., 2007).
3
Incidence of nausea defined as slight to extreme nausea reported on the Environmental Symptoms Questionnaire. 4–6
Linear mixed model with Bonferroni corrections; subject included as a random factor, and diet, day, and their interaction as fixed factors.4Diet-by-day interaction,p<0.05.a–cValues within a dietary protein group sharing a superscript letter are not significantly different within that group.5Main effect of group,p<0.001.6Main effect of day (p<0.001); lower acceptability on HA days 1 and 18 relative to SL. 7Overall meal acceptability rated from 1 (dislike extremely) to 9 (like extremely). Values are the mean of ratings at breakfast, lunch, and dinner.
[image:6.612.66.550.82.208.2]the study diets. CCK concentrations decreased during the day on SL day 7 and HA day 21, but not HA day 0 (Fig. 5D).
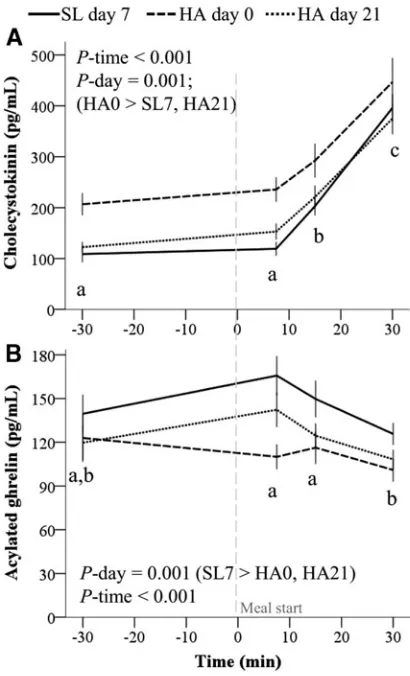
During the standardized meal test, CCK concentrations increased and were higher throughout the test during HA day 0 relative to SL day 7 and HA day 21 (Fig. 6A). Acylated ghrelin concentrations decreased following the standardized meal test and were higher at SL relative to HA (Fig. 6B).
Discussion
The primary finding of this study was that dietary protein intake did not impact appetite during energy deficit at HA.
However, acute HA exposure was associated with appetite suppression concomitant to elevated concentrations of the anorexigenic hormones insulin, leptin, and CCK, depressed concentrations of the orexigenic hormone acylated ghrelin, and preferences for sweet and low-protein foods. Although anorexigenic hormone concentrations did not remain ele-vated following acclimatization and weight loss, appetite and acylated ghrelin concentrations remained depressed while food preferences shifted toward high fat foods.
To our knowledge, this study is the first to examine dif-ferential effects of controlled standard- and higher protein hypocaloric diets on appetite regulation at HA. Contrary to
A
B
C
D
[image:7.612.124.492.57.512.2]E
FIG. 2. Appetite at SL and HA (4300 m) while consuming hypocaloric standard-protein (SP, 1.1 g/kg/d,n=8) or higher protein (HP; 2.1 g/kg/d,n=9) diets. AUC for perceived hunger(A), fullness(B), prospective consumption (Pro. Consum.,)
our hypothesis, protein intake did not significantly impact appetite at SL or during HA exposure (Fig. 2). Of note, between-group differences in overall appetite following ac-climatization and weight loss were sufficiently large to be considered of practical relevance if statistically significant (Blundell et al., 2010). Unfortunately, logistical constraints prevented obtaining a larger sample size, and one limitation of the study is limited statistical power due to the small sample sizes within dietary protein groups.
Additional factors may also have decreased the ability to detect significant effects of protein intake on appetite. First, between-group differences in protein intake ranged from 8 to 19 g/meal, which is less than the 30 g/meal difference others have suggested as a threshold for observing satiety-enhancing effects of higher protein meals (Paddon-Jones and Leidy, 2014). Second, the proportion of total energy intake
derived from liquids was higher in HP relative to SP as a result of the beverage used to increase protein intake, and liquids have been shown to elicit weaker satiety effects than solid foods (Leidy et al., 2011). Given these limitations, the hypothesis that higher protein diets could be counterpro-ductive for maintaining fat-free mass at HA by exacerbating HA anorexia cannot be conclusively refuted and warrants further investigation.
[image:8.612.82.529.58.484.2]A second aim of this study was to explore mechanisms underlying acute HA anorexia and their persistence. Several recent studies have likewise aimed to characterize appetite-mediating hormone responses to acute and chronic hypoxia (Debevec et al., 2014, 2016; Mekjavic et al., 2016), but were conducted at lower simulated altitudes in normobaric hyp-oxia. That environment may elicit different physiological responses than the hypobaric hypoxia at 4300 m studied in
FIG. 3. Food preferences at SL and HA (4300 m) while consuming hypocaloric standard-protein (SP, 1.1 g/kg/d,n=8) or higher protein (HP; 2.1 g/kg/d,n=9) diets. Food preferences were measured before and after lunch on SL day 12 and after 1 and 18 days of living at HA using the Leeds Food Preference Questionnaire. Positive values indicate preference for high fat/ protein and sweet foods, negative values indicate preference for low fat/protein and savory foods. Values are mean–SEM. Effects of diet, day, and their interaction tested using repeated measures ANOVA. Superscripts indicate main effect of day,
this investigation (Millet et al., 2012). Furthermore, in the present study, we tightly controlled physical activity, climate, and diet, factors which may have confounded several previ-ous field studies and contributed to inconsistencies in ob-servations (Sierra-Johnson et al., 2008; Debevec, 2017). However, the absence of a SL control group is a limitation of the present study that prevents establishing causal effects of HA on study outcomes. Although this limitation is less likely
[image:9.612.95.519.55.540.2]to impact study outcomes measured during acute HA, it does preclude definitively separating the impact of acclimatization to HA on study outcomes from factors such as weight loss, diet monotony, and living in a confined environment. Po-tential confounding due to weight loss is particularly im-portant to consider because weight loss independently influences appetite, food preferences, and appetite-mediating hormones (Maclean et al., 2011; Sumithran and Proietto,
2013). As such, observed changes following acclimatization must be interpreted cautiously and within the context of the known effects of weight loss on study outcomes.
Appetite suppression during acute HA exposure is a well-established response (Hamad and Travis, 2006; Westerterp and Kayser, 2006) and was supported in the present study (Figs. 2 and 4). While previous studies report that appetite remains suppressed at very high altitudes (>5000 m) for several weeks (Rose et al., 1988; Westerterp-Plantenga et al., 1999), others suggest that appetite suppression may be alle-viated during chronic (>7 days) exposure to altitudes below
[image:10.612.95.520.57.502.2]5000 m, at least under normobaric hypoxic conditions [3000– 4000 m (Debevec et al., 2014, 2016; Mekjavic et al., 2016)]. In the present study, appetite was lower during the meal test on HA day 21 relative to SL and did not differ from SL on HA day 18 despite substantial weight loss. It is well established that weight loss stimulates compensatory mechanisms which act to stimulate appetite and restore body weight (Maclean et al., 2011; Sumithran and Proietto, 2013). Therefore, as we are not aware of any reports demonstrating weight regain in people sojourning at >4000 m for‡3 weeks, these findings suggest that normal physiologic adaptations to weight loss
FIG. 5. Appetite-mediating hormones at HA (4300 m). (A) Insulin (n=17; log10-transformed for analysis),(B) leptin
(n=16),(C)acylated ghrelin (n=17), and(D)cholecystokinin (n=17) measured at SL, on the first day of HA exposure and after 21 days of living at HA. Volunteers consumed a hypocaloric standard-protein (1.1 g/kg/d, n=8) or higher protein (2.1 g/kg/d, n=9) diet while living at HA. Values are mean–SEM. Effects of diet group (standard- or higher protein), carbohydrate group (carbohydrate beverage or placebo), day, time, and all interactions not including those between diet group and carbohydrate group were tested using linear mixed models with subject included as a random factor and Bonferroni corrections. Only significant effects (p<0.05) from the parsimonious model are listed. Within a study day, values not sharing a superscript letter are significantly different,p<0.05. *Different from SL day 7 and HA day 0,p£0.03.
#Different from SL day 7 and HA day 21,p£0.03. CHOgroup, carbohydrate supplementation during exercise at 4.5 hours
that stimulate weight regain may be blunted and persistent appetite suppression may be a relevant concern during so-journ at‡4300 m for several weeks. Studies with appropriate control groups are needed to verify this hypothesis.
Our findings suggest, but do not prove, that the orexigenic hormone ghrelin may be one factor in the persistence of HA anorexia. Previous studies have reported that total ghrelin concentrations are transiently suppressed in response to hypoxia (Shukla et al., 2005; Riepl et al., 2012; Debevec et al., 2014, 2016; Mekjavic et al., 2016). However, the rel-evance of these findings to appetite regulation is unclear because the appetite-stimulating effects of ghrelin require posttranslational acylation (Lim et al., 2010), and acylated ghrelin comprises only a small variable fraction of total ghrelin concentrations (Liu et al., 2008). Previous studies measuring acylated ghrelin responses to HA have reported
suppressed concentrations during 5–7 hours of exposure to normobaric hypoxia simulating altitudes of 3500–4000 m (Wasse et al., 2012; Matu et al., 2017a, 2017b), but not
<3000 m (Morishima and Goto, 2016), and suppressed con-centrations during a 12-day trek to 5140 m (Matu et al., 2017a, 2017b). Our findings are consistent with and extend those results by demonstrating that the suppression of acyl-ated ghrelin concentrations upon acute HA exposure may be sustained for up to 21 days (Figs. 5C and 6B). Importantly, this observation is not likely confounded by weight loss as weight loss at SL is associated with increased acylated ghrelin concentrations (Martins et al., 2010).
Whether the 12%–22% lower mean acylated ghrelin con-centrations observed at HA relative to SL in our study would be sufficient to cause changes in energy intake had volunteers been given free access to food was not assessed. However, Wasse et al. (2012) reported an 18% reduction in acylated ghrelin concentrations and 31% reduction in voluntary en-ergy intake in response to 7-hour exposure to hypoxia sim-ulating 4000 m altitude, while Matu et al. (2017a, 2017b) recently reported a*25% reduction in both fasting acylated ghrelin concentrations and in voluntary energy intake during a 12-day trek to 5140 m. Although appetite regulation at HA is undoubtedly influenced by multiple factors, collectively these studies suggest, but do not prove, a role for acylated ghrelin in HA anorexia. Additional studies with appropriate controls are warranted to confirm the hypothesis that HA suppresses acylated ghrelin concentrations and that this effect meaningfully impacts energy intake.
Our findings suggest that elevations in insulin, leptin, and CCK occur concomitant to appetite suppression during acute HA exposure. Elevated insulin concentrations during initial HA exposure are consistent with previous reports of transient hypoxia-induced impairments in insulin sensitivity and glu-cose homeostasis (Barnholt et al., 2006; Woolcott et al., 2015). Leptin concentrations also reportedly increase during the initial 24 hours of hypoxia (Tschop et al., 1998; Snyder et al., 2008). However, whether this effect persists is con-troversial because of inconsistent findings across multiple studies (Zaccaria et al., 2004; Shukla et al., 2005; Barnholt et al., 2006; Vats et al., 2007; Debevec et al., 2014, 2016; Mekjavic et al., 2016) attributable to differences in the con-trol of confounding factors (Raff et al., 2008; Sierra-Johnson et al., 2008; Debevec, 2017). In particular, differences in the timing of measurements may be critical as reductions in food intake due to HA anorexia would provide a strong stimulus to suppress leptin concentrations within 48–72 hours (Karl et al., 2016).
[image:11.612.78.283.57.395.2]Although results from the present study support a transient elevation in insulin and leptin concentrations during HA sojourn (Fig. 5), both hormones decrease with fat mass loss. As such, similar to most previous studies (Zaccaria et al., 2004; Shukla et al., 2005; Vats et al., 2007; Riepl et al., 2012; Debevec et al., 2014, 2016; Mekjavic et al., 2016), the lack of a weight stable control group precludes isolating the inde-pendent effect of acclimatization to HA on insulin and leptin. CCK is secreted during meals and limits meal size by stimulating satiation (Woods, 2009). We hypothesized that hypoxia may induce a faster rise in CCK concentrations during meals thereby accounting for the more rapid onset of satiation previously observed at HA (Westerterp-Plantenga et al., 1999). Although the data did not support a faster rise in CCK at HA (Fig. 6A), mean CCK concentrations were higher
relative to SL after 10 hours of exposure to HA (Fig. 6A, D). However, this difference did not occur concomitant to in-creased fullness immediately following the standard test meal where the effects of CCK on satiation would be ex-pected to occur. That observation, in combination with pre-vious studies reporting decreases [3454 m,<72 hours; (Riepl et al., 2012)], no changes [4559 m, two and four days; (Ae-berli et al., 2013)], and increases [20-day trek to 5100 m (Bailey et al., 2000)] in CCK concentrations at HA, indicates that additional research is needed to clarify the role of CCK, if any, in HA anorexia.
A potential strategy for overriding physiologic signals contributing to HA anorexia may be to provide highly pal-atable foods that exploit hedonic (i.e., pleasure and reward) pathways impacting eating behavior (Berthoud, 2006). Pre-sently, the effects of hypoxia on food hedonics and subse-quent food intake are unclear as previous reports on changes in taste perception and food hedonics (Premavalli et al., 2009; Aeberli et al., 2013) and self-selected macronutrient intake (Boyer and Blume, 1984; Rose et al., 1988; Reynolds et al., 1998; Westerterp-Plantenga et al., 1999; Bailey et al., 2004; Aeberli et al., 2013) at HA are inconsistent.
In the present study, HA exposure was acutely associated with a preference for sweet over savory foods and liking of low-protein over higher protein foods suggesting that sweet, low-protein foods may encourage eating during acute HA. The subsequent transition to a preference for high-fat foods suggests that a high-fat diet may have greater utility for promoting food intake following acclimatization. However, these hypotheses require confirmation as the design of this study precludes determining whether observed changes would have influenced ad libitumfood intake, and factors such as diet monotony, limited food variety, and weight loss may have also impacted results. Nonetheless, our findings extend those of Aeberli et al. (2013) who used the same food preference assessment method to demonstrate that perceived liking of high-fat foods increased and was positively asso-ciated withad libitumenergy intake during a four day sojourn at HA (4559 m). One implication of these findings is that diet recommendations for HA sojourn may differ according to the duration of sojourn if the aim is to leverage hedonic mech-anisms to promote energy intake and minimize weight loss.
Finally, while the present findings suggest that high protein and savory foods may not be preferred upon initial HA ex-posure, dietary protein intake within the levels studied did not appear to differentially influence food preferences. Using the same food preference assessment methodology, Griffioen-Roose et al. (2012) reported that a 14-day low-protein (0.5 g/ kg/d) diet stimulated a compensatory response characterized by an increased drive to consume protein and protein intake. That food preferences were not influenced by dietary protein intake in the present study suggests that the protein content of the standard-protein diet was sufficient to prevent this re-sponse. It is also acknowledged that an increased drive to consume protein when protein intake is low, known as the protein leverage hypothesis, has not been observed in all studies (Martens et al., 2013).
Conclusion
Taken together, these findings suggest that maximizing the effectiveness of dietary strategies for mitigating weight loss at HA may require overriding physiologic signals that
sup-press appetite, accommodating food preferences, and ad-justing diets to both the duration and elevation of the sojourn. These observations in combination with the absence of a SL control group highlight the need for additional research with appropriate controls to establish causal effects of prolonged HA exposure on appetite, appetite-mediating hormones, and food preferences. Contrary to our hypothesis, a higher protein diet did not exacerbate HA anorexia in the present study. However, study limitations preclude definitive conclusions, and the potential for the satiating properties of protein to reduce ad libitum food intake at HA and the possible in-congruence of higher protein diets with food preferences at HA warrant further investigation.
Acknowledgments
The authors thank the study volunteers, our medical oversight team, and Dr. Stephen Muza for their support and the Pennington Biomedical Research Center Clinical La-boratory staff, Marques Wilson, Christopher Carrigan, Adrienne Hatch, Laura Lutz, Adam Luippold, Bradley An-derson, Grant Holmes, Anthony Karis, Karleigh Bradbury, Alyssa Kelley, Dr. Lee Margolis, Dr. Stephen Hennigar, Dr. Robert Kenefick, and Dr. Scott Montain for their significant contributions.
This work was supported by the U.S. Army Medical Re-search and Materiel Command and the U.S. Department of Defense, Defense Health Program.
Disclaimers
The views, opinions, and/or findings contained in this re-port are those of the author(s) and should not be construed as an official Department of the Army position, policy, or de-cision, unless so designated by other official documentation. Citation of trade names in this report does not constitute an official Department of the Army endorsement or approval of the use of such commercial items.
Author Disclosure Statement
No authors report a conflict of interest.
References
Aeberli I, Erb A, Spliethoff K, Meier D, Gotze O, Fruhauf H, Fox M, Finlayson GS, Gassmann M, Berneis K, Maggiorini M, Langhans W, and Lutz TA. (2013). Disturbed eating at high altitude: Influence of food preferences, acute mountain sickness and satiation hormones. Eur J Nutr 52:625–635. Bailey DM, Ainslie PN, Jackson SK, Richardson RS, and
Ghatei M. (2004). Evidence against redox regulation of en-ergy homoeostasis in humans at high altitude. Clin Sci (Lond) 107:589–600.
Bailey DM, Davies B, Milledge JS, Richards M, Williams SR, Jordinson M, and Calam J. (2000). Elevated plasma chole-cystokinin at high altitude: Metabolic implications for the anorexia of acute mountain sickness. High Alt Med Biol 1:9– 23.
Beidleman BA, Muza SR, Fulco CS, Rock PB, and Cymerman A. (2007). Validation of a shortened electronic version of the environmental symptoms questionnaire. High Alt Med Biol 8: 192–199.
Benso A, Broglio F, Aimaretti G, Lucatello B, Lanfranco F, Ghigo E, and Grottoli S. (2007). Endocrine and metabolic responses to extreme altitude and physical exercise in climbers. Eur J Endocrinol 157:733–740.
Berryman CE, Young AJ, Karl JP, Kenefick RW, Margolis LM, Cole RE, Carbone JW, Lieberman HR, Kim I, Fernando A, and Pasiakos SM. (2017). Severe negative energy balance during 21 d at high altitude decreases fat-free mass regardless of die-tary protein intake: A randomized controlled trial. FASEB J [Epub ahead of print]; DOI: 10.1096/fj.201700915R.
Berthoud HR. (2006). Homeostatic and non-homeostatic path-ways involved in the control of food intake and energy bal-ance. Obesity (Silver Spring) 14 Suppl 5:197S–200S. Blundell J, de Graaf C, Hulshof T, Jebb S, Livingstone B, Lluch
A, Mela D, Salah S, Schuring E, van der Knaap H, and Westerterp M. (2010). Appetite control: Methodological as-pects of the evaluation of foods. Obes Rev 11:251–270. Boyer SJ, and Blume FD. (1984). Weight loss and changes in
body composition at high altitude. J Appl Physiol Respir Environ Exerc Physiol 57:1580–1585.
Dalton M, Finlayson G, Hill A, and Blundell J. (2015). Pre-liminary validation and principal components analysis of the control of eating questionnaire (CoEQ) for the experience of food craving. Eur J Clin Nutr 69:1313–1317.
Debevec T. (2017). Hypoxia-related hormonal appetite modu-lation in humans during rest and exercise: Mini review. Front Physiol 8:366.
Debevec T, Simpson EJ, Macdonald IA, Eiken O, and Mekjavic IB. (2014). Exercise training during normobaric hypoxic confinement does not alter hormonal appetite regulation. PLoS One 9:e98874.
Debevec T, Simpson EJ, Mekjavic IB, Eiken O, and Macdonald IA. (2016). Effects of prolonged hypoxia and bed rest on appetite and appetite-related hormones. Appetite 107:28–37. Dhillon J, Craig BA, Leidy HJ, Amankwaah AF, Osei-Boadi Anguah K, Jacobs A, Jones BL, Jones JB, Keeler CL, Keller CE, McCrory MA, Rivera RL, Slebodnik M, Mattes RD, and Tucker RM. (2016). The effects of increased protein intake on fullness: A meta-analysis and its limitations. J Acad Nutr Diet 116:968–983.
Dill DB, and Costill DL. (1974). Calculation of percentage changes in volumes of blood, plasma, and red cells in dehy-dration. J Appl Physiol 37:247–248.
Ellis AC, Chandler-Laney P, Casazza K, Goree LL, McGwin G, and Gower BA. (2012). Circulating ghrelin and glp-1 are not affected by habitual diet. Regul Pept 176:1–5.
Finlayson G, King N, and Blundell JE. (2007). Is it possible to dissociate ‘liking’ and for foods in humans? A novel exper-imental procedure. Physiol Behav 90:36–42.
Griffioen-Roose S, Mars M, Siebelink E, Finlayson G, Tome D, and de Graaf C. (2012). Protein status elicits compensatory changes in food intake and food preferences. Am J Clin Nutr 95:32–38.
Hamad N, and Travis SP. (2006). Weight loss at high altitude: Pathophysiology and practical implications. Eur J Gastro-enterol Hepatol 18:5–10.
Hoyt RW, Jones TE, Baker-Fulco CJ, Schoeller DA, Schoene RB, Schwartz RS, Askew EW, and Cymerman A. (1994). Doubly labeled water measurement of human energy ex-penditure during exercise at high altitude. Am J Physiol 266: R966–R971.
Karl JP, Smith TJ, Wilson MA, Bukhari AS, Pasiakos SM, McClung HL, McClung JP, and Lieberman HR. (2016). Al-tered metabolic homeostasis is associated with appetite reg-ulation during and following 48-h of severe energy deprivation in adults. Metabolism 65:416–427.
Karl JP, Young AJ, and Montain SJ. (2011). Eating rate during a fixed-portion meal does not affect postprandial appetite and gut peptides or energy intake during a subsequent meal. Physiol Behav 102:524–531.
Kayser B, Narici M, Milesi S, Grassi B, and Cerretelli P. (1993). Body composition and maximum alactic anaerobic performance during a one month stay at high altitude. Int J Sports Med 14:244–247.
Leidy HJ, Bales-Voelker LI, and Harris CT. (2011). A protein-rich beverage consumed as a breakfast meal leads to weaker appetitive and dietary responses v. a protein-rich solid breakfast meal in adolescents. Br J Nutr 106:37–41. Leidy HJ, Clifton PM, Astrup A, Wycherley TP,
Westerterp-Plantenga MS, Luscombe-Marsh ND, Woods SC, and Mattes RD. (2015). The role of protein in weight loss and mainte-nance. Am J Clin Nutr 101:1320S–1329S.
Lim CT, Kola B, Korbonits M, and Grossman AB. (2010). Ghrelin’s role as a major regulator of appetite and its other functions in neuroendocrinology. Prog Brain Res 182:189–205. Liu J, Prudom CE, Nass R, Pezzoli SS, Oliveri MC, Johnson ML, Veldhuis P, Gordon DA, Howard AD, Witcher DR, Geysen HM, Gaylinn BD, and Thorner MO. (2008). Novel ghrelin assays provide evidence for independent regulation of ghrelin acylation and secretion in healthy young men. J Clin Endocrinol Metab 93:1980–1987.
Maclean PS, Bergouignan A, Cornier MA, and Jackman MR. (2011). Biology’s response to dieting: The impetus for weight regain. Am J Physiol Regul Integr Comp Physiol 301:R581– R600.
Martens EA, Lemmens SG, and Westerterp-Plantenga MS. (2013). Protein leverage affects energy intake of high-protein diets in humans. Am J Clin Nutr 97:86–93.
Martins C, Kulseng B, King NA, Holst JJ, and Blundell JE. (2010). The effects of exercise-induced weight loss on appetite-related peptides and motivation to eat. J Clin En-docrinol Metab 95:1609–1616.
Matu J, Deighton K, Ispoglou T, and Duckworth L. (2017a). The effect of moderate versus severe simulated altitude on appetite, gut hormones, energy intake and substrate oxidation in men. Appetite 113:284–292.
Matu J, O’Hara J, Hill N, Clarke S, Boos C, Newman C, Holdsworth D, Ispoglou T, Duckworth L, Woods D, Mellor A, and Deighton K. (2017b). Changes in appetite, energy intake, body composition, and circulating ghrelin constituents during an incremental trekking ascent to high altitude. Eur J Appl Physiol [Epub ahead of print]; DOI: 10.1007/s00421-017-3683-0.
Mekjavic IB, Amon M, Kolegard R, Kounalakis SN, Simpson L, Eiken O, Keramidas ME, and Macdonald IA. (2016). The effect of normobaric hypoxic confinement on metabolism, gut hormones, and body composition. Front Physiol 7:202. Millet GP, Faiss R, and Pialoux V. (2012). Point: Hypobaric
hypoxia induces different physiological responses from nor-mobaric hypoxia. J Appl Physiol (1985) 112:1783–1784. Morishima T, and Goto K. (2016). Ghrelin, GLP-1, and leptin
responses during exposure to moderate hypoxia. Appl Physiol Nutr Metab 41:375–381.
Pasiakos SM, Austin KG, Lieberman HR, and Askew EW. (2013a). Efficacy and safety of protein supplements for U.S. Armed forces personnel: Consensus statement. J Nutr 143: 1811S–1814S.
Pasiakos SM, Berryman CE, Carrigan CT, Young AJ, and Carbone JW. (2017). Muscle protein turnover and the mo-lecular regulation of muscle mass during hypoxia. Med Sci Sports Exerc 49:1340–1350.
Pasiakos SM, Cao JJ, Margolis LM, Sauter ER, Whigham LD, McClung JP, Rood JC, Carbone JW, Combs GF, Jr., and Young AJ. (2013b). Effects of high-protein diets on fat-free mass and muscle protein synthesis following weight loss: A randomized controlled trial. FASEB J 27:3837–3847. Pasiakos SM, Margolis LM, and Orr JS. (2015a). Optimized
dietary strategies to protect skeletal muscle mass during pe-riods of unavoidable energy deficit. FASEB J 29:1136–1142. Pasiakos SM, Sepowitz JJ, and Deuster PA. (2015b). U.S. military dietary protein recommendations: A simple but often confused topic. J Spec Oper Med 15:89–95.
Premavalli KS, Wadikar DD, and Nanjappa C. (2009). Comparison of the acceptability ratings of appetizers under laboratory, base level and high altitude field conditions. Appetite 53:127–130. Raff H, Molthen R, Pan W, Kastin AJ, Ye J, Ozturk L, Xi L,
Kukreja RC, Cabrera de Leon A, O’Donnell C, Vats P, Guerre-Millo M, Bigard X, and Simler N. (2008). Com-mentaries on viewpoint: Effect of altitude on leptin levels, does it go up or down? J Appl Physiol (1985) 105:1686–1690. Reynolds RD, Lickteig JA, Howard MP, and Deuster PA. (1998). Intakes of high fat and high carbohydrate foods by humans increased with exposure to increasing altitude during an expedition to mt. Everest. J Nutr 128:50–55.
Riepl RL, Fischer R, Hautmann H, Hartmann G, Muller TD, Tschop M, Toepfer M, and Otto B. (2012). Influence of acute exposure to high altitude on basal and postprandial plasma levels of gastroenteropancreatic peptides. PLoS One 7:e44445. Rose MS, Houston CS, Fulco CS, Coates G, Sutton JR, and Cymerman A. (1988). Operation Everest. II: Nutrition and body composition. J Appl Physiol (1985) 65:2545–2551. Shukla V, Singh SN, Vats P, Singh VK, Singh SB, and Banerjee
PK. (2005). Ghrelin and leptin levels of sojourners and accli-matized lowlanders at high altitude. Nutr Neurosci 8:161–165. Sierra-Johnson J, Romero-Corral A, Somers VK, and Johnson BD. (2008). Effect of altitude on leptin levels, does it go up or down? J Appl Physiol (1985) 105:1684–1685.
Snyder EM, Carr RD, Deacon CF, and Johnson BD. (2008). Overnight hypoxic exposure and glucagon-like peptide-1 and leptin levels in humans. Appl Physiol Nutr Metab 33:929–935. Sumithran P, and Proietto J. (2013). The defence of body weight: A physiological basis for weight regain after weight loss. Clin Sci (Lond) 124:231–241.
Thomas DT, Erdman KA, and Burke LM. (2016). American College of Sports Medicine joint position statement. Nutrition and athletic performance. Med Sci Sports Exerc 48:543–568.
Tschop M, Strasburger CJ, Hartmann G, Biollaz J, and Bartsch P. (1998). Raised leptin concentrations at high altitude as-sociated with loss of appetite. Lancet 352:1119–1120. Vats P, Singh VK, Singh SN, and Singh SB. (2007). High
al-titude induced anorexia: Effect of changes in leptin and ox-idative stress levels. Nutr Neurosci 10:243–249.
Veldhorst M, Smeets A, Soenen S, Hochstenbach-Waelen A, Hursel R, Diepvens K, Lejeune M, Luscombe-Marsh N, and Westerterp-Plantenga M. (2008). Protein-induced satiety: Effects and mechanisms of different proteins. Physiol Behav 94:300–307.
Wasse LK, Sunderland C, King JA, Batterham RL, and Stensel DJ. (2012). Influence of rest and exercise at a simulated al-titude of 4,000 m on appetite, energy intake, and plasma concentrations of acylated ghrelin and peptide YY. J Appl Physiol (1985) 112:552–559.
Westerterp-Plantenga MS, Westerterp KR, Rubbens M, Ver-wegen CR, Richelet JP, and Gardette B. (1999). Appetite at ‘‘high altitude’’ [Operation Everest III (Comex-’97)]: A simulated ascent of Mount Everest. J Appl Physiol (1985) 87: 391–399.
Westerterp KR, and Kayser B. (2006). Body mass regulation at altitude. Eur J Gastroenterol Hepatol 18:1–3.
Westerterp KR, Kayser B, Wouters L, Le Trong JL, and Ri-chalet JP. (1994). Energy balance at high altitude of 6,542 m. J Appl Physiol (1985) 77:862–866.
White MA, and Grilo CM. (2005). Psychometric properties of the food craving inventory among obese patients with binge eating disorder. Eat Behav 6:239–245.
Woods SC. (2009). The control of food intake: Behavioral versus molecular perspectives. Cell Metab 9:489–498. Woolcott OO, Ader M, and Bergman RN. (2015). Glucose
homeostasis during short-term and prolonged exposure to high altitudes. Endocr Rev 36:149–173.
Wycherley TP, Moran LJ, Clifton PM, Noakes M, and Brinkworth GD. (2012). Effects of energy-restricted high-protein, low-fat compared with standard-protein, low-fat diets: A meta-analysis of randomized controlled trials. Am J Clin Nutr 96:1281–1298. Zaccaria M, Ermolao A, Bonvicini P, Travain G, and Varnier M. (2004). Decreased serum leptin levels during prolonged high altitude exposure. Eur J Appl Physiol 92:249–253.
Address correspondence to:
J. Philip Karl, PhD, RD Military Nutrition Division U.S. Army Research Institute of Environmental Medicine 10 General Greene Avenue, Building 42 Natick, MA 01760