R E S E A R C H A R T I C L E
Open Access
A joint analysis of metabolomics and genetics of
breast cancer
Xiaohu Tang
1,2, Chao-Chieh Lin
1,2, Ivan Spasojevic
3, Edwin S Iversen
4, Jen-Tsan Chi
1,2*†and Jeffrey R Marks
5*†Abstract
Introduction:Remodeling of cellular metabolism appears to be a consequence and possibly a cause of oncogenic transformation in human cancers. Specific aspects of altered tumor metabolism may be amenable to therapeutic intervention and could be coordinated with other targeted therapies. In breast cancer, the genetic landscape has been defined most comprehensively in efforts such as The Cancer Genome Atlas (TCGA). However, little is known about how alterations of tumor metabolism correlate with this landscape.
Methods:In total 25 cancers (23 fully analyzed by TCGA) and 5 normal breast specimens were analyzed by gas chromatography/mass spectrometry and liquid chromatography/mass spectrometry, quantitating 399 identifiable metabolites.
Results:We found strong differences correlated with hormone receptor status with 18% of the metabolites elevated in estrogen receptor negative (ER-) cancers compared to estrogen receptor positive (ER+) including many glycolytic and glycogenolytic intermediates consistent with increased Warburg effects. Glutathione (GSH) pathway components were also elevated in ER- tumors consistent with an increased requirement for handling higher levels of oxidative stress. Additionally, ER- tumors had high levels of the oncometabolite 2-hydroxyglutarate (2-HG) and the immunomodulatory tryptophan metabolite kynurenine. Kynurenine levels were correlated with the expression of tryptophan-degrading enzyme (IDO1). However, high levels of 2-HG were not associated with somatic mutations or expression levels ofIDH1orIDH2. BRCA1mRNA levels were positively associated with coenzyme A, acetyl coenzyme A, and GSH and negatively associated with multiple lipid species, supporting the regulation ofACC1andNRF2by BRCA1. Different driver mutations were associated with distinct patterns of specific metabolites, such as lower levels of several lipid-glycerophosphocholines in tumors with mutatedTP53. A strong metabolomic signature associated with proliferation rate was also observed; the metabolites in this signature overlap broadly with metabolites that define ER status as receptor status and proliferation rate were correlated.
Conclusions:The addition of metabolomic profiles to the public domain TCGA dataset provides an important new tool for discovery and hypothesis testing of the genetic regulation of tumor metabolism. Particular sets of metabolites may reveal insights into the metabolic dysregulation that underlie the heterogeneity of breast cancer.
Introduction
It is now well established that significant heterogeneity exists among human breast cancers. This heterogeneity is observable at every level of examination from the macro-scopic to the molecular. Recent large-scale efforts to meas-ure and describe human breast tumor heterogeneity
include The Cancer Genome Atlas (TCGA) where a number of high-throughput ‘omic’ technologies were systemically applied to hundreds of primary cancer speci-mens [1]. Mutation, germ line polymorphisms, DNA copy number, RNA expression, DNA methylation, and protein expression analyses were performed in parallel on a large and carefully curated set of breast cancer specimens to produce the most comprehensive molecular portrait of the disease to date.
One significant metric that was not included in TGCA was an unbiased analysis of tumor metabolism. While metabolic flux cannot be measured in fixed or frozen * Correspondence:[email protected];[email protected]
†Equal contributors
1
Department of Molecular Genetics and Microbiology, Duke University, 268 CARL Building, Research Drive, Durham, NC 27708, USA
5
Department of Surgery, Division of Surgical Sciences, Duke University, 103 Research Drive, Durham, NC 27710, USA
Full list of author information is available at the end of the article
specimens, steady-state levels of numerous key metabo-lites may provide insight into these fundamental pheno-typic traits. A number of studies in cancer have uncovered relationships between genetic abnormalities and various metabolic reprogramming suggesting that key metabolic process can be altered as a result of specific transform-ation events [2-6]. Relatively nonspecific cancer-related events such as increased proliferation may also underlie some of the inferred/observed metabolic remodeling. Glu-cose uptake, serine and glutamine auxotrophy, mitochon-drial oxidative phosphorylation, and cancer-associated fibroblasts all appear to have roles in defining breast can-cer metabolism [7-11]. However, it is not clear whether these regulatory relationships can be observed in all or subsets of human tumors.
Breast cancers are broadly categorized as luminal ver-sus basal types possibly derived from different precursor cells or at least different committed lineages [12-14]. Within these broad categories, alterations in specific driver genes are believed to produce the heterogeneity observed amongst and within breast tumor subtypes. While the identity and frequency of driver alterations are generally different in basal and luminal cancers, there is still considerable overlap. For example, TP53 mu-tations are very common in basal tumors and PI3KCA mutations are common in luminal cancer but neither is subtype exclusive. In contrast, MYC (8q24) amplification is common in both types [1]. Each of these genetic drivers has been associated with specific changes in cellular me-tabolism and therefore may have dominant effects that can be observed across tumor types.
Metabolomic profiling via mass spectrometry or nu-clear magnetic resonance (NMR) is now an established approach that has been employed in several studies to analyze primary human breast tissues (normal and can-cer) [15,16]. Building upon transcriptional profiling of breast cancer, there have also been several efforts to in-tegrate steady-state metabolite levels with specific breast cancer subtypes defined by mRNA expression. Expres-sion subtypes are dominated by estrogen receptor and ERBB2 status and thus, metabolic profiling was per-formed to seek an additional level of information to refine these existing classifications. These analyses identified a subclassification of luminal A-type cancers based on me-tabolite levels and found higher levels of Warburg-associated metabolites in more aggressive cancer types [9,17]. A separate study of breast cancer lipidomic identi-fied the association between palmitate-containing phos-phatidylcholines with estrogen receptor negative and cancer progression and patient survival [18]. However, none of these studies established associations of par-ticular metabolites or metabolic pathways with specific somatic mutations or expression levels that have been extensively characterized in TCGA.
In order to more fully explore the relationship between genetics, tumor type, and metabolic state, we took ad-vantage of our participation in the breast cancer TCGA to perform joint analyses of metabolomics and genetics in a series of primary cancers. From the current study, we were able to identify several genetic determinants of the metabolic heterogeneity of human breast tumors that confirm and extend prior in vitro and in vivo observations.
Methods
Specimen selection and handling
Breast tissues were collected, stored and used under Duke University Medical Center Institutional Review Board (IRB) approved protocols (Pro00012025 and Pro00021284). A waiver of consent was obtained from the Duke IRB to con-duct the study (Pro00021284) and subjects were not re-consented for participation. Twenty-five breast cancers (diagnosed and treated from 1989 to 1998) were se-lected for the current study based on their inclusion in The Cancer Genome Atlas (TCGA). Specifically, we se-lected cases that were either estrogen receptor (ER) positive or negative for both estrogen and progester-one receptors (PR) based on the clinical assay per-formed at the time of initial diagnosis (clinical and demographic information is provided in Table S1 in Additional file 1). Two of the ER + positive cancers were classified as PR negative by the clinical assay. In addition to the cancers, we selected five breast speci-mens obtained from reduction mammoplasties containing substantial amounts of normal epithelium. Each block of tissue was cryostat sectioned to analyze tumor epithelial content based on microscopic examination with a cut-off of 70% tumor nuclei for inclusion. Additional sec-tions were also taken and stored desiccated at −80°C for future use. The remainder of the tissue block was submitted frozen to Metabolon Inc. (Durham, NC, USA) for extraction and metabolomic analysis. After trimming away the cryogenic-embedding compound (OCT), the weight of each sample (27 to 115 mg) was determined and used to normalize the extraction re-agent volume.
Proliferation analysis
expressed as a percentage of the epithelial cells exhibit-ing nuclear stainexhibit-ing.
Metabolomic profiling
The sample preparation process at Metabolon was car-ried out using an automated MicroLab STAR™ system from the Hamilton Company (Reno, NV, USA). Recov-ery standards were added prior to the first step in the extraction process for quality control purposes. Sample preparation was conducted using a proprietary (Metabo-lon, Inc.) series of organic and aqueous extractions to re-move the protein fraction while allowing maximum recovery of small molecules. The resulting extract was divided into two fractions; one for analysis by liquid chromatography (LC) and one for analysis by gas chro-matography (GC). Samples were placed briefly on a Zymark TurboVap (Phoenix Equipment, Inc., Rochester, NY, USA) to remove the organic solvent. Each sample was then frozen and dried under vacuum. Samples were then prepared for the appropriate instrument, either LC/ mass spectrometry (MS) or GC/MS.
The LC/MS portion of the platform is based on a Wa-ters ACQUITY UPLC (WaWa-ters, Milford, MA, USA) and a Thermo-Finnigan LTQ mass spectrometer (Thermo Fisher Scientific, Waltham, MA, USA), which consists of an electrospray ionization (ESI) source and linear ion trap (LIT) mass analyzer. The sample extract was split into two aliquots, dried, then reconstituted in acidic or basic LC-compatible solvents, each of which contained 11 or more injection standards at fixed concentrations. One aliquot was analyzed using acidic positive ion opti-mized conditions and the other using basic negative ion optimized conditions in two independent injections using separate dedicated columns. Extracts reconstituted in acidic conditions were gradient eluted using water and methanol both containing 0.1% formic acid, while the basic extracts, which also used water/methanol, con-tained 6.5 mM ammonium bicarbonate. The MS ana-lysis alternated between MS and data-dependent MS2 scans using dynamic exclusion.
The samples destined for GC/MS analysis were redried under vacuum desiccation for a minimum of 24 hrs prior to being derivatized under nitrogen using bis(trimethylsilyl) tri-flouroacetamide (BSTFA). The GC column was 5% phenyl and the temperature ramp was from 40° to 300°C in a 16 min period. Samples were analyzed on a Thermo-Finnigan Trace DSQ fast-scanning single-quadrupole mass spectrometer using electron impact ionization (Thermo Fisher Scientific). The instrument was tuned and calibrated for mass resolution and mass accuracy on a daily basis. The information output from the raw data files was automatic-ally extracted as discussed below.
For ions with counts greater than 2 million, an accur-ate mass measurement could be performed. Accuraccur-ate
mass measurements could be made on the parent ion as well as fragments. The typical mass error was less than 5 ppm. Fragmentation spectra (MS/MS) were typically generated in a data-dependent manner, but if necessary, targeted MS/MS was employed, such as in the case of lower level signals.
Identification of known chemical entities was based on comparison to metabolomic library entries of purified standards. More than 1,000 commercially available puri-fied standard compounds have been registered into a database for distribution to both the LC and GC plat-forms for determination of their analytical characteris-tics. The combination of chromatographic properties and mass spectra gave an indication of a match to the specific compound or an isobaric entity.
Measurement of 2-hydroxyglutarate
3.5 min 100% B, 3.5 to 4 min 100 to 0% B, 4 to 10 min 0% B. Injection volume: 10μL. The Q1/Q3 (m/z) transitions monitored: 363/147 (2-HG) and 367/151 (2-HG-d4). A set of calibrator samples in corresponding matrix were prepared for calibration by adding appropriate amounts of pure D-2-HG at the following concentration levels: 0, 0.16, 0.54, 1.8, 6, and 20 ug/mL. These samples were ana-lyzed alongside the experimental samples.
Data analysis
For pairwise comparison of metabolites from different sample categories (normal, ER+, ER-), we used Welch’st test. The false discovery rate was estimated using the q value [20].
The data were subjected to hierarchical clustering using Cluster 3.0 and displayed using TreeView [21]. The significance analysis of microarray (SAM) analyses were performed as described using indicated selection criteria [22]. For specific metabolite associations with genetic events, data were analyzed in GraphPad Prism (GraphPad Software, San Diego, CA, USA) for correl-ation and significance.
Genetic mutation and copy number, RNA expression data, and designation of tumor intrinsic subtype were all derived from the publically available TCGA data sets. Primary data were downloaded from the TCGA data portal [23] or analyzed using the online cBioPortal suite of tools [24]. For the cBioPortal, some analyses were per-formed on the ‘TCGA Nature 2012’data set and others on the‘TCGA Provisional’data set.
For analysis of the correlation between each pair of metabolites, Pearson correlations of the level of each pair of metabolites (log2 normalized value) among 399 metabolites from 25 tumors and 5 normal breast tissues were generated. The correlation coefficients were hier-archically clustered by Cluster 3.0 to produce the heat-map plot. For analysis of correlation between individual metabolite and proliferation rate, Pearson correlations between the level of individual metabolite (log2 normal-ized value) and Ki-67% (log2 value) were calculated. The supervised cluster plot was generated based on the correl-ation between individual metabolite levels and prolifera-tion rate (Ki-67%) and displayed by TreeView.
For combined analysis of receptor status and prolifera-tion, normalized metabolic data were natural log trans-formed yielding a symmetric distribution of the data about the mean. We used normal theory linear regres-sion to assess the extent to which the metabolic assay data could be predicted by one, the other or both of the tumor’s receptor status and proliferation rate (Ki-67%). We analyzed each metabolite separately and fit four models for each: (1) the model with intercept only; (2) the model with intercept and receptor status; (3) the model with intercept and log2 proliferation rate; and (4)
the model with intercept, receptor status and log2 prolif-eration rate. We calculated analysis of variance tables for the two nested progressions of models: (1, 2, 4) and (1, 3, 4). We report theP values based on the associated F tests for (a) models 2 over 1, (b) 4 over 2, (c) 3 over 1 and (d) 4 over 3. TheP values in (a) and (c) are for the regression of abundance of the metabolite on receptor status and for the regression of abundance of the metab-olite on proliferation rate, respectively. The P values in (b) and (d) are for the regression of abundance of the metabolite on receptor status while adjusting for prolif-eration rate and for the regression of abundance of the metabolite on the proliferation rate while adjusting for receptor status, respectively.
Results
To date, over 900 primary breast cancers have been pro-filed by the TCGA initiative over a four-year period using an evolving set of molecular analyses. For this rea-son, not all cancers were analyzed by all techniques. For the current metabolomic study, we chose 25 cancers that had passed quality control and were accepted for ana-lysis by TCGA: 16 ER positive (all but two were also PR positive) and 9 cancers that were both ER and PR nega-tive, determined by standard immunopathologic analysis after cytoreductive surgery. Of these, 23 cancers (15 ER + and 8 ER-) were eventually subjected to comprehensive genetic analysis by TCGA. In addition to the cancers, we selected 5 samples of normal breast tissue (from reduction mammoplasties not associated with cancer) that contained a substantial amount of epithelium based on histologic staining. We cut 20 sections from each block for in situ analyses before extraction for the quantitative profiling of small molecules (<1,000 Da) that was performed in a sin-gle batch on the Metabolon platform generating data on 399 identifiable metabolites (Table S2 in Additional file 2 contains the primary data on metabolites).
Primary tissues in this study were distributed into three main categories: (1) normal breast from reduc-tion mammoplasties, (2) ER positive primary breast cancers, and (3) estrogen and PR negative primary can-cers. Of the 25 cancers, all were accepted for TCGA study but only 23 were actually subjected to genetic analysis. The cancers are representative of the major subtypes of the disease based on the PAM50 classifica-tion [25] including basal, HER2, luminal A and luminal B. One sample was designated as ‘not-classified’ (NC). None of the tumors were classified as the relatively un-common‘claudin low’subtype.
remaining 10 ER + tumors clustered with the 9 ER- tumors (Figure 1). This relative heterogeneity of ER + tumors is consistent with previous classification based on gene ex-pression [12,26]. Pictured below the hierarchical clustering dendrogram for 23 of the cancers is TCGA data for the most common gene-based abnormalities (mutation, ampli-fication, homozygous deletion) found in breast cancer, most of which are considered to be driver alterations. Also shown is the PAM50 intrinsic subtype classifier (based on gene expression) of the TCGA analyzed cancers (23 tu-mors) as well as the not-classified (NC) tumor. From this analysis, it is apparent that intrinsic expression tumor sub-types do not define the classification of the tumors by me-tabolite levels.
This composite diagram (Figure 1) demonstrates sev-eral aspects of breast cancer observed across many stud-ies: (1) hormone receptor expression tracks closely with intrinsic subtype; (2) TP53 mutations are very frequent in basal-type cancers; and (3) PIK3CA mutations are common in luminal types. The metabolite-based cluster-ing of these specimens places a group of luminal A can-cers with the normal breast specimens and most of the basal cancers together in a single branch. A middle branch contains a combination of mostly luminal A and B cancers. HER2 cancers, as assigned by expression sub-type (n = 2) or genomic copy number (n = 4) also tend to cluster in this middle branch. Overall, the cancers in the study appear to have a distribution of receptor status,
intrinsic subtype, and genetic alterations typical of an unselected case series.
Estrogen receptor status reflects a broad metabolic division in breast cancer
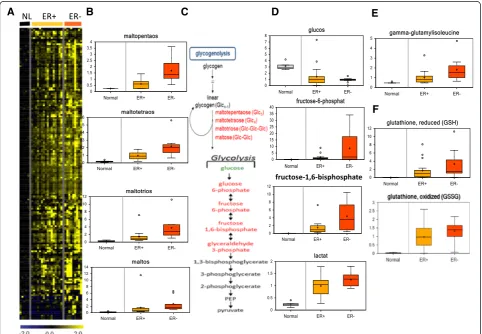
Our next step in the analysis was to compare metabolite levels in the cancers based on ER status (ER + versus ER-), the most consistent division in breast cancer from both a biologic and therapeutic perspective (Figure 2A). Overall, ER status was a very strong divisor in metabolic space. The identity of the metabolites that vary by ER status supports a series of systematic differences in bio-energetics and biosynthetic pathways. Of the 399 named metabolites quantified in this study, 75 exhibited a sta-tistically significant difference between ER + and ER- tu-mors (Table S3 in Additional file 3, unadjusted t tests comparing levels between the three groups of samples, ER+, ER-, and normal breast). Of these, only 8 metabolites
were increased in ER + tumors including 3 carnitine deriv-atives, suggesting an increase in fatty acid transportation in hormone receptor positive cancers. Short- and medium-chain fatty acids were also elevated in ER + tumors whereas long-chain fatty acids and monoacylgly-cerols tended to be higher in ER- tumors indicating that systematic differences in lipolysis and fatty acid oxidation correlate with hormone receptor status.
[image:6.595.57.540.328.662.2]ER- tumors had higher levels of glycogenolytic (malto-pentose, maltotetraose, maltotriose and maltose, Figure 2B and pathways in Figure 2C) and glycolytic metabolites (glucose-6-phosphate, fructose-6-phosphate, fructose-1,6-bisphosphate, and lactate) (Figure 2D). In contrast, there was a lower level of glucose in the tumors, especially ER-tumors (Figure 2D). Warburg metabolism is a means for rapidly dividing cells, such as cancer cells, to accelerate energy production through increased glycolysis and lactate production, bypassing the normal oxidation of pyruvate in
the mitochondria. Thus, the metabolic profile of ER- tu-mors is consistent with an elevated Warburg effect.
To validate our results, we compared our data to re-cently published data on breast cancers collected using the same metabolomic platform [27]. Among the signifi-cant metabolites that tracked with hormone receptor status in our data, 57 of these were found in the Teru-numa dataset and exhibited broadly similar differences between ER + and ER- cancers (27 reaching significance in both data sets, Figure S1 in Additional file 4 and Table S4 in Additional file 5). Therefore, these identified subtype-specific metabolites can be validated using an independent dataset.
Reduced glutathione (GSH) and gamma-glutamyl amino acids in ER- tumors
ER- cancers also had higher levels of gamma-glutamyl amino acids coupled with increased glutathione synthesis (Figure 2E, Figure S2 in Additional file 4). Gamma-glutamyl amino acids result from the transpeptidase-mediated cata-lytic reaction of amino acids with glutathione (Figure S2 in Additional file 4). These amino acid-glutathione conjugates traverse the cell membrane and release the amino acid intra-cellularly to regenerate glutathione [28]. Elevated levels of these gamma-glutamyl conjugates indicate an increased up-take of amino acids in ER- tumors. This may point to a po-tential shift in fuel substrates for energy production that favors amino acid catabolism. It is interesting to note that the most elevated gamma-glutamyl amino acids were the branched-chain amino acid (BCAA) conjugates of valine, leucine and isoleucine. Additionally, ER- tumors had in-creased glutathione (reduced, GSH) and oxidized glutathi-one (GSSG) (Figure 2F) indicating a trend toward increased glutathione synthesis, presumably to cope with the higher levels of oxidative stress.
Metabolite correlations in breast cancers
We postulated that the level of multiple metabolites de-rived from the same and different metabolic pathway might be coordinated and serve as a better indicator of metabolic activity than any single compound alone. Pearson correlations were calculated for all pairwise com-parisons between each of the 399 metabolites for all samples (Table S5 in Additional file 6). The resulting correlation coefficients were then used to group the 399 metabolites into distinct groups by hierarchical clustering (cluster 3.0) and then displayed with TreeView (Figure 3). We found that multiple groups of metabolites were highly clustered and correlated. These groups include many metabolites that are known to be in the same metabolic pathways as well as unexpected correlation between metabolites in dif-ferent metabolic pathways. Metabolites from difdif-ferent pathways clustered in the same groups might indicate two different metabolic pathways are coordinated by the same
genetic alteration or affected similarly by the metabolic reprogramming. For example, we found a cluster of metab-olites comprising many intermediates of various lipids as-sociated with glycerophosphocholines (Figure 3, cluster 3). We also noted two separate clusters of amino acids and di-amino acids (glycine-proline, glutamate-leucine, alanine-tyrosine) (Figure 3, cluster 4) and N-acetyl-amino acids (aspartate, ornithine, N-acetyl-aspartyl-glutamate) (Figure 3, cluster 5). Both clusters may indicate products of protein degradation and catabolism and can be used to identify tumors with higher protein catabolism.
Another prominent cluster is composed of acetyl-CoA, CoA, FAD, AMP as well as GSH and GSSH (Figure 3, cluster 6). The co-cluster of these metabolites suggests a high degree of correlation between these energy metabo-lites and anti-oxidative capacity among the tumor tissues. We also noted connected clusters of metabolites related to glycolysis (fructose, glucose-6-phosphate, fructose-6-phosphate) and glycogenolysis (triose, malto-tetraose, malto-pentose) (Figure 3, cluster 8), both were elevated in ER- cancers (Figure 2).
Metabolites associated with specific genetic events
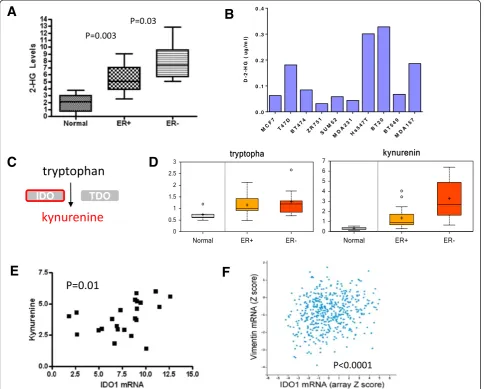
the myc pathway [27]. Levels of IDH1 and IDH2 mRNA in these specimens also did not show a significant cor-relation with 2-HG levels.
A number of reports indicate that alterations in spe-cific genes or genetic pathways can result in detectable metabolic changes in cancer. Our study with both de-tailed gene expression and metabolomic data provided a powerful means to test these associations and discover new ones. One of the least complex of such relationships is the link between the level of the tryptophan-degrading enzyme indoleamine 2,3-dioxygenase (IDO1) and levels of the immunomodulatory metabolite, kynurenine (Figure 4C). Whereas the precursor molecule tryptophan did not vary between ER + and ER- cancers, median levels of kynurenine were significantly elevated in ER- tumors (Figure 4D). From RNAseq data of the 23 cancers in our study, we found a significant correlation between IDO1 expression and kynurenine levels (Figure 3E, r = 0.55,P= 0.01). Comparing
levels of IDO1 mRNA within the TCGA data set (n = 748) revealed a significant positive correlation of IDO1 mRNA levels with vimentin expression (a hallmark of basal can-cers). This finding suggests that kynurenine accumulation commonly occurs in basal cancers and could lead to re-duced immunosurveillance in this tumor type.
BRCA1 has been implicated in a number of metabolic processes including fatty acid synthesis and response to oxidative stress. Using the available RNAseq data, we correlated expression of BRCA1 with metabolite levels in the 23 TCGA cancers (Table S6 in Additional file 7). There was evidence of strong association between high levels of BRCA1 mRNA and elevated acetyl CoA, CoA, 3′dephospho-CoA, and several acylcarnitines all indica-tive of higher levels of fatty acid β-oxidation (Figure 5). This is consistent with the reported ability of BRCA1 to inhibit acetyl-coenzyme A carboxylase 1 (ACC1/ ACACA) leading to reduced fatty acid synthesis and
1
2
3
4
5
6
7
8
caproate_(6:0) caprylate_(8:0) caprate_(10:0) pelargonate_(9:0) laurate_(12:0) glucose
2-myristoylglycerophosphocholine* 1-myristoylglycerophosphocholine 1-palmitoleoylglycerophosphocholine* 2-oleoylglycerophosphocholine* 2-palmitoleoylglycerophosphocholine* sphinganine
sphingosine
1-oleoylglycerophosphocholine phytosphingosine
2-linoleoylglycerophosphocholine*
Amino acids (AA) gamma-glutamyl-AA di-Amino acids
ribose maltose
N-acetylneuraminate
N-acetyl-aspartyl-glutamate_(NAAG) N-acetylaspartate_(NAA)
5
4
3
acetyl_CoA coenzyme_A
glutathione,_reduced_(GSH) glutathione,_oxidized_(GSSG) AMP, ADP, IMP,cAMP FAD
NAD+ putrescine
6
1
cholesterol glycerol_2-phosphate glycerol_3-phosphate_(G3P) glycerophosphorylcholine_(GPC)
7
kynurenine citrate
fructose-6-phosphate glucose-6-phosphate_(G6P) mannose-6-phosphate xylulose
mannose
8
2
[image:8.595.57.538.91.465.2]myristate_(14:0) pentadecanoate_(15:0) palmitate_(16:0) myristoleate_(14:1n5)
increased fatty acid β-oxidation resulting in the accu-mulation of acetyl-CoA and CoA [31]. In contrast, there were strong inverse correlations between BRCA1 levels and membrane components, long-chain fatty acids, and amino acids further supporting the role of BRCA1 in regulating the balance between fatty acid synthesis and oxidation (Figure 5) [32]. In addition, GSH and another antioxidant, 3-(4-hydroxyphenyl)lac-tate were also positively correlated with BRCA1 mRNA levels, supporting its role in activating NRF2, the mas-ter regulator of the oxidative stress response and GSH synthesis [33-35]. BRCA1 mRNA levels did not correl-ate with proliferation or ER status indicating that this is an independent set of variables. Furthermore, the
BRCA1 mRNA did not correlate with the mRNA levels of genes in the fatty acid biosynthesis pathways; con-sistent with posttranscriptional regulation (Figure S4 in Additional file 4).
[image:9.595.57.542.90.479.2]higher level associations. With this in mind, the results do support several relationships between metabolite profiles and tumor genetics. Most notably, compared to tumors with wild-type p53, cancers with TP53 alterations show a very specific pattern of decreased lipid glycerophosphocho-lines that is not apparent when classifying the cancers by ER status, (Figure S5 in Additional file 4). Other significant associations were observed between PIK3CA mutation and malonylcarnitine and ERBB2 amplification with docosapen-taenoate, fucose, and 1-oleoylglycerophosphoethanolamine (Figure S6 in Additional file 4).
Metabolites associated with proliferation in tumors
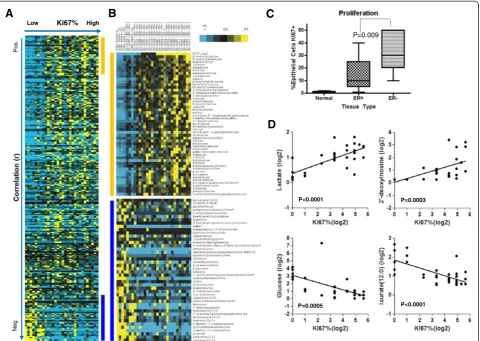
Proliferation rate could impact the level of many metab-olites. We measured proliferation byin situ detection of Ki-67 followed by quantitative evaluation of the percent-age of epithelial cells positive for this antigen. As previ-ously demonstrated in many studies, proliferation tends to be significantly higher in ER- compared to ER + tu-mors (mean of 32% versus 14%,P= 0.009 in our cohort) and epithelial cells in normal breast tissue have a very low rate of proliferation (Figure 6C). Supervised cluster-ing and correlation analysis of the metabolites with pro-liferation rate demonstrated sets of metabolites that were positively and inversely correlated with prolifera-tion (Figure 6A and B, and Table S8 in Addiprolifera-tional file 9). Predictably, the level of glucose was lower in rapidly pro-liferating cancers whereas lactate was positively correlated
with proliferation (Figure 6D). N-acetyl amino acids and 2′-deoxyinosine were highly enriched in rapidly proliferat-ing tumors. The biological roles of N-acetyl amino acids are largely unknown. However, aminoacylase-1 (encoded by ACY1), which is responsible for the degradation of these N-acetyl amino acids, has been found to be inac-tivated in several tumor types [36,37]. High levels of 2′-deoxyinosine (dI) may be an indication of misincor-poration of dI into the DNA of ER- tumor cells, a lesion capable of generating A–> G transitions in DNA [38].
ER status was highly correlated with proliferation and therefore many of the same metabolites were associated with both of these parameters. We further analyzed the data to determine whether these two parameters had any degree of independence, and if so, for which sets of metabolites. Linear regression analyses show that, while correlated with one another, ER and proliferation status act as complementary explanatory factors for many of the metabolites (Figure S7 in Additional file 4). A rela-tively small number of metabolites were highly corre-lated with one parameter but not the other, most notably 2-HG with ER status but not proliferation (Table S9 in Additional file 10).
Discussion
Links between cancer genetics and altered metabolism have been established primarily in model and experi-mental systems but have rarely been tested in primary
P=0.001
P=0.007
P=0.03
[image:10.595.56.539.89.325.2]P=0.004
P=0.02
P=0.03
human cancers. The current study makes use of the comprehensive genetic data from TCGA on breast can-cer [1] to test reported relationships and discover new and unexpected associations between genetics and me-tabolism. TCGA data provides an excellent platform in this regard for three reasons: (1) the tissues were sub-jected to stringent quality control criteria including tumor nuclei exceeding 70% and the absence of signifi-cant necrosis, (2) multiple analytes were measured in parallel on the same cancers including DNA sequence for mutations, DNA copy number assessment, RNA ex-pression including RNAseq and microarray analysis, methy-lation, and protein and phosphoprotein levels, and (3) the data are in the public domain in easily accessible formats with standardized specimen identifiers that can be directly linked and co-analyzed with other types of newly generated data such as the metabolite levels that we measured in the current study. We include the primary data on these sam-ples so that anyone can perform their own joint analysis on metabolites and genes of interest.
The frozen tissues were analyzed on a metabolomics platform that has been used in other cancer-related studies [39-41] and at the time of the analysis, included identification and quantitation of 399 named biochemi-cals (Mr<1,000 Da). Unsupervised clustering by metabol-ite levels revealed two major categories, one containing the normal breast tissues and a subset of the ER + cancers, and the other containing all of the ER- cancers and the remaining ER + ones. Overlaying the TCGA data on these clusters revealed that all of the cancers clustering with normal breast were of the luminal A intrinsic subtype. The remaining luminal A and all of the luminal B cancers fell in the other major cluster along with all of the basal cancers and the two cancers designated as HER2 by PAM50. That the luminal A cancers do not all cluster to-gether is consistent with a metabolomic study employing high resolution magic angle spinning magnetic resonance spectroscopy of predominantly luminal cancers [17]. In this study, three distinct categories of luminal A cancers were described by hierarchical clustering driven primarily
A
B
P=0.009
C
Ki67% High Low
P=0.0003
P=0.0005 P<0.0001
P<0.0001
[image:11.595.59.540.89.430.2]D
by varying levels of glycolytic activity. Widely different proliferation rates in the ER + cancers may at least par-tially underlie these luminal sub-clusters.
The basal subtype, a subset of the ER- cancers, demon-strated significant homogeneity with 4 of the 5 PAM50 basal cancers clustering on one sub-branch of the metabo-lomic hierarchical tree. A HER2 cancer was the only other member of this sub-branch but this cancer does share the common basal trait of having a TP53 mutation. Overlay-ing the most common genetic driver alterations in breast cancer on this cluster diagram allowed a visual assessment of whether branches may also be driven by specific onco-genic events. TP53 mutations and basal cancer status are nearly coincident and as described, the basal cancers are tightly clustered. Therefore, it is difficult to disentangle genetics from intrinsic subtype in this instance. Other not-able groupings that may be associated with a specific genetic driver include MYC amplification and PIK3CA mutation. PIK3CA mutations are tightly linked to the luminal subtypes whereas MYC amplification is com-mon in both basal and luminal cancers. It may be noteworthy that none of the MYC amplified tumors clustered with the normal breast tissue.
Supervised classification andttests based on the three categories of specimens (ER+, ER/PR-, normal) exhibited significant signals for many metabolites. Over half of the 399 identified metabolites were different between normal and cancer. Moreover, >18% of the metabolites varied significantly between ER + and ER- cancers. These dra-matic differences are consistent with previous reports showing strong remodeling of central metabolism be-tween normal breast tissue and breast cancer [16] and between tumor subtypes [9]. Notably, glycolytic- and glycogenolytic-associated metabolites including lactate were higher in ER- cancers with the prominent excep-tion of low tumor glucose. The increased lactate produc-tion from ER- cancer may be caused by increased glycolysis and confirm our previous finding of a strong hypoxia program and the high‘Warburg’phenotype previ-ously described in other studies of ER- cancer [7,9,16,27].
From TCGA data (for 23 of 25 of the cancers), we were able to confirm or identify known and unexpected associations between metabolite levels and various gen-etic events. Proof of principle for this approach was demonstrated by the correlation between kynurenine and the mRNA of its synthetic enzyme, IDO1. IDO1 ex-pression was also found to correlate with the basal phenotype common to ER- cancers and the high levels of kynurenine produced could result in reduced immu-nosurveillance of these cancers [42]. Increased serum kynurenine/tryptophan ratio has been noted during the progression of several tumor types [43,44]. Our findings support a connection between high IDO levels and kynurenine in ER- tumors. Other a priori associations
that were tested included PKM2 exon 9 versus 10 splice variant levels with proliferation and metabolite levels [45], IDH1 and 2 mRNA and mutations with 2-hydroxyglutarate levels [29], and levels of GGT1 mRNA and the gamma-glutamyl amino acids [46]. Of these, the strongest association was between GGT1 and a subset of the conjugated amino acids including leucine and isoleu-cine (Figure S8 in Additional file 10). GGT1 expression has been associated with a subset of basal cancers and our data indicating elevated levels of gamma-glutamyl amino acids in ER- cancers provides functional support for this genetic link.
A number of driver mutational events have been im-plicated in breast cancer development including amplifi-cation of ERBB2, CCND1 and MYC, loss of PTEN and CDH1, and missense mutations in TP53 and PIK3CA. Some of these events have been associated with changes in central metabolism in tumors and experimental sys-tems [4,5,47-49]. Using these genetic alterations as cat-egorical variables, we analyzed our data for signs of metabolic signatures associated with the most common genetic lesions. The co-existence of TP53 mutation and reduced levels of a series of lipid glycerophosphocholines was the most significant association detected. Altered choline metabolism in the form of decreased glycero-phosphocholine (GPC) was reported for several tumor types, consistent with an association with p53 status [50,51]. A specific connection between p53 and phospho-lipid metabolism was demonstrated previously with indi-cation of feedback regulation between phospholipid turnover and p53 activity [52-55]. In our data, 8 differ-ent long-chain fatty acid glycerophosphocholines were strongly reduced in p53 mutant tumors suggesting an underlying regulatory relationship for this consistent association. An important caveat for this finding is the fact that p53 mutation status is associated with the basal intrinsic subtype in breast cancer. In our data set, all five of the basal cancers harbored p53 muta-tions and only one of the nonbasal cancers (HER2) had a mutation. Therefore, the strong association we observed between TP53 status and the levels of these phospholipids may be confounded by intrinsic subtype something that cannot be distinguished in the current study. Another in-teresting metabolite-genetic association is the higher level of fucose in ERBB2+ tumors. Fucose is a simple sugar that is used to modify proteins and shown to be necessary for key functions of neoplastic progression of breast cancer cells [56]. The higher level of fucose may suggest that such glycoprotein modifications play a particular important role in ERBB2+ tumors.
outside of the context of the hereditary syndrome. High levels of BRCA1 mRNA were positively correlated with a group of metabolites indicative of elevated fatty acid
β-oxidation and increased anti-stress response and in-versely correlated with medium- and long-chain fatty acids and membrane components. BRCA1 protein via its BRCT domain was shown to bind to ACC1/ACACA preventing its dephosphorylation, keeping it in a phos-phorylated and inactive form, thus inhibiting fatty acid synthesis and promoting fatty acid β-oxidation [31]. We found a number of metabolites that fit this mechan-ism. BRCA1 has also been implicated in redox homeosta-sis [33], potentially through an interaction with NRF2 that prevents its degradation and promotes its nuclear accu-mulation [35] and we found multiple metabolites that also fit this activity. These BRCA1 expression-metabolite asso-ciations are entirely consistent with in vitro mechanistic studies implicating BRCA1 in these processes and as such, constitute direct support for the physiologic relevance of these pathway connections in breast cancer.
Rate of proliferation is a key phenotypic property of breast cancers that can be used as an independent prog-nostic factor [57]. Gene expression indicative of prolifer-ation constitutes a major component of the OncotypeDx multi-gene recurrence score [58]. We measured prolifer-ation in our specimens by scoring Ki-67 staining as a continuous variable and correlated this metric with me-tabolite levels. As anticipated, a number of strong corre-lations with proliferative rate were found including high levels of lactate and low levels of glucose consistent with glucose-consumption patterns in rapidly growing cells. Overall, many of the same metabolites correlated with both receptor status and proliferation. While prolifera-tion did correlate with ER status in our study (and others), there were ER + cancers with high proliferation rates and ER- cancers with relatively low proliferation rates in our sample set. We compared the relative con-tribution of these two factors (proliferation and receptor status) to metabolite levels through statistical analysis and found that a number of analytes were strongly asso-ciated with one parameter but not the other suggesting that there is some degree of independence. However, these results further highlight the potential confounding classification issue in breast cancer as receptor status, intrinsic subtype, and genetic and phenotypic properties are all correlated. The admixture of cancers we analyzed in the current study reinforces these relationships indi-cating that this data set is highly representative of the landscape of the disease. The inclusion of metabolite profiles as an additional dimension in the TCGA data-base provides a new level of resolution to this important public resource. Indexing our metabolite data to the rigorously curated, comprehensive, and standardized TCGA platform offers the opportunity for additional
hypothesis testing and discovery based upon metabolic signatures and could produce novel insights for detec-tion, prognostic, predictive, or therapeutic benefit.
Conclusions
We have identified categorical differences in the metabolic profile of ER- vs. ER + breast tumors that may directly im-pact tumor behavior and clinical phenotypes. We found notable differences in energy needs, redox potential, pro-tein uptake and catabolism which in the ER- samples correlated with increases in glutathione biosynthesis, NAD + production, and proliferative signaling. The data are consistent with high Warburg metabolism in the ER-tumors, as several biochemical intermediates of the glyco-lytic pathway including lactate were found to be increased in these cancers. Joint analysis with genetic alterations fur-ther identified several gene-metabolite correlations valid-ating the physiologic relevance of reported in vitro associations and providing indications of novel regula-tory relationships between tumor genetics and metab-olism. The addition of metabolomic data to the public domain TCGA dataset provides an important new tool for the discovery and hypothesis testing of the genetic regulatory of tumor metabolism.
Additional files
Additional file 1: Table S1.Demographic and clinical data for the breast cancer subjects from which the tissues for this study were derived.
Additional file 2: Table S2.Metabolite levels (normalized and imputed) of the breast samples with genetic driver alterations indicated.
Additional file 3: Table S3.ttests comparing metabolite levels between the three groups of specimens; normal breast, estrogen receptor (ER) + cancers, and ER- cancers.
Figure S8.Correlation between GGT1 mRNA levels and selected gamma-glutamyl amino acids.
Additional file 5: Table S4.Comparison with the Terunumaet al.’s (JCI 2014) dataset for discrimination of estrogen receptor (ER) + and ER- cancers.
Additional file 6: Table S5.Pearson’s correlations between all metabolites in the study.
Additional file 7: Table S6.Pearson’s correlations between BRCA1 mRNA levels and metabolites for 23 cancers comparing normalized metabolite levels and then log2 transformed normalized metabolite levels with RNAseq expression data from The Cancer Genome Atlas (TCGA). The metabolites that are significantly associated with BRCA1 mRNA levels are labeled in red (positive correlation) or green (negative correlation).
Additional file 8: Table S7.Significance of microarray (SAM) analysis of metabolites using each genetic driver alteration as a separate binary condition.
Additional file 9: Table S8.Pearson’s correlations between KI-67 (proliferation rate) and metabolite levels.
Additional file 10: Table S9.Linear regression analyses of proliferation (KI-67), estrogen receptor (ER) status, and metabolite levels.
Abbreviations
2-HG:2-hydroxyglutarate; ACC1: acetyl-coenzyme A carboxylase 1, encoded by ACACA (acetyl-CoA carboxylase alpha); ER: estrogen receptor; GC/MS: gas chromatography/mass spectrometry; GSH: glutathione, reduced;
GSSG: glutathione, oxidized; HER2: amplified ERBB2 oncogene; IDO: indoleamine 2,3-dioxygenase; LC/MS: liquid chromatography/mass spectrometry; NMR: nuclear magnetic resonance; NFE2L2: NFE2-related factor 2; PAM50: 50 gene expression signature separating breast cancers into 5 intrinsic subtypes; PR: progesterone receptor; TCGA: The Cancer Genome Atlas.
Competing interests
The authors declare that they have no competing interests.
Authors’contributions
XT, CCL, JTC and JRM designed and performed sample preparation, analysis, and molecular biological experiments. IS performed the mass spectrometry to quantitate 2-HG in breast cancers and cell lines. ESI performed statistical analysis. XT, JTC and JRM designed the overall experimental focus, analyzed data, and wrote the manuscript. All authors read and approved the manuscript.
Acknowledgements
We wish to acknowledge the generous financial support from the NIH (CA084955 to JRM, CA125618, and CA106520 to JTC) and Department of Defense (W81XWH-12-1-0148 to JTC). We are also grateful to James Koh for critical discussions and editing of the manuscript.
Author details
1Department of Molecular Genetics and Microbiology, Duke University,
268 CARL Building, Research Drive, Durham, NC 27708, USA.2Duke Center for Genomic and Computational Biology, Duke University, 101 Science Drive, Durham, NC 27708, USA.3Department of Medicine, Duke University, 201 Trent Drive, Durham, NC 27710, USA.4Department of Statistical
Science, Duke University, 214A Old Chemistry Building, Durham, NC 27710, USA.5Department of Surgery, Division of Surgical Sciences, Duke
University, 103 Research Drive, Durham, NC 27710, USA.
Received: 20 November 2013 Accepted: 21 July 2014 Published: 5 August 2014
References
1. Cancer Genome Atlas Network:Comprehensive molecular portraits of human breast tumours.Nature2012,490:61–70.
2. Levine AJ, Puzio-Kuter AM:The control of the metabolic switch in cancers by oncogenes and tumor suppressor genes.Science2010,330:1340–1344. 3. Reitman ZJ, Jin G, Karoly ED, Spasojevic I, Yang J, Kinzler KW, He Y, Bigner
DD, Vogelstein B, Yan H:Profiling the effects of isocitrate dehydrogenase 1 and 2 mutations on the cellular metabolome.Proc Natl Acad Sci U S A 2011,108:3270–3275.
4. Yuneva MO, Fan TW, Allen TD, Higashi RM, Ferraris DV, Tsukamoto T, Mates JM, Alonso FJ, Wang C, Seo Y, Chen X, Bishop JM:The metabolic profile of tumors depends on both the responsible genetic lesion and tissue type.
Cell Metab2012,15:157–170.
5. Maddocks OD, Berkers CR, Mason SM, Zheng L, Blyth K, Gottlieb E, Vousden KH:Serine starvation induces stress and p53-dependent metabolic remodelling in cancer cells.Nature2013,493:542–546. 6. Garcia-Cao I, Song MS, Hobbs RM, Laurent G, Giorgi C, de Boer VC,
Anastasiou D, Ito K, Sasaki AT, Rameh L, Carracedo A, Vander Heiden MG, Cantley LC, Pinton P, Haigis MC, Pandolfi PP:Systemic elevation of PTEN induces a tumor-suppressive metabolic state.Cell2012,149:49–62. 7. Gatza ML, Kung HN, Blackwell KL, Dewhirst MW, Marks JR, Chi JT:Analysis
of tumor environmental response and oncogenic pathway activation identifies distinct basal and luminal features in HER2-related breast tumor subtypes.Breast Cancer Res2011,13:R62.
8. Palaskas N, Larson SM, Schultz N, Komisopoulou E, Wong J, Rohle D, Campos C, Yannuzzi N, Osborne JR, Linkov I, Kastenhuber ER, Taschereau R, Plaisier SB, Tran C, Heguy A, Wu H, Sander C, Phelps ME, Brennan C, Port E, Huse JT, Graeber TG, Mellinghoff IK:18 F-fluorodeoxy-glucose positron emission tomography marks MYC-overexpressing human basal-like breast cancers.Cancer Res2011,71:5164–5174.
9. Brauer HA, Makowski L, Hoadley KA, Casbas-Hernandez P, Lang LJ, Roman-Perez E, D’Arcy M, Freemerman AJ, Perou CM, Troester MA:Impact of tumor microenvironment and epithelial phenotypes on metabolism in breast cancer.Clin Cancer Res2013,19:571–585.
10. Jerby L, Wolf L, Denkert C, Stein GY, Hilvo M, Oresic M, Geiger T, Ruppin E: Metabolic associations of reduced proliferation and oxidative stress in advanced breast cancer.Cancer Res2012,72:5712–5720.
11. Kung HN, Marks JR, Chi JT:Glutamine synthetase is a genetic determinant of cell type-specific glutamine independence in breast epithelia.PLoS Genet2011,7:e1002229.
12. Perou CM, Sorlie T, Eisen MB, van de Rijn M, Jeffrey SS, Rees CA, Pollack JR, Ross DT, Johnsen H, Aksien LA, Fluge O, Pergamenschikov A, Williams C, Zhu SX, Lonning PE, Borresen-Dale AL, Brown PO, Botstein D:Molecular portraits of human breast tumours.Nature2000,406:747–752. 13. Lim E, Vaillant F, Wu D, Forrest NC, Pal B, Hart AH, Asselin-Labat ML, Gyorki DE,
Ward T, Partanen A, Feleppa F, Huschtscha LI, Thorne HJ, kConFab, Fox SB, Yan M, French JD, Brown MA, Smyth GK, Visvader JE, Lindeman GJ:Aberrant luminal progenitors as the candidate target population for basal tumor development in BRCA1 mutation carriers.Nat Med2009,15:907–913. 14. Shipitsin M, Campbell LL, Argani P, Weremowicz S, Bloushtain-Qimron N,
Yao J, Nikolskaya T, Serebryiskaya T, Beroukhim R, Hu M, Halushka MK, Sukumar S, Parker LM, Anderson KS, Harris LN, Garber JE, Richardson AL, Schnitt SJ, Nikolsky Y, Gelman RS, Polyak K:Molecular definition of breast tumor heterogeneity.Cancer Cell2007,11:259–273. 15. Sitter B, Lundgren S, Bathen TF, Halgunset J, Fjosne HE, Gribbestad IS:
Comparison of HR MAS MR spectroscopic profiles of breast cancer tissue with clinical parameters.NMR Biomed2006,19:30–40.
16. Budczies J, Denkert C, Muller BM, Brockmoller SF, Klauschen F, Gyorffy B, Dietel M, Richter-Ehrenstein C, Marten U, Salek RM, Griffin JL, Hilvo M, Oresic M, Wohlgemuth G, Fiehn O:Remodeling of central metabolism in invasive breast cancer compared to normal breast tissue - a GC-TOFMS based metabolomics study.BMC Genomics2012,13:334.
17. Borgan E, Sitter B, Lingjaerde OC, Johnsen H, Lundgren S, Bathen TF, Sorlie T, Borresen-Dale AL, Gribbestad IS:Merging transcriptomics and metabolomics– advances in breast cancer profiling.BMC Cancer2010,10:628.
18. Hilvo M, Denkert C, Lehtinen L, Muller B, Brockmoller S, Seppanen-Laakso T, Budczies J, Bucher E, Yetukuri L, Castillo S, Berg E, Nygren H, Sysi-Aho M, Griffin JL, Fiehn O, Loibl S, Richter-Ehrenstein C, Radke C, Hyotylainen T, Kallioniemi O, Iljin K, Oresic M:Novel theranostic opportunities offered by characterization of altered membrane lipid metabolism in breast cancer progression.Cancer Res2011,71:3236–3245.
19. Struys EA, Jansen EE, Verhoeven NM, Jakobs C:Measurement of urinary D- and L-2-hydroxyglutarate enantiomers by stable-isotope-dilution liquid chromatography-tandem mass spectrometry after derivatization with diacetyl-L-tartaric anhydride.Clin Chem2004,50:1391–1395. 20. Storey JD, Tibshirani R:Statistical significance for genomewide studies.
Proc Natl Acad Sci U S A2003,100:9440–9445.
22. Tusher VG, Tibshirani R, Chu G:Significance analysis of microarrays applied to the ionizing radiation response.Proc Natl Acad Sci U S A2001, 98:5116–5121.
23. The Cancer Genome Atlas - data portal.[https://tcga-data.nci.nih.gov/tcga/] 24. cBioPortal for Cancer Genomics.[http://www.cbioportal.org/public-portal/] 25. Chia SK, Bramwell VH, Tu D, Shepherd LE, Jiang S, Vickery T, Mardis E, Leung S, Ung K, Pritchard KI, Parker JS, Bernard PS, Perou CM, Ellis MJ, Nielsen TO:A 50-gene intrinsic subtype classifier for prognosis and prediction of benefit from adjuvant tamoxifen.Clin Cancer Res2012,18:4465–4472. 26. Sorlie T, Perou CM, Tibshirani R, Aas T, Geisler S, Johnsen H, Hastie T, Eisen MB,
van de Rijn M, Jeffrey SS, Thorsen T, Quist H, Matese JC, Brown PO, Botstein D, Eystein Lonning P, Borresen-Dale AL:Gene expression patterns of breast carcinomas distinguish tumor subclasses with clinical implications.
Proc Natl Acad Sci U S A2001,98:10869–10874.
27. Terunuma A, Putluri N, Mishra P, Mathe EA, Dorsey TH, Yi M, Wallace TA, Issaq HJ, Zhou M, Killian JK, Stevenson HS, Karoly ED, Chan K, Samanta S, Prieto D, Hsu TY, Kurley SJ, Putluri V, Sonavane R, Edelman DC, Wulff J, Starks AM, Yang Y, Kittles RA, Yfantis HG, Lee DH, Ioffe OB, Schiff R, Stephens RM, Meltzer PS,et al:MYC-driven accumulation of 2-hydroxyglutarate is associated with breast cancer prognosis.J Clin Invest2014,124:398–412. 28. Griffith OW, Bridges RJ, Meister A:Transport of gamma-glutamyl amino
acids: role of glutathione and gamma-glutamyl transpeptidase.Proc Natl Acad Sci U S A1979,76:6319–6322.
29. Dang L, White DW, Gross S, Bennett BD, Bittinger MA, Driggers EM, Fantin VR, Jang HG, Jin S, Keenan MC, Marks KM, Prins RM, Ward PS, Yen KE, Liau LM, Rabinowitz JD, Cantley LC, Thompson CB, Vander Heiden MG, Su SM: Cancer-associated IDH1 mutations produce 2-hydroxyglutarate.
Nature2009,462:739–744.
30. Rohle D, Popovici-Muller J, Palaskas N, Turcan S, Grommes C, Campos C, Tsoi J, Clark O, Oldrini B, Komisopoulou E, Kunii K, Pedraza A, Schalm S, Silverman L, Miller A, Wang F, Yang H, Chen Y, Kernytsky A, Rosenblum MK, Liu W, Biller SA, Su SM, Brennan CW, Chan TA, Graeber TG, Yen KE, Mellinghoff IK:An inhibitor of mutant IDH1 delays growth and promotes differentiation of glioma cells.
Science2013,340:626–630.
31. Moreau K, Dizin E, Ray H, Luquain C, Lefai E, Foufelle F, Billaud M, Lenoir GM, Venezia ND:BRCA1 affects lipid synthesis through its interaction with acetyl-CoA carboxylase.J Biol Chem2006,281:3172–3181.
32. Singh KK, Shukla PC, Yanagawa B, Quan A, Lovren F, Pan Y, Wagg CS, Teoh H, Lopaschuk GD, Verma S:Regulating cardiac energy metabolism and bioenergetics by targeting the DNA damage repair protein BRCA1.
J Thorac Cardiovasc Surg2013,146:702–709.
33. Bae I, Fan S, Meng Q, Rih JK, Kim HJ, Kang HJ, Xu J, Goldberg ID, Jaiswal AK, Rosen EM:BRCA1 induces antioxidant gene expression and resistance to oxidative stress.Cancer Res2004,64:7893–7909.
34. Fan S, Meng Q, Saha T, Sarkar FH, Rosen EM:Low concentrations of diindolylmethane, a metabolite of indole-3-carbinol, protect against oxidative stress in a BRCA1-dependent manner.Cancer Res2009, 69:6083–6091.
35. Gorrini C, Baniasadi PS, Harris IS, Silvester J, Inoue S, Snow B, Joshi PA, Wakeham A, Molyneux SD, Martin B, Bouwman P, Cescon DW, Elia AJ, Winterton-Perks Z, Cruickshank J, Brenner D, Tseng A, Musgrave M, Berman HK, Khokha R, Jonkers J, Mak TW, Gauthier ML:BRCA1 interacts with Nrf2 to regulate antioxidant signaling and cell survival.J Exp Med2013, 210:1529–1544.
36. Cook RM, Franklin WA, Moore MD, Johnson BE, Miller YE:Mutational inactivation of aminoacylase-I in a small cell lung cancer cell line.Genes Chromosomes Cancer1998,21:320–325.
37. Zhong Y, Onuki J, Yamasaki T, Ogawa O, Akatsuka S, Toyokuni S:Genome-wide analysis identifies a tumor suppressor role for aminoacylase 1 in iron-induced rat renal cell carcinoma.Carcinogenesis2009,30:158–164.
38. Yasui M, Suenaga E, Koyama N, Masutani C, Hanaoka F, Gruz P, Shibutani S, Nohmi T, Hayashi M, Honma M:Miscoding properties of 2′-deoxyinosine, a nitric oxide-derived DNA Adduct, during translesion synthesis catalyzed by human DNA polymerases.J Mol Biol2008,377:1015–1023.
39. Sreekumar A, Poisson LM, Rajendiran TM, Khan AP, Cao Q, Yu J, Laxman B, Mehra R, Lonigro RJ, Li Y, Nyati MK, Ahsan A, Kalyana-Sundaram S, Han B, Cao X, Byun J, Omenn GS, Ghosh D, Pennathur S, Alexander DC, Berger A, Shuster JR, Wei JT, Varambally S, Beecher C, Chinnaiyan AM:Metabolomic profiles delineate potential role for sarcosine in prostate cancer progression.
Nature2009,457:910–914.
40. Chinnaiyan P, Kensicki E, Bloom G, Prabhu A, Sarcar B, Kahali S, Eschrich S, Qu X, Forsyth P, Gillies R:The metabolomic signature of malignant glioma reflects accelerated anabolic metabolism.Cancer Res2012,72:5878–5888. 41. Hitosugi T, Zhou L, Elf S, Fan J, Kang HB, Seo JH, Shan C, Dai Q, Zhang L, Xie J, Gu TL, Jin P, Aleckovic M, LeRoy G, Kang Y, Sudderth JA, DeBerardinis RJ, Luan CH, Chen GZ, Muller S, Shin DM, Owonikoko TK, Lonial S, Arellano ML, Khoury HJ, Khuri FR, Lee BH, Ye K, Boggon TJ, Kang S,et al:Phosphoglycerate mutase 1 coordinates glycolysis and biosynthesis to promote tumor growth.Cancer Cell2012,22:585–600.
42. Platten M, Wick W, Van den Eynde BJ:Tryptophan catabolism in cancer: beyond IDO and tryptophan depletion.Cancer Res2012,72:5435–5440. 43. Suzuki Y, Suda T, Furuhashi K, Suzuki M, Fujie M, Hahimoto D, Nakamura Y,
Inui N, Nakamura H, Chida K:Increased serum kynurenine/tryptophan ratio correlates with disease progression in lung cancer.Lung Cancer 2010,67:361–365.
44. Lyon DE, Walter JM, Starkweather AR, Schubert CM, McCain NL:Tryptophan degradation in women with breast cancer: a pilot study.BMC Res Notes 2011,4:156.
45. Wang Z, Chatterjee D, Jeon HY, Akerman M, Vander Heiden MG, Cantley LC, Krainer AR:Exon-centric regulation of pyruvate kinase M alternative splicing via mutually exclusive exons.J Mol Cell Biol2012,4:79–87. 46. Kim S, Kim Do H, Jung WH, Koo JS:Metabolic phenotypes in triple-negative
breast cancer.Tumour Biol2013,34:1699–1712.
47. Dang CV:MYC, metabolism, cell growth, and tumorigenesis.Cold Spring Harb Perspect Med2013,3:1–15.
48. Freed-Pastor WA, Mizuno H, Zhao X, Langerod A, Moon SH, Rodriguez-Barrueco R, Barsotti A, Chicas A, Li W, Polotskaia A, Bissell MJ, Osborne TF, Tian B, Lowe SW, Silva JM, Borresen-Dale AL, Levine AJ, Bargonetti J, Prives C:Mutant p53 disrupts mammary tissue architecture via the mevalonate pathway.Cell2012,148:244–258.
49. Foster R, Griffin S, Grooby S, Feltell R, Christopherson C, Chang M, Sninsky J, Kwok S, Torrance C:Multiple metabolic alterations exist in mutant PI3K cancers, but only glucose is essential as a nutrient source.PLoS One2012, 7:e45061.
50. Aboagye EO, Bhujwalla ZM:Malignant transformation alters membrane choline phospholipid metabolism of human mammary epithelial cells.
Cancer Res1999,59:80–84.
51. Iorio E, Mezzanzanica D, Alberti P, Spadaro F, Ramoni C, D’Ascenzo S, Millimaggi D, Pavan A, Dolo V, Canevari S, Podo F:Alterations of choline phospholipid metabolism in ovarian tumor progression.Cancer Res2005, 65:9369–9376.
52. Zhang XH, Zhao C, Seleznev K, Song K, Manfredi JJ, Ma ZA:Disruption of G1-phase phospholipid turnover by inhibition of Ca2 +−independent phospholipase A2 induces a p53-dependent cell-cycle arrest in G1 phase.J Cell Sci2006,119:1005–1015.
53. Goldstein I, Rotter V:Regulation of lipid metabolism by p53 - fighting two villains with one sword.Trends Endocrinol Metab2012,23:567–575. 54. Li CH, Cheng YW, Liao PL, Kang JJ:Translocation of p53 to mitochondria
is regulated by its lipid binding property to anionic phospholipids and it participates in cell death control.Neoplasia2010,12:150–160.
55. He H, Conrad CA, Nilsson CL, Ji Y, Schaub TM, Marshall AG, Emmett MR: Method for lipidomic analysis: p53 expression modulation of sulfatide, ganglioside, and phospholipid composition of U87 MG glioblastoma cells.Anal Chem2007,79:8423–8430.
56. Listinsky JJ, Siegal GP, Listinsky CM:The emerging importance of alpha-L-fucose in human breast cancer: a review.Am J Transl Res2011,3:292–322. 57. Luporsi E, Andre F, Spyratos F, Martin PM, Jacquemier J, Penault-Llorca F,
Tubiana-Mathieu N, Sigal-Zafrani B, Arnould L, Gompel A, Egele C, Poulet B, Clough KB, Crouet H, Fourquet A, Lefranc JP, Mathelin C, Rouyer N, Serin D, Spielmann M, Haugh M, Chenard MP, Brain E, de Cremoux P, Bellocq JP: Ki-67: level of evidence and methodological considerations for its role in the clinical management of breast cancer: analytical and critical review.Breast Cancer Res Treat2012,132:895–915.
58. Paik S, Shak S, Tang G, Kim C, Baker J, Cronin M, Baehner FL, Walker MG, Watson D, Park T, Hiller W, Fisher ER, Wickerham DL, Bryant J, Wolmark N:A multigene assay to predict recurrence of tamoxifen-treated, node-negative breast cancer.N Engl J Med2004,351:2817–2826.
doi:10.1186/s13058-014-0415-9