R E S E A R C H A R T I C L E
Open Access
Whole genome phylogenies for multiple
Drosophila
species
Arun Seetharam and Gary W Stuart
*Abstract
Background:Reconstructing the evolutionary history of organisms using traditional phylogenetic methods may suffer from inaccurate sequence alignment. An alternative approach, particularly effective when whole genome sequences are available, is to employ methods that don’t use explicit sequence alignments. We extend a novel phylogenetic method based on Singular Value Decomposition (SVD) to reconstruct the phylogeny of 12 sequenced Drosophilaspecies. SVD analysis provides accurate comparisons for a high fraction of sequences within whole genomes without the prior identification of orthologs or homologous sites. With this method all protein sequences are converted to peptide frequency vectors within a matrix that is decomposed to provide simplified vector representations for each protein of the genome in a reduced dimensional space. These vectors are summed together to provide a vector representation for each species, and the angle between these vectors provides distance measures that are used to construct species trees.
Results:An unfiltered whole genome analysis (193,622 predicted proteins) strongly supports the currently accepted phylogeny for 12Drosophilaspecies at higher dimensions except for the generally accepted but difficult to discern sister relationship betweenD. erectaandD. yakuba. Also, in accordance with previous studies, many sequences appear to support alternative phylogenies. In this case, we observed grouping ofD. erectawithD. sechelliawhen approximately 55% to 95% of the proteins were removed using a filter based on projection values or by reducing resolution by using fewer dimensions. Similar results were obtained when just themelanogastersubgroup was analyzed.
Conclusions:These results indicate that using our novel phylogenetic method, it is possible to consult and interpret all predicted protein sequences within multiple whole genomes to produce accurate phylogenetic estimations of relatedness betweenDrosophilaspecies. Furthermore, protein filtering can be effectively applied to reduce incongruence in the dataset as well as to generate alternative phylogenies.
Keywords:Singular value decomposition, Phylogenomics, Comparative genomics,Drosophilaphylogeny
Background
Methods that determine phylogenies based on a restricted number of genes can be negatively affected by horizontal gene transfers, incomplete lineage-sorting, introgression, and the unrecognized comparison of par-alogous genes. The recent explosive increase in the number of completely sequenced genomes allows us to consider inferring gene and/or organismal relationships using complete sequence data. Several methods for gen-erating phylogenies based on whole genome information have been explored, and many of these have been
applied to re-examine the phylogeny of Drosophila. These include methods based primarily or exclusively on gene content [1], gene order [2], and detailed compari-sons of operationally defined orthologs [3]. However, these methods often fail to provide detailed and un-biased comparisons of a high fraction of sequences and instead produce phylogenies based on greatly filtered, preselected datasets. We developed a phylogenetic method that provides accurate comparisons for a high fraction of sequences within whole genomes without the prior identification of orthologous or homologous sites [4]. Our approach allows a relatively comprehensive comparison of complete genome protein sequence, thereby taking into account a higher fraction of total * Correspondence:gstuart@indstate.edu
Department of Biology, Indiana State University, Terre Haute, Indiana, 47809, USA
sequence information and providing comprehensive definitions for the various species of interest. This method has been successfully applied to a number of di-verse species including vertebrate mitochondrial gen-omes, plant viral gengen-omes, and eukaryotic nuclear genomes [4-7].
Complete genome sequences for 10 additional species ofDrosophilawere added to the sequences already avail-able forD. melanogaster and D. pseudoobscurain order to improve the precision and sensitivity of evolutionary inference regarding these organisms [8]. As a result, the currently accepted species phylogeny for these organ-isms has been further refined and resolved. However, these methods generally continue to utilize greatly fil-tered data sets primarily comprised of selected single copy orthologous sequences [9-14].
Many such studies have resulted in what is largely considered to be a fully resolved phylogeny for the 12 sequenced species ofDrosophila.However, some doubts remain with respect to the placement of certain mem-bers of the melanogaster group: D. erecta, D. yakuba andD. melanogaster, placement of the Hawaiian species: D. grimshawi, and to some extent virilis-repleta group: D. virilis and D. mojavenis [15-19]. Among these, the placement ofD. erectaandD. yakubawith respect toD. melanogaster is perhaps least certain. Though evidence has been presented to support all the possible phyloge-nies with respect to D. melanogaster, D. erecta, and D. yakuba,support for each of these phylogenies is not uni-formly strong [12]. In this study we apply our more in-clusive whole genome phylogenetic method on the 12 genomes of Drosophila to further investigate and valid-ate our current understanding of their phylogenetic relationships.
Results and discussion
Preliminary studies were conducted using a small data-set comprising only 6 genomes of the melanogaster group (D. melanogaster, D. sechellia, D. simulans, D. erecta, D. yakuba and D. ananassae) with a total of 100,851 predicted proteins. Further studies were con-ducted using a large dataset consisting of all the 12 Drosophilaspp. genomes with a total of 193,622 proteins (Table 1). Additional 11 genome datasets excluding one of themelanogastergroup species were also constructed for the detailed analysis of the phylogenies. Although there were large similarities in the total number of genes among the Drosophila species, there were large varia-tions in the total number of predicted proteins (Table 1). It seems likely that the melanogaster genome is more fully annotated with a larger number of alternatively spliced transcripts producing multiple (but perhaps slightly different) protein products relative to other
Drosophila genomes. Among the 12 species, D. melano-gaster had the highest number of predicted proteins (22,765) andD. virilishad the lowest (14,491). Each spe-cies’ contribution to the dataset was in the range of 7.48% to 8.51% except for D. melanogaster which con-tributed about 11.76% for the total. In previous studies, we noted that a modest size difference in genomes has little effect on the final outcome of the tree [4,6].
Higher dimension SVD analysis
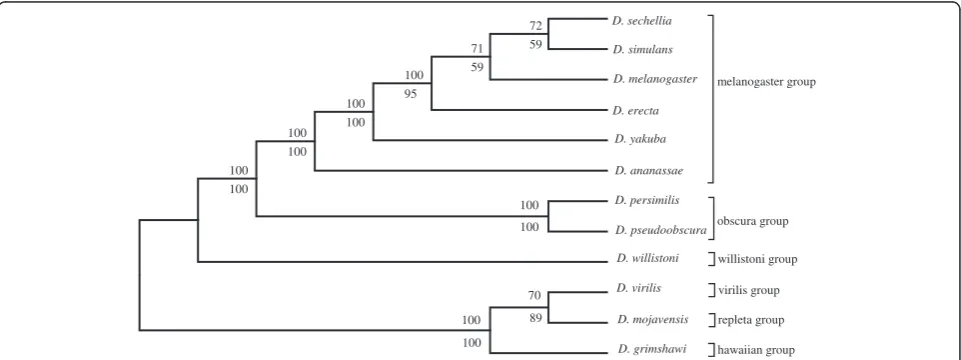
[image:2.595.305.540.112.283.2]Figure 1 and 2 shows the SVD-based topology obtained via Neighbor-joining for the 6 and 12 genome Drosoph-ila species data sets respectively. Two types of resam-pling methods were used to estimate branch statistics for this tree. The bottom value on each branch was gen-erated using a traditional bootstrap procedure [4] by sampling 800 singular triplets to construct 700 species trees. The top value on each branch was generated using a successive, delete-one jackknife procedure [4] wherein the least dominant singular vector was removed succes-sively (from 800 to 100 vectors) to generate 700 ordered sets of singular vectors, and a new tree was estimated following each removal. Most of the branches were well supported following application of either the modified jackknife procedure or the bootstrap procedure. Boot-strap yielded a slightly lower branch support for the D. sechellia, D. simulans, and D. melanogaster branch but all other branches were strongly supported by both pro-cedures. The observed difference was likely due to the uniform use of the 700 most dominant vectors in our modified jackknife procedure, while in contrast, the standard bootstrap samples randomly over all 800 vectors generated. The end result is a phylogeny that corresponds well to the currently accepted phylogeny [12,20-22], ex-cept forD. erectaand D. yakuba, which remain adjacent in the tree, but fail to cluster as sister species.
Table 1 List of 12Drosophilaspp used in the analysis, along with the number of predicted proteins
# Species Genes Proteins
1 Drosophila simulans 16117 15415
2 Drosophila sechellia 17286 16471
3 Drosophila melanaogaster 15431 22765
4 Drosophila erecta 15810 15048
5 Drosophila ananassae 15978 15070
6 Drosophila yakuba 16904 16082
7 Drosophila pseudoobscura 16712 16308
8 Drosophila persimilis 17573 16878
9 Drosophila willistoni 16385 15513
10 Drosophila mojavensis 15179 14595
11 Drosophila virilis 15343 14491
In order to further examine the robustness of the data supporting the correct tree, we performed a series of analyses by systematically excluding protein sequences that were poorly described by their corresponding singu-lar vectors in terms of projection values. The theoretical projection values for a given protein range from −1 to +1. In the first step, all protein sequences having pro-jection value less than or equal +0.001 and more than or equal to −0.001 were removed (about 9,500 sequences). The filter was increased stepwise with an increment of 0.001 and each corresponding dataset was used in turn to construct a tree. When about 54.54% (105,596 sequences) of the original dataset was removed (projec-tion value less than or equal to +0.003 and more than or equal to−0.003), a unique clustering ofD. erectawithD. schelliea was observed (Additional file 1). Continued successive increases in stringency to remove poorly described proteins failed to alter this novel cluster until more than 95% (185,039) of the total protein sequences were removed. This resulted in a re-clustering of D. erecta withD. yakubaas sister species, but this was ac-companied by the movement of D. melanogaster to a novel position (Additional file 2). Removing a high frac-tion of poorly described proteins (those with smaller
projections on any singular vector) would presumably tend to produce a more highly correlated data set con-sisting of smaller sets of highly conserved proteins. The tree generated using the modified jack knife procedure, rather than the bootstrap, showed a similar branching pattern. Branch support values for the tree exceeded 80% in all cases, and only 60% for theD. yakuba and D. erectacluster.
Lower dimension SVD analysis
A corresponding lower dimension analyses of the Dros-ophila spp. was also conducted using the same proced-ure but with fewer (500) singular triplets. Here the bootstrap branch statistics were generated by sampling 100 random sets of 150 singular triplets to construct 100 species trees. The delete-one jackknife values were gen-erated using 400 ordered sets of singular vectors. Trees were estimated following each successive removal of a least dominant vector from 500 to 100 vectors. The SVD phylogeny obtained for the unfiltered 12Drosophila spe-cies dataset (Figure 3) corresponds well to the currently accepted phylogeny, except forD. erecta, which shows a novel affinity withD. sechellia. It proved possible to dis-rupt this novel affinity after reducing the number of
D. erecta D. sechellia
D. simulans
D. melanogaster
D. yakuba
D. ananassae
melanogaster group 69
80
84
55
59
[image:3.595.59.539.91.174.2]85
Figure 1The higher dimension SVD tree for the 6Drosophilaspp., using all 700 vectors, without filtering any proteins (upper branch values, modified jackknife and lower branch values, bootstrap procedure for tree generation).
D. yakuba
D. persimilis
D. pseudoobscura
D. willistoni
D. grimshawi D. mojavensis D. virilis D. ananassae D. erecta D. sechellia
D. simulans
D. melanogaster melanogaster group
obscura group
willistoni group
repleta group virilis group
hawaiian group 100
70 100 100
72 71 100
100
100
100
89 100 100
59 59 95
100
100
[image:3.595.58.539.526.706.2]proteins used in the summation step by 97.57% (Figure 4) by applying a relatively severe filter (projection value less than or equal to +0.035 and more than or equal to−0.035) and thus using only the remaining highly correlated data set consisting of smaller sets of highly conserved proteins. Branch support values for the tree exceeded 70% in all cases, and more than 80% except for theD. melanogaster, D. yakuba and D. erectacluster.
In order to study the relationships among members of the melanogaster group without the influence of D. erecta, a slightly smaller dataset of 11Drosophilaspecies (178,574 total predicted proteins) was used for analysis. This data set produced the currently accepted phylogeny with strong branch support (Figure 5) [12,20-22]. The observed relationship was consistent across different levels of protein filtering. Both the bootstrap and the modified jackknife produced strong branch support values for most branches.
A similar result was obtained with an even smaller dataset that included only 6 genomes with 100,851 pre-dicted proteins (Figure 6 and 7). When subjected to SVD analysis, this produced the currently accepted phyl-ogeny for all 6 members of themelanogastergroup, but only under stringent protein filtering (Figure 7). The effect of including more proteins using a less severe pro-tein filter was similar for both the 12 genome tree and the 6 genome tree: D. erecta fails to cluster with D. yakuba and instead clusters with D. sechellia. However, just like in the 11 Drosophila dataset, exclusion of D. erecta from the melanogaster group produced the cur-rently accepted phylogeny with strong branch support (Figure 8) without filtering any proteins. The effect of other genomes on the phylogeny was systematically studied by excluding one of the melanogaster group species from the original 12 genome dataset. All these analyses showed the novel D. sechellia and D. erecta
100
59 100
100 100
100
100
100
100
D. melanogaster
D. persimilis
D. pseudoobscura
D. willistoni
D. grimshawi
D. mojavensis
D. virilis D. ananassae D. simulans D. erecta
D. sechellia
D. yakuba
melanogaster group
obscura group
willistoni group
repleta group
virilis group hawaiian group 100
100
58
99
98
100
64 100
[image:4.595.57.538.90.251.2]100
Figure 3The lower dimension SVD tree for the 12Drosophilaspp., using 300 vectors, without filtering any proteins (upper branch values, modified jackknife and lower branch values, bootstrap procedure for tree generation).
100
100 100 100
100
80 42
100
100
68 100
100 100
91
47
100 37
80 D. yakuba
D. erecta D. sechellia
D. melanogaster D. simulans
D. persimilis
D. pseudoobscura D. ananassae
melanogaster group
obscura group
D. willistoni
D. grimshawi D. mojavensis D. virilis
willistoni group
repleta group virilis group
hawaiian group
[image:4.595.58.538.534.695.2]clustering (Additional file 3, Additional file 4, Additional file 5 and Additional file 6) except for the dataset from which D. sechellia was excluded which produced the currently accepted phylogeny (Additional file 7). But, all datasets produced the currently accepted phylogeny under stringent filtering conditions (Additional files 8, 9, 10, 11, and 12).
Conclusions
Our results indicate that it is possible to consult and interpret all predicted protein sequences within multiple whole genomes to produce accurate phylogenetic esti-mations of relatedness between Drosophila species. Unlike our approach, the most recent independent standard analyses based on whole genome sequence in-formation depend upon filtered data sets in which a restricted number of highly conserved and putatively orthologous genes were compared. In addition, unlike standard methods which use sequence alignments, our method uses angles between high dimensional vectors to estimate evolutionary distance. Despite these novelties in method, the phylogenetic tree derived for the 6 species of the melanogaster group, as well as all 12 species of Drosophila, exhibits strong branch support values and corresponds almost exactly to the currently accepted phylogeny. We conclude that it is possible to include the entire dataset for a more inclusive and potentially more
robust analysis using a novel method to produce equiva-lent results.
This greatly expanded data set appears to contain a strong component of conflicting sequence information that specifically causesD. erectaandD. sechelliato clus-ter, but this was observed only when more than 55% (105,596) of the proteins are removed. However, this cluster disappears again when 95% (185,039) of poorly described proteins are removed. At lower dimensions, theD. erectaandD. sechelliacluster appears to be stable under various filter settings. Only under stringent filter-ing conditions could the correct phylogeny be restored. Additionally exclusion of either D. sechelliaorD. erecta from the 12 species dataset could produce the currently accepted phylogeny.
The relative placement of D. erecta and D. yakuba with respect to D. melanogaster was largely uncertain until multigene analyses tended to support the same standard tree [9-14,23]. This standard tree is well sup-ported in multiple distinct analyses and is essentially non-controversial, representing the currently accepted statement concerning the relatedness of the first twelve fully sequenced Drosophila genomes. However, previ-ous single gene analyses supported a variety of distinct trees [15,16,24-30], and more comprehensive surveys of putative orthologs revealed a high frequency of conflict-ing trees [11-13]. Even though the currently accepted
100
87 100
100 100
100 100 100
100
65 100 100
66 99 91
100 D. yakuba
D. persimilis
D. pseudoobscura D. ananassae D. sechellia
D. melanogaster D. simulans
obscura group melanogaster group
D. willistoni
D. grimshawi D. mojavensis D. virilis
willistoni group
repleta group virilis group
[image:5.595.58.539.90.237.2]hawaiian group
Figure 5The lower dimension SVD tree for the 11Drosophilaspecies (excludingD. erecta) using 300 vectors, without filtering any proteins (upper branch values, modified jackknife and lower branch values, bootstrap procedure for tree generation).
D. erecta
D. sechellia
D. simulans
D. melanogaster
D. yakuba
D. ananassae
100 66
52
100 100
90
melanogaster group
[image:5.595.59.541.622.704.2]phylogeny had the strongest support, depending on the evolutionary model applied, roughly 40% of all ortholo-gous genes examined supported alternative phylogenies within themelanogastersubgroup [12]. In this case, the standard D. erecta/D. yakuba cluster was specifically examined, and only two alternatives, those in which ei-ther of these species specifically clustered instead with D. melanogaster, were considered. Two reasons are com-monly offered to explain the conflicts observed in these surveys of single gene phylogenies: incomplete lineage sorting, and introgression. Either of these processes could potentially be at least partly responsible for the novel grouping ofD. erectaandD. sechelliawe observed under the special mid-range filtering conditions reported here.
An alternative but not mutually exclusive explanation for the conditional novel clustering observed in this work is that the sequence signal causing this exists pri-marily outside of a reasonably complete list of identifi-able orthologs (Additional file 2). Although not a necessity, this signal could easily be interpreted as homoplasious. This interpretation is supported by the fact that the standard clustering of D. yakuba and D. erecta was observed again when using only protein sequences with the highest projection values, which includes a small subset of proteins that are more likely to represent close homologs or orthologs. It is also pos-sible that the sequence signal responpos-sible might not be exclusively located outside identifiable orthologs, but might also be partly embedded within orthologs as simi-lar subsets of specific sequence changes within these
genes. In either case, it would still be interesting to fur-ther investigate the source and strength of these pre-sumed homoplasies, given that they specifically and consistently support a single alternative placement for a single species within a complex tree.
Regardless of their location relative to orthologs, if the sequence characteristics within our all-inclusive analysis that consistently result in the association of D.erecta with D. sechellia represent homoplasious molecular responses to one or more environmental conditions, then this represents a third widely recognized mechan-ism for generating phylogenetic conflict within sequence data: adaptive convergence. Hence the affinity observed here betweenerectaandsechelliacould result from non-random homoplasy with evolutionary significance. As an example for illustration, consider that D. sechellia and D. erectaare two of only three“specialist”species in the phylogeny that have adapted to specific food sources, and unlike the third species (virilis), they are closely related members of themelanogastersubgroup and have both adapted to particular fruits [31]. Although this sin-gle proposed adaptation might seem unlikely to be the sole source of a homoplasious signal capable of cluster-ing D. sechillia and D. erecta in our analysis, multiple similar undiscovered or undescribed convergences could produce a sufficiently robust signal.
Methods
Datasets
Complete predicted protein sequences for 12Drosophila species were downloaded from the‘Assembly, Alignment
100 100
100 97
96
52
D. erecta D. sechellia
D. simulans
D. melanogaster
D. yakuba
D. ananassae
[image:6.595.58.538.91.171.2]melanogaster group
Figure 7The lower dimension SVD tree for the 6Drosophilaspp., using 300 vectors, with heavy filtering of proteins with projection values≤±0.035.A total of 4048 (4.06%) proteins were used for constructing trees (upper branch values, modified jackknife and lower branch values, bootstrap procedure for tree generation).
100
100 81
88
D. sechellia
D. simulans
D. melanogaster
D. yakuba
D. ananassae
melanogaster group
[image:6.595.59.538.625.694.2]and Annotation of 12 Drosophila species’ website (http://rana.lbl.gov/drosophila/) and were compiled into a single dataset. Various distinct subsets of this larger dataset were also constructed. The number of protein sequences found within the genome of each species of Drosophilais summarized in Table 1.
Peptide frequencies and SVD
The twenty amino acids provide 160,000 possible tetra-peptides, defining each row of the peptide frequency matrix. For every protein, the frequency of each of these tetrapeptides formed the columns of the matrix. The resulting matrix is thus a peptide frequency matrix (A), with each column providing protein vector definitions using 160,000 separate tetrapeptide frequency elements. In our previous studies, using tripeptides we were able to estimate similarities between highly divergent, small set of proteins [32]. It was also shown that tetrapeptides work better for larger data sets derived from vertebrate mitochondrial genomes or whole bacterial genomes [4]. Since, pentapeptides did not add any resolution for esti-mating similarities on our simulated datasets (unpub-lished); we chose tetrapeptides for constructing frequency matrix. A peptide frequency matrix was generated for all the three datasets, separately. The resulting matrix was then subjected to a truncated SVD analysis that generates three component matrices: the “left” matrix or “peptide” matrix (U), the“right”matrix or“protein” matrix (V) and the central matrix (P). The original matrix can be reformed using the relation A = U P VT. The “protein” vectors provided in the “right” factor matrix are known to provide reduced dimensional definitions for all pro-teins in the dataset as linear combinations of the orthog-onal “right” singular vectors [6]. The dataset could produce a total of 910 singular vectors with the reduced dimensional space. An examination of the contribution provided by the less dominant singular vectors showed that these vectors tended to decrease the resolution of the resulting phylogenetic tree (not shown). Using the first 800 vectors was thus determined to be sufficient. The current phylogenetic studies were conducted under two different SVD settings, one referred as “higher di-mension,” where we used a total of 800 singular triplets as output and the other referred as “lower dimension” using only 400 singular triplets as output. The SVD was then applied to the 12, 11 and 6 species datasets of Drosophila separately. Three output matrices were obtained consisting of 800 (for higher dimension analysis) and 500 (for lower dimension analysis) singular triplets (left and right singular vectors and their corresponding singular value). Higher the value of vector elements, most domin-ant is the singular vector and these singular vectors define one or two conserved gene families (or subfamilies) as particular linear combinations of proteins. The detailed
comparative information contained within the hundreds of singular vectors and their corresponding motifs and gene families was subsequently used to build a species phylogeny by summing all the SVD-derived right pro-tein vectors separately for each organism and then comparing the relative orientation of the resulting spe-cies vectors [6].
Filtering proteins
A systematic exclusion of protein sequences, based on their projection values were done to filter poorly described proteins. The projection value represent a given protein range from −1 to +1. In the first step, all protein sequences having projection value less than or equal +0.001 and more than or equal to −0.001 were removed (about 9,500 sequences). The filter was increased stepwise with an increment of 0.001 and each corresponding dataset was used in turn to construct a tree.
Species trees and branch support
Distance matrices were derived by summing all the SVD derived right protein vectors for a given organism and then comparing the relative orientation of the resulting species vectors using the program cosdist. Species trees were subsequently derived from distance matrices using Phylip-Neighbor. Two distinct resampling methods were used to provide branch support: a traditional bootstrap procedure and a modified jackknife procedure. For the bootstrap, a fixed number of singular vectors were ran-domly sampled from the total singular vectors generated and were used to construct 100 species trees. For the successive delete-one jackknife procedure [4-7], the least dominant singular vector was removed successively (from the total vectors generated, down to 100 vectors) to generate ordered sets of singular vectors, and a new tree was estimated following each removal.
Additional files
Additional file 1:SVD (higher dimension) tree for the 12Drosophila
spp., using all 700 vectors, with filtering cut off value of ±0.003, retaining 88,026 (45.46%) protein sequences (upper branch values, modified jackknife and lower branch values, bootstrap procedure for tree generation).
Additional file 2:SVD (higher dimension) tree for the 12Drosophila
spp., using all 700 vectors, with filtering cut off value of ±0.032, retaining 8,583 (4.43%) protein sequences (upper branch values, modified jackknife and lower branch values, bootstrap procedure for tree generation).
Additional file 3:SVD (lower dimension) tree for the 11Drosophila
species (excludingD. melanogaster), using 300 vectors, without filtering any proteins (upper branch values, modified jackknife and lower branch values, bootstrap procedure for tree generation).
any proteins (upper branch values, modified jackknife and lower branch values, bootstrap procedure for tree generation).
Additional file 5:SVD (lower dimension) tree for the 11Drosophila species (excludingD. ananassae) using 300 vectors, without filtering any proteins (upper branch values, modified jackknife and lower branch values, bootstrap procedure for tree generation).
Additional file 6:SVD (lower dimension) tree for the 11Drosophila
species (excludingD. yakuba) using 300 vectors, without filtering any proteins (upper branch values, modified jackknife and lower branch values, bootstrap procedure for tree generation).
Additional file 7:SVD (lower dimension) tree for the 11Drosophila species (excludingD. sechellia) using 300 vectors, without filtering any proteins (upper branch values, modified jackknife and lower branch values, bootstrap procedure for tree generation).
Additional file 8:SVD (lower dimension) tree for the 11Drosophila
species (excludingD. melanogaster), using 300 vectors, with filtering cut off value of ±0.035, retaining 4146 (2.43%) protein sequences (upper branch values, modified jackknife and lower branch values, bootstrap procedure for tree generation).
Additional file 9:SVD (lower dimension) tree for the 11Drosophila
species (excludingD. sechellia), using 300 vectors, with filtering cut off value of ±0.035, retaining 4271 (2.43%) protein sequences (upper branch values, modified jackknife and lower branch values, bootstrap procedure for tree generation).
Additional file 10:SVD (lower dimension) tree for the 11Drosophila
species (excludingD. simulans), using 300 vectors, with filtering cut off value of ±0.035, retaining 4611 (2.61%) protein sequences (upper branch values, modified jackknife and lower branch values, bootstrap procedure for tree generation).
Additional file 11:SVD (lower dimension) tree for the 11Drosophila
species (excludingD. ananassae), using 300 vectors, with filtering cut off value of ±0.035, retaining 4343 (2.45%) protein sequences (upper branch values, modified jackknife and lower branch values, bootstrap procedure for tree generation).
Additional file 12:SVD (lower dimension) tree for the 11Drosophila
species (excludingD. yakuba), using 300 vectors, with filtering cut off value of ±0.035, retaining of 4628 (2.63%) protein sequences (upper branch values, modified jackknife and lower branch values, bootstrap procedure for tree generation).
Competing interests
The authors declare that there are no competing interests.
Authors’contributions
GS established the overall concept and approach, and AS completed the phylogenetic analysis, as well as producing all tables, figures, and writing early drafts of the manuscript. All authors read and approved the final manuscript.
Acknowledgements
Support for this work was provided in part by the Biology Department and the School of Graduate Studies at Indiana State University. In addition, help with software development and modification was provided by Yihua Bai from the Center for Instructional and Research Technology at ISU.
Received: 9 October 2012 Accepted: 27 November 2012 Published: 4 December 2012
References
1. Dutilh BE, Snel B, Ettema TJ, Huynen MA:Signature genes as a phylogenomic tool.Mol Biol Evol2008,25(8):1659–1667.
2. Belda E, Moya A, Silva FJ:Genome rearrangement distances and gene order phylogeny in gamma-Proteobacteria.Mol Biol Evol2005, 22(6):1456–1467.
3. Ciccarelli FD, Doerks T, von Mering C, Creevey CJ, Snel B, Bork P:Toward automatic reconstruction of a highly resolved tree of life.Science2006, 311(5765):1283–1287.
4. Stuart GW, Berry MW:An SVD-based comparison of nine whole eukaryotic genomes supports a coelomate rather than ecdysozoan lineage.BMC Bioinformatics2004,5:204.
5. Stuart GW, Moffett K, Baker S:Integrated gene and species phylogenies from unaligned whole genome protein sequences.Bioinformatics2002, 18(1):100–108.
6. Stuart GW, Moffett K, Leader JJ:A comprehensive vertebrate phylogeny using vector representations of protein sequences from whole genomes. Mol Biol Evol2002,19(4):554–562.
7. Stuart GW, Moffett PK, Bozarth RF:A comprehensive open reading frame phylogenetic analysis of isometric positive strand ssRNA plant viruses. Arch Virol2006,151(6):1159–1177.
8. Drosophila.12.Genomes.Consortium:Evolution of genes and genomes on the Drosophila phylogeny.Nature2007,450(7167):203–218.
9. Bhutkar A, Gelbart WM, Smith TF:Inferring genome-scale rearrangement phylogeny and ancestral gene order: a Drosophila case study. Genome Biol2007,8(11):R236.
10. Clark AG, Eisen MB, Smith DR, Bergman CM, Oliver B, Markow TA, Kaufman TC, Kellis M, Gelbart W, Iyer VN,et al:Evolution of genes and genomes on the Drosophila phylogeny.Nature2007, 450(7167):203–218.
11. Machado CA, Hey J:The causes of phylogenetic conflict in a classic Drosophila species group.Proc Biol Sci2003,270(1520):1193–1202. 12. Pollard DA, Iyer VN, Moses AM, Eisen MB:Widespread discordance of gene
trees with species tree in Drosophila: evidence for incomplete lineage sorting.PLoS Genet2006,2(10):e173.
13. Wong A, Jensen JD, Pool JE, Aquadro CF:Phylogenetic incongruence in the Drosophila melanogaster species group.Mol Phylogenet Evol2007, 43(3):1138–1150.
14. Rosenfeld JA, DeSalle R, Lee EK, O'Grady P:Using whole genome presence/absence data to untangle function in 12 Drosophila genomes. Fly (Austin)2008,2(6):291–299.
15. Russo CA, Takezaki N, Nei M:Molecular phylogeny and divergence times of drosophilid species.Mol Biol Evol1995,12(3):391–404.
16. Lewis RL, Beckenbach AT, Mooers AO:The phylogeny of the subgroups within the melanogaster species group: likelihood tests on COI and COII sequences and a Bayesian estimate of phylogeny.Mol Phylogenet Evol 2005,37(1):15–24.
17. O'Grady PM, Kidwell MG:Phylogeny of the subgenus Sophophora (Diptera: Drosophilidae) based on combined analysis of nuclear and mitochondrial sequences.Mol Phylogenet Evol2002, 22(3):442–453.
18. Remsen J, O'Grady P:Phylogeny of Drosophilinae (Diptera: Drosophilidae), with comments on combined analysis and character support.Mol Phylogenet Evol2002,24(2):249–264.
19. Powell JR:Progress and prospects in evolutionary biology: the Drosophila model. New York: Oxford University Press; 1997.
20. Singh ND, Larracuente AM, Sackton TB, Clark AG:Comparative Genomics on the Drosophila Phylogenetic Tree.Annu Rev Ecol Evol S2009, 40:459–480.
21. Stark A, Lin MF, Kheradpour P, Pedersen JS, Parts L, Carlson JW, Crosby MA, Rasmussen MD, Roy S, Deoras AN,et al:Discovery of functional elements in 12 Drosophila genomes using evolutionary signatures.Nature2007, 450(7167):219–232.
22. Hahn MW, Han MV, Han SG:Gene family evolution across 12 Drosophila genomes.PLoS Genet2007,3(11):e197.
23. Kopp A, True JR:Phylogeny of the Oriental Drosophila melanogaster species group: a multilocus reconstruction.Syst Biol2002,51(5):786–805. 24. Arhontaki K, Eliopoulos E, Goulielmos G, Kastanis P, Tsakas S, Loukas M,
Ayala F:Functional constraints of the Cu, Zn superoxide dismutase in species of the Drosophila melanogaster subgroup and phylogenetic analysis.J Mol Evol2002,55(6):745–756.
25. Gailey DA, Ho SK, Ohshima S, Liu JH, Eyassu M, Washington MA, Yamamoto D, Davis T:A phylogeny of the Drosophilidae using the sex-behaviour gene fruitless.Hereditas2000,133(1):81–83.
26. Jeffs PS, Holmes EC, Ashburner M:The molecular evolution of the alcohol dehydrogenase and alcohol dehydrogenase-related genes in the Drosophila melanogaster species subgroup.Mol Biol Evol1994, 11(2):287–304.
28. Matsuo Y:Molecular evolution of the histone 3 multigene family in the Drosophila melanogaster species subgroup.Mol Phylogenet Evol2000, 16(3):339–343.
29. Schlotterer C, Hauser MT, von Haeseler A, Tautz D:Comparative evolutionary analysis of rDNA ITS regions in Drosophila.Mol Biol Evol 1994,11(3):513–522.
30. Shibata H, Yamazaki T:Molecular evolution of the duplicated Amy locus in the Drosophila melanogaster species subgroup: concerted evolution only in the coding region and an excess of nonsynonymous substitutions in speciation.Genetics1995,141(1):223–236.
31. Markow TA, O’Grady PM:Drosophila biology in the genomic age.Genetics 2007,177(3):1269–1276.
32. Stuart GW, Berry MW:A comprehensive whole genome bacterial phylogeny using correlated peptide motifs defined in a high dimensional vector space.J Bioinform Comput Biol2003,1(3):475–493.
doi:10.1186/1756-0500-5-670
Cite this article as:Seetharam and Stuart:Whole genome phylogenies for multipleDrosophilaspecies.BMC Research Notes20125:670.
Submit your next manuscript to BioMed Central and take full advantage of:
• Convenient online submission
• Thorough peer review
• No space constraints or color figure charges
• Immediate publication on acceptance
• Inclusion in PubMed, CAS, Scopus and Google Scholar
• Research which is freely available for redistribution