S H O R T R E P O R T
Open Access
A novel mean-centering method for normalizing
microRNA expression from high-throughput
RT-qPCR data
Dennis Wylie, Jeffrey Shelton, Ashish Choudhary and Alex T Adai
*Abstract
Background:Normalization is critical for accurate gene expression analysis. A significant challenge in the quantitation of gene expression from biofluids samples is the inability to quantify RNA concentration prior to analysis, underscoring the need for robust normalization tools for this sample type. In this investigation, we evaluated various methods of normalization to determine the optimal approach for quantifying microRNA (miRNA) expression from biofluids and tissue samples when using the TaqMan® Megaplex™high-throughput RT-qPCR platform with low RNA inputs.
Findings:We compared seven normalization methods in the analysis of variation of miRNA expression from biofluid and tissue samples. We developed a novel variant of the common mean-centering normalization strategy, herein referred to as mean-centering restricted (MCR) normalization, which is adapted to the TaqMan Megaplex RT-qPCR platform, but is likely applicable to other high-throughput RT-RT-qPCR-based platforms. Our results indicate that MCR normalization performs comparable to or better than both standard mean-centering and other normalization methods. We also propose an extension of this method to be used when migrating biomarker signatures from Megaplex to singleplex RT-qPCR platforms, based on the identification of a small number of normalizer miRNAs that closely track the mean of expressed miRNAs.
Conclusions:We developed the MCR method for normalizing miRNA expression from biofluids samples when using the TaqMan Megaplex RT-qPCR platform. Our results suggest that normalization based on the mean of all fully observed (fully detected) miRNAs minimizes technical variance in normalized expression values, and that a small number of normalizer miRNAs can be selected when migrating from Megaplex to singleplex assays. In our study, we find that normalization methods that focus on a restricted set of miRNAs tend to perform better than methods that focus on all miRNAs, including those with non-determined (missing) values. This methodology will likely be most relevant for studies in which a significant number of miRNAs are not detected.
Background
MicroRNAs (miRNAs) are small, non-coding RNA molecules that have key regulatory roles in mammalian cells. Misregulation of miRNA expression has been implicated in several diseases including cancers, result-ing in a growresult-ing interest in identifyresult-ing miRNA biomar-kers with diagnostic value [1]. Extracellular circulating miRNAs have been detected in serum, plasma, and other body fluids (collectively referred to as biofluids) by real-time quantitative RT-PCR (RT-qPCR), opening up
the possibility for the use of these miRNAs as novel clinical biomarkers [2,3].
TaqMan Megaplex RT-qPCR technology enables the simultaneous detection of 377 miRNAs from a single reverse transcription reaction, greatly reducing the amount of starting material and the number of RT reac-tions required for quantitative gene expression analysis [4]. Because singleplex RT-qPCR is considered to have the highest standard of sensitivity and is a preferred for-mat for clinical tests, it will be critical to develop analy-tical tools to reconcile differences between the two platforms, so that potential miRNA biomarkers can be more accurately migrated to development.
* Correspondence: [email protected] Asuragen Inc, Austin, TX 78744, USA
Normalization–the process of reducing technical error or variation between samples–is critical for accurate expression analysis. In studies with tissue samples, RNA input is typically equalized between samples before ana-lysis, removing variation due to RNA concentration dif-ferences. One of the most significant challenges in quantifying miRNA expression from biofluids is the fact that the RNA concentration is typically below the limit of quantitation by spectrophotometry, making it difficult to measure and equalize RNA input levels before analy-sis by RT-qPCR. Another challenge is the lack of stan-dardized protocols for RNA purification from biofluids; further increasing variability when comparing samples that have undergone different procedures.
Normalization of singleplex miRNA RT-qPCR data from solid tissue samples has been thoroughly evaluated at Asuragen [5] and elsewhere [6-8]. However, our cur-rent work is focused on the high-throughput analysis of miRNA expression using the TaqMan Megaplex RT-qPCR platform. Thus, we propose MCR, a novel varia-tion on the strategy of mean-centering, for normalizing miRNA RT-qPCR data when using the TaqMan Mega-plex platform. We also propose CCR, a normalizer selection strategy to enable migrating signatures from Megaplex to singleplex RT-qPCR. This strategy aims to identify normalizer miRNAs whose expression values across samples most closely track the mean value of all miRNAs.
Materials and methods RNA isolation and RT-qPCR
All experimental work was performed at Asuragen by Asuragen’s Pharmacogenomics Services Group using internally developed and optimized protocols. Human placenta and brain total RNA was obtained from Ambion, part of Life Technologies. For these reference RNAs, six different mass inputs (100 ng, 10 ng, 1 ng, 0.5 ng, 0.05 ng, and 0.005 ng) were used for reverse tran-scription (RT). For the biofluid studies, blood samples were collected from healthy donors after obtaining informed consent, under institutional review board-approved protocols. Sera was pooled, divided into ali-quots, and stored at -80°C. Total RNA was isolated from the serum and the RNA equivalents of serum volumes of 300 μL, 200 μL, 100 μL, 50 μL, and 25 μL were used for RT. TaqMan Megaplex RT and preampli-fication reactions were performed using equal volumes of input RNA according to the manufacturer’s protocol, and real-time PCR was run on the TaqMan miRNA Array Card A using the Applied Biosystems 7900HT Real-Time PCR System. Data were processed and exported with Applied Biosystems SDSv2.3 software, and were subsequently analyzed using the R program-ming language.
Normalization
Additional file 1: Figure S1 and Additional file 1: Figure S2 depict the pseudocode for the MCR and CCR algo-rithms, respectively. Existing normalization methods were implemented as described previously [6-11] or are available through the appropriate R packages (limma for MAD-scaling and quantile normalization, and epiR for the estimate of the concordance correlation coefficient). The geNorm and NormFinder algorithms were imple-mented at Asuragen, and were run to choose normali-zers considering only fully detected miRNAs (those with Ct values less than 40). Normalizer selection using the CCR algorithm was also restricted to fully detected miR-NAs, though for this algorithm a Ct threshold of less than 35 was required for a miRNA to be considered detected in a given sample.
It should be noted that the presence of one or more samples with significantly lower overall RNA content can significantly reduce the size of the fully detected miRNA set. This problem, particularly for normalizer-based methods, is compounded by the increased noise in Ct determination for probes detected only at very high Ct values (35-40 Ct), which may render the mea-surements for such probes unreliable. As a result, the CCR algorithm provides an option to treat Ct values above a user-specified threshold as non-detected. This threshold may be adjusted upward in the presence of RNA-depleted samples, to include miRNAs that are detected strongly in most samples but weakly in samples with depleted RNA content. Alternately, the maximum Ct threshold of the CCR algorithm may be adjusted downward when no such depleted samples are present, thereby removing weakly detected miRNAs.
Results and discussion
samples (See Additional file 1: Figure S1 for pseudo-code). As an extension of this method, we also devel-oped a normalization strategy that will be applicable when migrating from Megaplex (hundreds of miRNAs) to singleplex (generally tens of miRNAs) RT-qPCR. This strategy, herein referred to as concordance correlation restricted (CCR) normalization, uses a concordance cor-relation coefficient [12] to select miRNAs that are con-cordant with the restricted mean expression value (See Additional file 1: Figure S2 for pseudocode).
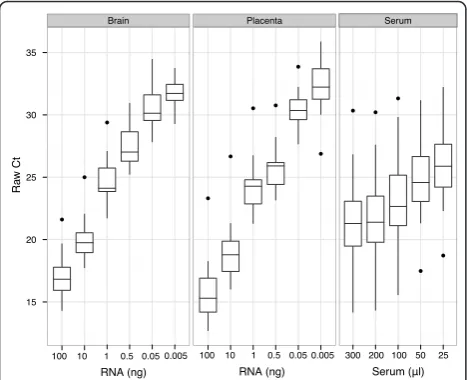
We used titration studies (Figure 1) to evaluate each normalization method on Megaplex RT-qPCR data. In each study, we calculated the standard deviations of nor-malized expression levels of each miRNA associated with each normalization method (Figure 2 and Addi-tional file 1: Figure S3). We found the MCR method to produce among the lowest mean estimates of standard deviations compared to the other normalization meth-ods. The normalizer-based methods (geNorm, NormFin-der, and CCR), which subtract the mean expression values of a given subset of miRNAs from all other miR-NAs, also performed well by this metric; on the other hand, MAD-scaling and quantile normalization joined non-restricted mean-centering (MC) in showing rela-tively poor performance with regard to minimization of technical variance.
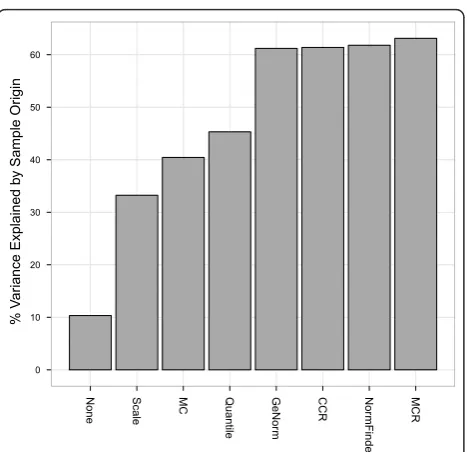
Next, we determined which normalization procedure best captured the underlying biological differences (i.e., the tissue origin) between samples. We used variance principal component analysis [13] to estimate the per-cent variance explained by the biological (tissue) origin
of the samples used in the titration studies (Figure 3). The results suggest that MCR normalization and the normalizer-based methods are better able to capture the tissue origin of the samples compared to the other nor-malization methods (MAD-scaling, quantile normaliza-tion, and MC).
The CCR normalizers selected from the titration studies were miR-222 and miR-320; the average value of these two miRNAs had a concordance correlation coefficient with the restricted sample means of 0.992 (95% CI: 0.978-0.997), while individually the two had concordance corre-lations of 0.986 (miR-222) and 0.971 (miR-320) with the restricted sample mean (the median concordance correla-tion for all miRNAs with the restricted sample mean was 0.504, while the median Pearson correlation was 0.851). We specified the output of two normalizers from all three normalizer algorithms (geNorm, NormFinder, and CCR) applied to the titration study to facilitate algorithmic com-parisons, but it is worth noting that the improvement in concordance correlation from adding the second normali-zer is relatively small - if we had used the convergence cri-terion (See Materials and Methods) of our implementation of CCR instead of specifying the normalizer count, only
Ra w C t 15 20 25 30 35 Brain ● ● ●
100 10 1
Placenta ● ● ● ● ● ● Serum ● ● ● ● ●
Serum (ѥl) RNA (ng)
0.5 0.05 0.005 100 10 1 0.5 0.05 0.005
RNA (ng)
[image:3.595.306.540.87.310.2]300 200 100 50 25
Figure 1Distribution of Ct values of unnormalized RT-qPCR data. The distribution of raw (unnormalized) Ct values are shown for each titration series performed with brain, placenta, and serum samples. The percent non-determined calls (Ct > 40) significantly increased with the mean Ct value of the sample.
Mean S tandard De viation 1 2 3 4 5 6 ● ● ●● ●● ●● ● ● ● ● ● ● ● ● ● ● ●● ●● ●● ● ● ● ● ● ● ● ● MCR GeNor m Nor mFinde r
CCR Quantile MC Scale None
miRNA Subset ● ● All miRNAs
●
● Restricted miRNAs
Sample Origin ● ● Brain
[image:3.595.57.291.483.673.2]Placenta Serum
miR-222 would have been selected. This is likely attributa-ble to the high level of correlation between the Ct mea-surements of different miRNAs over a data set whose variance is largely driven by overall input RNA amount. While most data sets of interest will have considerably less variation in input RNA compared to a titration study, we have regularly seen CCR produce only 1 or 2 normalizer candidates.
The results from both experimental approaches sug-gest that the MCR normalization method performs comparable to or better than the other methods accord-ing to the standard deviation metric. Additionally, the CCR method exhibits comparable performance to the more established normalizer-based methods, geNorm and NormFinder. The CCR method will be applicable when assays are migrated from multiplex to singleplex RT-qPCR platforms. We note that the algorithms with strong performance (MCR, CCR, geNorm, and Norm-Finder) have one major feature in common: all analyze only fully detected miRNAs. However, NormFinder and geNorm implement complex algorithms for identifying normalizers. In contrast, the MCR and CCR algorithms are conceptually simpler because they rely only on a
mean estimate of miRNA expression; thus, they are likely to be more practical to implement, especially for larger datasets. For example, our implementation of CCR ran more than 100 times faster than either Norm-Finder or geNorm when applied to a randomly gener-ated matrix of 500 pseudogenes (with no missing values) and 20 pseudosamples (0.13 s for CCR, 29 s for NormFinder, and 2700 s for geNorm) (data not shown).
Conclusion
There is a critical need for robust methods of normaliz-ing miRNA expression data from biofluid samples and other sample types with low RNA inputs. In general, we observed that normalizing the data is beneficial com-pared to the absence of normalization, and that array-based normalization methods (Scale, MC, MCR, and Quantile) tend to perform worse than miRNA (gene)-specific normalization methods (CCR, GeNorm, and NormFinder), with the exception of MCR. The MCR method, based on the mean of all fully detected miR-NAs, reduced the standard deviations across the titra-tion samples, while also showing maximum separatitra-tion between true biologically different sample types using variance principal component analysis. Our results sug-gest that the conceptually simple MCR (and its cousin implementation CCR) normalization strategy performs comparable to or better than existing methods for nor-malization of high-throughput RT-qPCR data. This strategy is well suited for studies in which a significant number of expression values are missing (non-deter-mined), including studies with biofluids samples.
Normalizer-based methods require that at least one miRNA is fully detected across all samples. In cases where no miRNAs have 100% detection, removal of the potential outlier sample(s) usually remedies the situation. The optimal normalization strategy for any given study can be exhausting to uncover, but MCR and CCR should be among the first normalization methods to evaluate. To enable MCR and CCR adoption, we have made the source code freely available (See Additional file 2). In general, we would recommend using any normalizer-based method that relies on fully detected miRNAs.
Additional material
Additional file 1: Supplemental Figures. This document contains 3 supplemental figures referenced in the main text. The first two supplemental figures are pseudocodes detailing the MCR and CCR algorithms, while the third figure shows the overall distribution of standard deviations after application of different normalization methods.
Additional file 2: R source code implementing MCR and CCR. This file contains source code that implements the MCR and CCR algorithms. A small example that demonstrates usage is also provided.
% V
ar
iance Explained b
y Sample Or
igin
0 10 20 30 40 50 60
None Scale MC Quantile GeNor
m
CCR Nor
mFinde
r
[image:4.595.58.292.85.311.2]MCR
Figure 3Variance explained by sample origin. Bars show the percent variance explained by sample origin (tissue type) based on weighting results from a univariate random effect model using the eigenvalues from principal component analysis (PCA). We used the first three principal components and their corresponding
List of abbreviations
CCR: concordance correlation restricted; MAD: median absolute deviation; MC: mean-centering; MCR: mean-centering restricted; miRNA: microRNA; PCA: principal component analysis; RT-qPCR: real-time quantitative RT-PCR.
Acknowledgements
We would like to acknowledge Sarah Adai for assistance in the preparation of this manuscript, and Sandi Calhoun for assistance with the experimental work.
Authors’contributions
ATA and DW designed the analysis plan; DW carried out the analysis; JS performed the experimental work; AC implemented the geNorm and NormFinder algorithms; DW and ATA wrote the paper. All authors read and approved the final manuscript.
Competing interests
The authors declare that they have no competing interests.
Received: 20 June 2011 Accepted: 21 December 2011 Published: 21 December 2011
References
1. Cortez MA, Ivan C, Zhou P, Wu X, Ivan M, Calin GA:microRNAs in cancer: from bench to bedside.Adv Cancer Res2010,108:113-157.
2. Etheridge A, Lee I, Hood L, Galas D, Wang K:Extracellular microRNA: a new source of biomarkers.Mutat Res2011,717(1-2):85-90.
3. Kroh EM, Parkin RK, Mitchell PS, Tewari M:Analysis of circulating microRNA biomarkers in plasma and serum using quantitative reverse transcription-PCR (qRT-PCR).Methods2010,50:298-301.
4. Mestdagh P, Feys T, Bernard N, Guenther S, Chen C, Speleman F, Vandesompele J:High-throughput stem-loop RT-qPCR miRNA expression profiling using minute amounts of input RNA.Nucleic Acids Res2008,36: e143.
5. Peltier HJ, Latham GJ:Normalization of microRNA expression levels in quantitative RT-PCR assays: identification of suitable reference RNA targets in normal and cancerous human solid tissues.RNA2008,
14:844-852.
6. Vandesompele J, De Preter K, Pattyn F, Poppe B, Van Roy N, De Paepe A, Speleman F:Accurate normalization of real-time quantitative RT-PCR data by geometric averaging of multiple internal control genes.Genome Biol2002,3:RESEARCH0034.
7. Andersen CL, Jensen JL, Orntoft TF:Normalization of real-time quantitative reverse transcription-PCR data: a model-based variance estimation approach to identify genes suited for normalization, applied to bladder and colon cancer data sets.Cancer Res2004,64:5245-5250. 8. Mestdagh P, Van Vlierberghe P, De Weer A, Muth D, Westermann F,
Speleman F, Vandesompele J:A novel and universal method for microRNA RT-qPCR data normalization.Genome Biol2009,10:R64. 9. Yang YH, Dudoit S, Luu P, Lin DM, Peng V, Ngai J, Speed TP:Normalization
for cDNA microarray data: a robust composite method addressing single and multiple slide systematic variation.Nucleic Acids Res2002,30:e15. 10. Smyth GK, Speed T:Normalization of cDNA microarray data.Methods
2003,31:265-273.
11. Bolstad BM, Irizarry RA, Astrand M, Speed TP:A comparison of normalization methods for high density oligonucleotide array data based on variance and bias.Bioinformatics2003,19:185-193.
12. Lin LI:A concordance correlation coefficient to evaluate reproducibility.
Biometrics1989,45:255-268.
13. Scherer A:Batch effects and noise in microarray experiments: sources and solutions.Chichester, U.K.: J. Wiley; 2009.
doi:10.1186/1756-0500-4-555
Cite this article as:Wylieet al.:A novel mean-centering method for normalizing microRNA expression from high-throughput RT-qPCR data.
BMC Research Notes20114:555.
Submit your next manuscript to BioMed Central and take full advantage of:
• Convenient online submission
• Thorough peer review
• No space constraints or color figure charges
• Immediate publication on acceptance
• Inclusion in PubMed, CAS, Scopus and Google Scholar
• Research which is freely available for redistribution