R E S E A R C H A R T I C L E
Open Access
Association of
HADHA
expression with the risk of
breast cancer: targeted subset analysis and
meta-analysis of microarray data
Manju Mamtani
1and Hemant Kulkarni
1,2*Abstract
Background:The role of n-3 fatty acids in prevention of breast cancer is well recognized, but the underlying molecular mechanisms are still unclear. In view of the growing need for early detection of breast cancer, Graham et al. (2010) studied the microarray gene expression in histologically normal epithelium of subjects with or without breast cancer. We conducted a secondary analysis of this dataset with a focus on the genes (n = 47) involved in fat and lipid metabolism. We used stepwise multivariate logistic regression analyses, volcano plots and false discovery rates for association analyses. We also conducted meta-analyses of other microarray studies using random effects models for three outcomes–risk of breast cancer (380 breast cancer patients and 240 normal subjects), risk of metastasis (430 metastatic compared to 1104 non-metastatic breast cancers) and risk of recurrence (484 recurring versus 890 non-recurring breast cancers).
Results:TheHADHAgene [hydroxyacyl-CoA dehydrogenase/3-ketoacyl-CoA thiolase/enoyl-CoA hydratase (trifunctional protein), alpha subunit] was significantly under-expressed in breast cancer; more so in those with estrogen receptor-negative status. Our meta-analysis showed an 18.4%-26% reduction inHADHAexpression in breast cancer. Also, there was an inconclusive but consistent under-expression ofHADHAin subjects with metastatic and recurring breast cancers.
Conclusions:Involvement of mitochondria and the mitochondrial trifunctional protein (encoded byHADHAgene) in breast carcinogenesis is known. Our results lend additional support to the possibility of this involvement. Further, our results suggest that targeted subset analysis of large genome-based datasets can provide interesting
association signals.
Keywords:Breast cancer,HADHAgene, Gene expression profiling, Microarray, Meta-analysis
Background
Early detection of malignant breast neoplasms is critical to cancer prevention and treatment. Cancer chemopre-vention (also called as treatment of carcinogenesis) is a primordial prevention step that is receiving considerable attention. In that context, the identification of an ideal biomarker for breast cancer has become increasingly important. In spite of the vast number of studies con-ducted in the past; a recent, comprehensive and elegant review argues that there is still a lack of clarity regarding the understanding of the process of breast carcinogenesis
[1]. Interestingly, it has been demonstrated that the mammary gland basal cells have features consistent with the progenitor stem cells and that they can differentiate into benign or malignant lesions intraductally [2]. It has also been shown in murine models that differentiated intact mammary glands can exert a negative influence on the development of breast cancer [3]. However, the search for an ideal breast cancer biomarker is still on [4].
A logical undertaking in this direction is the use of microarrays to study the differential gene expressions in breast cancer. Consistent with the spirit of research that encourages very early detection of carcinogenesis, Gra-ham et al. [5] recently studied histologically normal epithelium from subjects with and without breast cancer * Correspondence: [email protected]
1Lata Medical Research Foundation, Nagpur, India
Full list of author information is available at the end of the article
and identified an 86-gene signature that indicated a genomic change prior to carcinogenesis. They found that many of these genes belonged to the family of growth factors, cytokines, oxidative stress modifiers, p38 MAP kinase pathway members, transcription regulators or determinants of nucleic acid stability [5].
Interestingly they did not find genes associated with fatty acid or lipid metabolism to be differentially expressed in histologically normal epithelium. Derange-ments of fatty acid and lipid metabolism have been implicated in oncogenesis in many studies, especially in the cancer of breast [6]. It is generally believed that diets rich in n-6 polyunsaturated fatty acids (n-6 PUFA) and saturated fatty acids (SFA) increase the risk of tumorigenesis while diets rich in n-3 polyunsaturated fatty acids (n-3 PUFA) reduce the risk of cancer devel-opment [7-10]. Lipids have the ability to influence the process of neoplasia via their effects on hormone status, cell membrane integrity, signal transduction, immune modulation and regulation of gene expression [11,12]. In this study, we specifically examined whether the genes related to fatty acid and lipid metabolism are also differentially associated with breast cancer status. For this, we used a targeted subset analysis of the microar-ray data from Graham et al. [5] and also conducted meta-analyses of other microarray datasets.
Methods
The primary dataset
The microarray dataset used in the present study is avail-able for public use on the Gene Expression Omnibus website http://www.ncbi.nlm.nih.gov/sites/GDSbrowser? acc=GDS3716 of the National Institutes of Health, USA. Details of the study subjects on whom these microarray studies were conducted have been described previously [5]. Briefly, the dataset comprises microarray data col-lected through Affymetrix Human Genome U133A plat-form that measures expression of 22,283 genes. The data were collected using histologically normal epithelium
from four sets of subjects–those who underwent
reduc-tion mammoplasty (n = 18), those who underwent pre-ventive mastectomy (n = 6), estrogen receptor positive (ER+) breast cancer patients (n = 9) and estrogen recep-tor negative (ER-) breast cancer patients (n = 9). The data were available in normalized format.
Targeted subset analysis
Our main aim was to assess if genes related with fatty acid and lipid metabolism were differentially expressed in the study dataset. For this we first culled a list of genes that have been implicated in the fatty acid and lipid metabolism. We used the DAVID http://david. abcc.ncifcrf.gov and KEGG Pathway http://www.genome. jp/kegg/metabolism.html websites and generated a list of
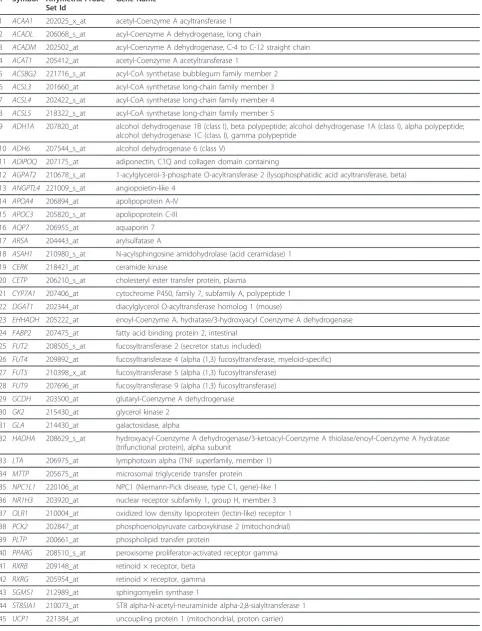
136 genes implicated in one or more of the following pathways: fatty acid metabolism, fatty acid biosynthesis, peroxisome proliferator-activated receptor (PPAR) sig-naling pathway, lipopolysaccharide biosynthesis, lipid metabolism and fat digestion and absorption. A full list with functional annotation of these 136 genes is pro-vided as Additional file 1: Table S1. We then used the DAVID http://david.abcc.ncifcrf.gov and Clone/Gene ID Converter http://idconverter.bioinfo.cnio.es/IDconverter. php programs to find out which of these 136 genes were included in the Affymetrix Human Genome U133A platform. We found 47 probe sets related to genes (Table 1) that partake in lipid or fatty acid meta-bolism to be represented in the study datasets. We con-ducted our analyses on the potential differential expression of these 47 genes. Complete functional anno-tation for these 47 genes is provided in Additional file 2: Table S2.
Replication of the results: meta-analyses
We also aimed to ensure that the results obtained from one microarray dataset were robust and could be repli-cated in other datasets. We queried the Oncomine data-base and retrieved microarray data from other relevant studies. We studied the association of gene expression
with three outcomes–risk of breast cancer, risk of
metastasis and risk of recurrence. We then combined these datasets meta-analytically using the random effects model of DerSimonian and Laird [13,14]. For these ana-lyses the effect size was measured and expressed as the standardized mean difference (SMD) and its 95% confi-dence intervals. The Oncomine website reports the results as means, medians, quartiles and minimum and maximum values. Since the random-effects model assumes normal distribution of the effect measures, we first estimated the mean and standard error for each group (for example, for subjects with breast cancer; sub-jects with a metastatic event or subsub-jects with recurring breast cancer) using the method described by Hozo et al. [15] We then estimated the SMDs. To depict the
potential variability in theHADHA expression based on
the probes used by individual studies, we conducted the meta-analyses separately for each combination of the study and the probe used. Each comparison represented a specific combination of the included study and the reporter used in the study. The between-study
heteroge-neity in this meta-analysis was examined using the I2
Table 1 Genes included in the analyses
# Symbol Affymetrix Probe Set Id
Gene Name
1 ACAA1 202025_x_at acetyl-Coenzyme A acyltransferase 1
2 ACADL 206068_s_at acyl-Coenzyme A dehydrogenase, long chain
3 ACADM 202502_at acyl-Coenzyme A dehydrogenase, C-4 to C-12 straight chain
4 ACAT1 205412_at acetyl-Coenzyme A acetyltransferase 1
5 ACSBG2 221716_s_at acyl-CoA synthetase bubblegum family member 2
6 ACSL3 201660_at acyl-CoA synthetase long-chain family member 3
7 ACSL4 202422_s_at acyl-CoA synthetase long-chain family member 4
8 ACSL5 218322_s_at acyl-CoA synthetase long-chain family member 5
9 ADH1A 207820_at alcohol dehydrogenase 1B (class I), beta polypeptide; alcohol dehydrogenase 1A (class I), alpha polypeptide; alcohol dehydrogenase 1C (class I), gamma polypeptide
10 ADH6 207544_s_at alcohol dehydrogenase 6 (class V)
11 ADIPOQ 207175_at adiponectin, C1Q and collagen domain containing
12 AGPAT2 210678_s_at 1-acylglycerol-3-phosphate O-acyltransferase 2 (lysophosphatidic acid acyltransferase, beta)
13 ANGPTL4 221009_s_at angiopoietin-like 4
14 APOA4 206894_at apolipoprotein A-IV
15 APOC3 205820_s_at apolipoprotein C-III
16 AQP7 206955_at aquaporin 7
17 ARSA 204443_at arylsulfatase A
18 ASAH1 210980_s_at N-acylsphingosine amidohydrolase (acid ceramidase) 1
19 CERK 218421_at ceramide kinase
20 CETP 206210_s_at cholesteryl ester transfer protein, plasma
21 CYP7A1 207406_at cytochrome P450, family 7, subfamily A, polypeptide 1
22 DGAT1 202344_at diacylglycerol O-acyltransferase homolog 1 (mouse)
23 EHHADH 205222_at enoyl-Coenzyme A, hydratase/3-hydroxyacyl Coenzyme A dehydrogenase
24 FABP2 207475_at fatty acid binding protein 2, intestinal
25 FUT2 208505_s_at fucosyltransferase 2 (secretor status included)
26 FUT4 209892_at fucosyltransferase 4 (alpha (1,3) fucosyltransferase, myeloid-specific)
27 FUT5 210398_x_at fucosyltransferase 5 (alpha (1,3) fucosyltransferase)
28 FUT9 207696_at fucosyltransferase 9 (alpha (1,3) fucosyltransferase)
29 GCDH 203500_at glutaryl-Coenzyme A dehydrogenase
30 GK2 215430_at glycerol kinase 2
31 GLA 214430_at galactosidase, alpha
32 HADHA 208629_s_at hydroxyacyl-Coenzyme A dehydrogenase/3-ketoacyl-Coenzyme A thiolase/enoyl-Coenzyme A hydratase (trifunctional protein), alpha subunit
33 LTA 206975_at lymphotoxin alpha (TNF superfamily, member 1)
34 MTTP 205675_at microsomal triglyceride transfer protein
35 NPC1L1 220106_at NPC1 (Niemann-Pick disease, type C1, gene)-like 1
36 NR1H3 203920_at nuclear receptor subfamily 1, group H, member 3
37 OLR1 210004_at oxidized low density lipoprotein (lectin-like) receptor 1
38 PCK2 202847_at phosphoenolpyruvate carboxykinase 2 (mitochondrial)
39 PLTP 200661_at phospholipid transfer protein
40 PPARG 208510_s_at peroxisome proliferator-activated receptor gamma
41 RXRB 209148_at retinoid × receptor, beta
42 RXRG 205954_at retinoid × receptor, gamma
43 SGMS1 212989_at sphingomyelin synthase 1
44 ST8SIA1 210073_at ST8 alpha-N-acetyl-neuraminide alpha-2,8-sialyltransferase 1
comparison indicator as the clustering variable. Compar-ison-specific z-scores were estimated as the relative deviates (mean expression/standard deviation of expres-sion) within each comparison group.
Other statistical analysis
To quantify and test differential gene expression, we
used two-tailed Student’s t tests for unpaired samples.
The clinical and statistical significance of the findings were presented as volcano plots. To account for multi-ple testing, we estimated the false discovery rates (q values) using the QVALITY software program [18]. Dis-criminant utility of each gene was assessed using non-parametric receiver operating characteristic (ROC) curve analysis. To group subjects based on their HADHA expression, we used a k-means clustering approach. All statistical analyses were conducted using Stata 10.0 soft-ware package (Stata Corp, College Station, Texas). We aimed for a type I error rate of 0.05 and a false discov-ery rate of 0.15.
Results
Differential expression analyses
Using the shortlisted set of 47 genes shown in Table 1, we first determined if these genes were differentially expressed in subjects with cancer (n = 18) and those without (n = 24). The volcano plot (Figure 1A) showed that seven of the 47 genes were significantly differentially expressed between these study groups. These genes
included five over-expressed genes (AQP7, PLTP, PCK2,
GCDH and ARSA) and two under-expressed genes
(ACSL5andHADHA). Of these,HADHAwas the most significant statistically. To account for the possible covar-iance among these gene expression values we conducted stepwise multivariate analyses using unconditional
logis-tic regression and observed that only two genes–HADHA
and ARSA–were retained in the final model (Figure 1B). This model explained 35% of inter-individual variability in breast cancer susceptibility with a predictive accuracy
of 86.8%. Interestingly, whenHADHAexpression was
removed from this model theARSAlost its statistical
sig-nificance but removal ofARSAdid not affect the
statisti-cal significance ofHADHA. This indicates thatHADHA
gene expression was the most important statistical pre-dictor of altered risk of breast cancer.
Does ER status influence the expression ofHADHA? To examine if this association could be influenced by the ER status, we conducted three sets of analyses. First,
we studied whether HADHA expression was different
based on the ER status. We found that the mean
HADHAwas not significantly differentially expressed by
ER status (meanHADHAexpression in subjects with ER
+ breast cancer = 6.00; in subjects with ER-breast cancer
= 5.90; p = 0.462). Second, we adjusted the standard
error estimates for the ER status using clustered logistic regression and observed that the statistical significance
for theHADHAgene expression further increased (p=
0.0001) while that of the ARSA gene decreased (p =
0.082) indicating that the association of HADHAwas
unlikely to have been influenced by the ER status. Third, we constructed volcano plots and conducted stepwise logistic regression analyses by comparing the ER + and ER-subjects separately with subjects without cancer as the reference group. We observed (Figure
1C-F) that HADHAgene expression was the only consistent
predictor across ER status but more so in the
ER-sub-jects. Indeed, the q value for theHADHAgene was 0.15
for the cancer versus no cancer comparison, 0.13 for the ER-versus no cancer comparison but 0.88 for the ER +
versus no cancer comparison. Two other genes (UCP3
and DGAT1) were retained in the final model of step-wise regression analyses when ER-subjects were com-pared to the no cancer group however this association was not observed when ER + subjects were compared to the same reference group.
Graded risk of breast cancer based onHADHAexpression
We next considered whether the association ofHADHA
gene expression with risk of breast cancer exhibited a threshold effect or whether it was a graded dose-response. For this, we used two approaches. First, we normalized the gene expression in the no cancer group
to 100%. We found (Figure 1G) that the HADHA
expression had fallen to 73% (95% CI 64%-83%) in jects with cancer; with a higher expression in ER + sub-jects (76% of the no cancer group, 95% CI 61%-91%) than in ER-subjects (70% of the no cancer group, 95% CI 55%-85%). Second, the k-means clusters (which
explained 95.9% of the variability inHADHAexpression)
clearly demonstrated a dose-response association (Figure
1H) such that more severe down-regulation of HADHA
was associated with a greater risk of being in the breast cancer group.
Meta-analyses of the differential expression ofHADHA Lastly, we examined the robustness of the differential
expression of HADHA by conducting meta-analysis of
Table 1 Genes included in the analyses(Continued)
46 UCP3 207349_s_at uncoupling protein 3 (mitochondrial, proton carrier)
G
H 100
90
80
70
60
50
EŽƌŵĂůŝnj
ĞĚƌ
ĂƟŽ;йͿ
No cancer ER+ ER- 0 50 100 150 200 NorŵaůŝnjeĚ raƟo ;йͿ 1.00
0.80
0.60
0.40
0.20
0.00
Pr
obability of c
ancer
-1.2 -0.8 -0.4 0 0.4 0.8 1.2 ACSL5
AQP7 ARSA
GCDH HADHA
PCK2 PLTP
3.0
2.5
2.0
1.5
1.0
0.5
0.0
-Log
10
P
Log10 ;&olĚ ĚiīerenceͿ Cancer vs No cancer
AUC = 0.8681 Predictors: HADHA p=0.004 ARSA p=0.010
R2 = 0.3501 1.00
0.75
0.50
0.25
0.00
^
en
Ɛ
i
Ɵǀ
ity
1-^ƉeciĮcity
0.00 0.25 0.50 0.75 1.00
A B
-1.2 -0.8 -0.4 0 0.4 0.8 1.2 ACSL5
AQP7 ARSA
DGAT1 EHHADHGCDH HADHA
PCK2
PLTP UCP3
Log10 ;&olĚ ĚiīerenceͿ ER- Cancer vs No cancer
AUC = 0.9583 Predictors: DGAT1 p=0.027 UCP3 p=0.044 HADHA p=0.012
R2 = 0.6290
1-^ƉeciĮcity
0.00 0.25 0.50 0.75 1.00 C
D
EHHADHAA 3.0
2.5
2.0
1.5
1.0
0.5
0.0
1.00
0.75
0.50
0.25
0.00
^
en
Ɛ
i
Ɵǀ
ity
-Log
10
P
-1.2 -0.8 -0.4 0 0.4 0.8 1.2 GCDH
HADHA UCP3
Log10 ;&olĚ ĚiīerenceͿ ER+ Cancer vs No cancer
AUC = 0.7315 Predictors: HADHA p=0.058
R2 = 0.1202
1-^ƉeciĮcity
0.00 0.25 0.50 0.75 1.00
E F
3.0
2.5
2.0
1.5
1.0
0.5
0.0
1.00
0.75
0.50
0.25
0.00
^
en
Ɛ
i
Ɵǀ
ity
-Log
10
P
10
9 7 6
5
[image:5.595.58.540.87.636.2]5
Figure 1Association of fatty acid and lipid metabolism related genes with the risk of breast cancer.(A-F) Association analyses. Panels
A,CandEshow the volcano plots for cancer with no cancer, ER-versus no cancer and ER + versus no cancer comparisons, respectively. These plots depict the biological significance (log-fold change) on the X-axis and the statistical significance (-log P) on the Y-axis. Significance values above 0.1 are indicated by the grey shaded area in the volcano plots. Panels,B,DandFshow the corresponding receiver-operating characteristic (ROC) curves for the final models from stepwise logistic regression analyses. The genes retained in the final model and their statistical significance is shown under the ROC curves, the variance explained by the model is shown as R2and the predictive accuracy is
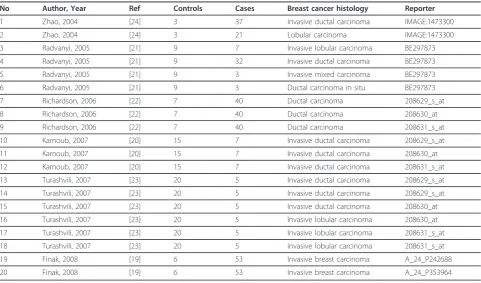
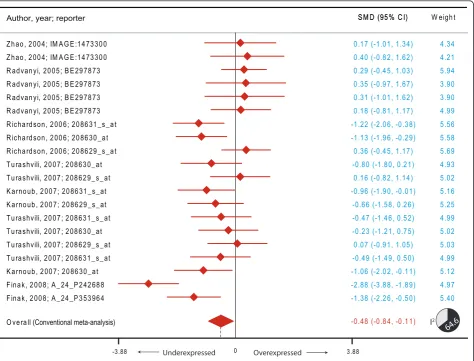
published microarray studies comparing cases of breast cancer with subjects without breast cancer. Querying the Oncomine database, we found six studies [19-24] that represented 20 different comparisons of breast can-cer patients with normal subjects (Table 2). The reasons for this larger number of comparisons were the different reporters used in the microarray experiments as well as the different subtypes of breast cancer reported by the studies.
We first observed that the mean expression levels for
HADHA probes (expressed as log transformed values) were widely different across the six studies (Zhao et al. [24]:-0.33, Radvanyi et al. [21]: 3.08, Richardson et al. [22]: 5.29, Karnoub et al. [20]: 2.97, Turashvili et al. [23]: 3.92 and Finak et al. [19]:-2.65). We therefore transformed these values into comparison-specific z-scores (mean expression for a comparison/standard deviation of expression for that comparison). Upon this z-transformation, all the studies had a mean z-score of 0 and a standard deviation of 1. We conducted
meta-ana-lyses on the HADHA expression z-scores. Using the
DerSimonian and Laird model, we observed (Figure 2) that the summary SMD (filled diamond in Figure 2)
was-0.48 (95% CI-0.84–0.11). Considering the statistical
properties of SMD it is possible to transform this into probability [25]. This transformation indicated that there was an average 18.4% reduction in expression of
HADHA(95% CI 4.5%-30.0%) in cases of breast cancer
as compared to normal subjects. Interestingly, this
sig-nificant reduction in the expression of HADHA was
observed in spite of the high degree of heterogeneity (I2
64.6,p< 0.001, pie-chart in Figure 2) between the
com-parisons due to different cancer subtypes, reporters used in various studies and other study characteristics.
We observed that the invasive ductal carcinoma (p=
0.046) and unspecified invasive breast carcinoma (p=
0.005) showed a significant under-expression ofHADHA
gene but lobular carcinoma (p= 0.781), invasive lobular
carcinoma (p= 0.780) or invasive mixed carcinoma (p=
0.717) did not show a significant alteration ofHADHA
gene expression. Alternatively, we conducted the IPD meta-analysis using logistic regression analyses. We found that the odds ratio for breast cancer was 0.74 (95% CI 0.60-0.92) after clustered analyses. Thus, there was a 26% reduction in the risk of breast cancer per unit increase in z-scores. These values show a striking resemblance with the findings observed in the Graham et al. dataset and demonstrate the replicability of our findings.
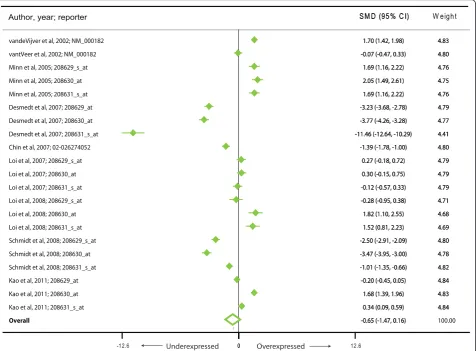
We also investigated if HADHAexpression was
asso-ciated with an altered risk of metastasis and recurrence. For risk of a metastatic event we found nine studies [26-33] representing 430 metastatic events and 1104 metastasis-free cancers (Figure 3). Subjects who devel-oped a metastatic event during follow-up had a reduced
HADHA expression (summary effect size-0.65, 95%
CI-Table 2 Comparisons included in the meta-analysis of differentialHADHAexpression
No Author, Year Ref Controls Cases Breast cancer histology Reporter
1 Zhao, 2004 [24] 3 37 Invasive ductal carcinoma IMAGE:1473300
2 Zhao, 2004 [24] 3 21 Lobular carcinoma IMAGE:1473300
3 Radvanyi, 2005 [21] 9 7 Invasive lobular carcinoma BE297873
4 Radvanyi, 2005 [21] 9 32 Invasive ductal carcinoma BE297873
5 Radvanyi, 2005 [21] 9 3 Invasive mixed carcinoma BE297873
6 Radvanyi, 2005 [21] 9 3 Ductal carcinoma in situ BE297873
7 Richardson, 2006 [22] 7 40 Ductal carcinoma 208629_s_at
8 Richardson, 2006 [22] 7 40 Ductal carcinoma 208630_at
9 Richardson, 2006 [22] 7 40 Ductal carcinoma 208631_s_at
10 Karnoub, 2007 [20] 15 7 Invasive ductal carcinoma 208629_s_at
11 Karnoub, 2007 [20] 15 7 Invasive ductal carcinoma 208630_at
12 Karnoub, 2007 [20] 15 7 Invasive ductal carcinoma 208631_s_at
13 Turashvili, 2007 [23] 20 5 Invasive ductal carcinoma 208629_s_at
14 Turashvili, 2007 [23] 20 5 Invasive ductal carcinoma 208629_s_at
15 Turashvili, 2007 [23] 20 5 Invasive ductal carcinoma 208630_at
16 Turashvili, 2007 [23] 20 5 Invasive lobular carcinoma 208630_at
17 Turashvili, 2007 [23] 20 5 Invasive lobular carcinoma 208631_s_at
18 Turashvili, 2007 [23] 20 5 Invasive lobular carcinoma 208631_s_at
19 Finak, 2008 [19] 6 53 Invasive breast carcinoma A_24_P242688
[image:6.595.57.539.450.733.2]1.47-0.16) but this was not statistically significant (p= 0.117). Also, there was a very high degree of
between-study heterogeneity (I2 98.8%). Similarly, for the
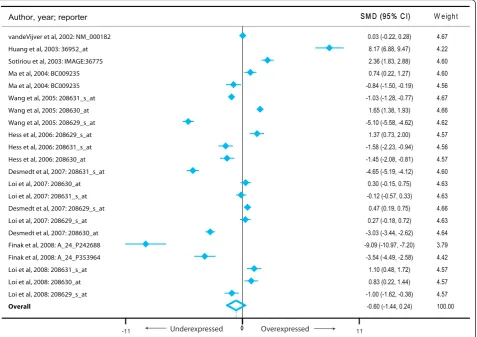
out-come of the risk of recurrence (Figure 4), we found that there were 10 studies [19,27,29,30,32,34-38] representing 484 recurring and 890 non-recurring breast cancers. Meta-analysis demonstrated that although there was a
consistent decrease in average HADHAexpression in
patients with a recurring form of breast cancer (sum-mary effect size-0.60, 95% CI-1.44-0.24), the finding was
neither statistically significant (p= 0.160) nor
homoge-neous (I2 = 98.7%) across studies.
Discussion
Our analyses of the microarray dataset based on the Graham et al. [5] study demonstrated a consistent,
strong and significant association of theHADHA gene
expression in histologically normal epithelium with the
likelihood of breast cancer. Moreover, this observation was further substantiated by the meta-analysis of other published studies. Only one study has previously reported differential association of this gene with regard to BRCA1 positive, BRCA2 positive and sporadic malig-nant tumors of the breast [39]. Our results further
sup-port the putative involvement of HADHA in breast
cancer susceptibility.
Biological plausibility
Biological significance of our novel observations should be considered in the light of the following facts. First, the
HADHAgene (chromosomal location 2p23) codes for the four alpha chains in the 8-meric mitochondrial trifunc-tional protein (TFP) [40]. This enzyme performs three
cardinal functions in theb-oxidation of long chain fatty
acids by catalyzing the activities of the 2-enoyl-CoA hydratase (ECH), L-3-hydroxyacyl-CoA dehydrogenase O verall (Conventional meta-analysis)
Turashvili, 2007; 208629_s_at
Finak, 2008; A_24_P353964 Turashvili, 2007; 208631_s_at
Finak, 2008; A_24_P242688 R advanyi, 2005; B E297873
Turashvili, 2007; 208630_at R ichardson, 2006; 208631_s_at R advanyi, 2005; B E297873
Turashvili, 2007; 208629_s_at Author, year; reporter
Karnoub, 2007; 208631_s_at R advanyi, 2005; B E297873
Turashvili, 2007; 208630_at
Karnoub, 2007; 208629_s_at Zhao, 2004; IM AG E:1473300 Zhao, 2004; IM AG E:1473300
R ichardson, 2006; 208630_at
Karnoub, 2007; 208630_at Turashvili, 2007; 208631_s_at R advanyi, 2005; B E297873
R ichardson, 2006; 208629_s_at
-0.48 (-0.84, -0.11)
0.07 (-0.91, 1.05)
-1.38 (-2.26, -0.50) -0.49 (-1.49, 0.50)
-2.88 (-3.88, -1.89) 0.29 (-0.45, 1.03)
-0.23 (-1.21, 0.75) -1.22 (-2.06, -0.38) 0.18 (-0.81, 1.17)
0.16 (-0.82, 1.14) SM D (95% C I)
-0.96 (-1.90, -0.01) 0.35 (-0.97, 1.67)
-0.80 (-1.80, 0.21)
-0.66 (-1.58, 0.26) 0.17 (-1.01, 1.34) 0.40 (-0.82, 1.62)
-1.13 (-1.96, -0.29)
-1.06 (-2.02, -0.11) -0.47 (-1.46, 0.52) 0.31 (-1.01, 1.62)
0.36 (-0.45, 1.17)
5.03
5.40 4.99
4.97 5.94
5.02 5.56 4.99
5.02 W eight
5.16 3.90
4.93
5.25 4.34 4.21
5.58
5.12 4.99 3.90
5.69 SM D (95% C I)
0
-3.88 3.88
I2
64.6
[image:7.595.64.539.89.450.2]Underexpressed Overexpressed
(HACD) and 3-ketoacyl-CoA thiolase (KACT). Of these three, the first two enzymes (ECH and HACD) are speci-fically catalyzed by the alpha chains of TFP. Severe defi-ciency (< 50% of normal activity) of TFP is known to be associated with life-threatening manifestation of the long chain 3-hydroxyacyl-CoA dehydrogenase deficiency [41]. However, the effects of a milder deficiency of TFP (for example, activity between 50%-80% of the normal) are currently unknown. Our results indicate that breast
can-cer patients had 18-30% decreased expression ofHADHA
gene. We therefore hypothesize that there may be a com-promised metabolism of long chain fatty acids in breast cancer due to a relative deficiency of the alpha chains of TFP. In this context, it is noteworthy that a recent large genome-wide association study [42] found a strong asso-ciation of breast cancer with a polymorphism in the gene encoding enoyl CoA hydratase domain containing 1 (ECHDC1), which also partakes in the integrity of the TFP.
Second, the efficacy of b-oxidation of n-3 and n-6
long chain fatty acids can be tissue- and location- speci-fic. For example, in rat livers it has been shown that the n-3/n-6 ratio influences peroxisomal but not
mitochon-drialb-oxidation [43]. In contrast, mitochondrialb
-oxi-dation of long chain fatty acid has been implicated in breast cancer pathogenesis [42]. We also could not demonstrate a significant association of the genes
involved in the PPAR-gpathway reinforcing the
possibi-lity that mitochondrial rather than peroxisomalb
-oxida-tion of long chain fatty acids may be more critical in
breast carcinogenesis. Third, HADHA occupies an
important position in the network of genes that have been implicated in autophagy and apoptosis [44]. Finally, triangulation of the following facts lends additional cre-dence to our observations: i) intact epithelium of mam-mary glands has the ability to act as stem cells for carcinogenesis [2]; ii) n-3 long chain fatty acids have the
ability to target such stem cells [45]; and iii)HADHAis
Author, year; reporter SM D (95% C I)SM D (95% C I) W eight
Overall
Kao et al, 2011; 208629_at Schmidt et al, 2008; 208630_at
Schmidt et al, 2008; 208631_s_at Minn et al, 2005; 208630_at Minn et al, 2005; 208629_s_at
Loi et al, 2007; 208629_s_at
Loi et al, 2008; 208631_s_at Loi et al, 2008; 208630_at Desmedt et al, 2007; 208629_at
Schmidt et al, 2008; 208629_s_at Loi et al, 2007; 208630_at vandeVijver et al, 2002; NM_000182
Desmedt et al, 2007; 208630_at
Kao et al, 2011; 208630_at Desmedt et al, 2007; 208631_s_at
Kao et al, 2011; 208631_s_at Loi et al, 2008; 208629_s_at Loi et al, 2007; 208631_s_at Minn et al, 2005; 208631_s_at vantVeer et al, 2002; NM_000182
Chin et al, 2007; 02-026274052
-0.65 (-1.47, 0.16) -0.20 (-0.45, 0.05) -3.47 (-3.95, -3.00)
-1.01 (-1.35, -0.66) 2.05 (1.49, 2.61) 1.69 (1.16, 2.22)
0.27 (-0.18, 0.72)
1.52 (0.81, 2.23) 1.82 (1.10, 2.55) -3.23 (-3.68, -2.78)
-2.50 (-2.91, -2.09) 0.30 (-0.15, 0.75) 1.70 (1.42, 1.98)
-3.77 (-4.26, -3.28)
1.68 (1.39, 1.96) -11.46 (-12.64, -10.29)
0.34 (0.09, 0.59) -0.28 (-0.95, 0.38) -0.12 (-0.57, 0.33) 1.69 (1.16, 2.22) -0.07 (-0.47, 0.33)
-1.39 (-1.78, -1.00)
100.00 4.84 4.78
4.82 4.75 4.76
4.79
4.69 4.68 4.79
4.80 4.79 4.83
4.77
4.83 4.41
4.84 4.71 4.79 4.76 4.80
4.80
-0.65 (-1.47, 0.16) -0.20 (-0.45, 0.05) -3.47 (-3.95, -3.00)
-1.01 (-1.35, -0.66) 2.05 (1.49, 2.61) 1.69 (1.16, 2.22)
0.27 (-0.18, 0.72)
1.52 (0.81, 2.23) 1.82 (1.10, 2.55) -3.23 (-3.68, -2.78)
-2.50 (-2.91, -2.09) 0.30 (-0.15, 0.75) 1.70 (1.42, 1.98)
-3.77 (-4.26, -3.28)
1.68 (1.39, 1.96) -11.46 (-12.64, -10.29)
0.34 (0.09, 0.59) -0.28 (-0.95, 0.38) -0.12 (-0.57, 0.33) 1.69 (1.16, 2.22) -0.07 (-0.47, 0.33)
-1.39 (-1.78, -1.00)
4.84 4.78
4.82 4.75 4.76
4.79
4.69 4.68 4.79
4.80 4.79 4.83
4.77
4.83 4.41
4.84 4.71 4.79 4.76 4.80
4.80
0
[image:8.595.62.539.90.441.2]-12.6 Underexpressed Overexpressed0 12.6
involved in the mitochondrialb-oxidation of long chain fatty acids. Together these observations from published literature strongly support the biological plausibility of
our finding thatHADHA is differentially expressed in
subjects with and without breast cancer.
Limitations
Our study has all the limitations implicit in any micro-array association study and meta-analyses. In addition, there are three more limitations. First, although there is a strong circumstantial evidence that favors an inference ofHADHAexpression-breast cancer association, it must be realized that robust functional studies are required before this association can be conclusively claimed. Our study does not have a component of functional assays that can help put these results in a biological perspec-tive. Second, due to limitations imposed by the microar-ray platform used in the primary study, we could not evaluate the potential association of a large number of additional lipid and fat metabolism related genes with
the risk of breast cancer. Inclusion of those genes may
not only affect the q values associated with HADHAbut
also may provide a more comprehensive understanding of the role of fatty acids in breast cancer. Thirdly, although consistent, the observed differential expression ofHADHAwith cancer progression (as reflected by risk of metastasis and recurrence) is statistically inconclusive.
Conclusions
Our study has three important implications–biological,
methodological and epidemiologic. Biologically, our study has identified a novel target gene that corrobo-rates the existing knowledge about the role of long chain fatty acids in breast cancer and provides interest-ing directions for further research in this area. Also, our findings put the focus on the putative functional aspects of mitochondria and TFP in breast carcinogenesis.
From a methodological standpoint, our study shows that high dimensionality of omics-type datasets is fraught with the vexing problem of finding strong
Author, year; reporter SM D (95% C I)SM D (95% C I) W eight
00
Underexpressed Overexpressed
Overall
Ma et al, 2004: BC009235 Huang et al, 2003: 36952_at
Hess et al, 2006: 208629_s_at Wang et al, 2005: 208629_s_at
Loi et al, 2008: 208630_at Finak et al, 2008: A_24_P353964 Desmedt et al, 2007: 208630_at Loi et al, 2007: 208629_s_at Ma et al, 2004: BC009235
Wang et al, 2005: 208631_s_at
Desmedt et al, 2007: 208629_s_at Hess et al, 2006: 208631_s_at
Hess et al, 2006: 208630_at
Loi et al, 2008: 208631_s_at Finak et al, 2008: A_24_P242688 Wang et al, 2005: 208630_at
Loi et al, 2007: 208630_at
Loi et al, 2008: 208629_s_at Desmedt et al, 2007: 208631_s_at Sotiriou et al, 2003: IMAGE:36775
Loi et al, 2007: 208631_s_at vandeVijver et al, 2002: NM_000182
-0.60 (-1.44, 0.24) -0.84 (-1.50, -0.19) 8.17 (6.88, 9.47)
1.37 (0.73, 2.00) -5.10 (-5.58, -4.62)
0.83 (0.22, 1.44) -3.54 (-4.49, -2.58) -3.03 (-3.44, -2.62) 0.27 (-0.18, 0.72) 0.74 (0.22, 1.27)
-1.03 (-1.28, -0.77)
0.47 (0.19, 0.75) -1.58 (-2.23, -0.94) -1.45 (-2.08, -0.81)
1.10 (0.48, 1.72) -9.09 (-10.97, -7.20)
1.65 (1.38, 1.93)
0.30 (-0.15, 0.75)
-1.00 (-1.62, -0.38) -4.65 (-5.19, -4.12) 2.36 (1.83, 2.88)
-0.12 (-0.57, 0.33) 0.03 (-0.22, 0.28)
100.00 4.56 4.22
4.57 4.62
4.57 4.42 4.64 4.63 4.60
4.67
4.66 4.56 4.57
4.57 3.79 4.66
4.63
4.57 4.60 4.60
4.63 4.67
[image:9.595.62.540.90.427.2]-11 11
associations at the cost of potentially missing weaker but biologically meaningful associations. Literature addres-sing the issue of multiple comparisons in large volume datasets focuses primarily on the possibility of finding false positive associations [46]. However, there exists a demonstrable probability that such high-volume datasets may also falsely mask true associations. It is likely that the Graham et al. study did not report a significant
association of HADHAwith the risk of breast cancer
due to a large number of multiple comparisons. The
fact that we discovered an association ofHADHAwith
breast cancer shows that microarray dataset analysis (as well as analyses of other large datasets like genome-wide association studies, proteomics data or metabolomics datasets) may benefit by using targeted subset analyses based on functional annotation and conceptual under-standing of the molecular mechanisms in disease. Finally, in an epidemiological context, our study shows that error in long chain fatty acid metabolism in the breast tissue might herald the onset of carcinogenesis and thus can be helpful for the primordial prevention of breast cancer.
Additional material
Additional file 1: Table S1. Excel table containing detailed annotation of the 136 genes related to fat and lipid metabolism that were primarily selected for analyses.
Additional file 2: Table S2. Excel table containing detailed annotation of the 47 genes included in this study related to fat and lipid metabolism that were primarily selected for analyses.
Abbreviations
ER: Estrogen receptor; n-3 PUFA: Omega–3 polyunsaturated fatty acids; n-6 PUFA: Omega–6 polyunsaturated fatty acids; SFA: Saturated fatty acids; SMD: Standardized mean difference; CI: Confidence interval.
Acknowledgements
We sincerely acknowledge and deeply appreciate the Editorial assistance provided by Cindy Tumiel, Department of Genetics, Texas Biomedical Research Institute, San Antonio, Texas, USA.
Author details
1Lata Medical Research Foundation, Nagpur, India.2Texas Biomedical
Research Institute, 7620 NW Loop 410, San Antonio, Texas 78227-5301, USA.
Authors’contributions
MM and HK conceptualized the study, collected data, conducted analyses and wrote the manuscript. Both authors have read and approve the manuscript.
Competing interests
The authors declare that they have no competing interests.
Received: 20 September 2011 Accepted: 12 January 2012 Published: 12 January 2012
References
1. Bonovas S, Tsantes A, Drosos T, Sitaras NM:Cancer chemoprevention: a summary of the current evidence.Anticancer Res2008,28(3B):1857-1866.
2. Moriya T, Kanomata N, Kozuka Y, Hirakawa H, Kimijima I, Kimura M, Watanabe M, Sasano H, Ishida T, Ohuchi N,et al:Molecular morphological approach to the pathological study of development and advancement of human breast cancer.Med Mol Morphol2010,43(2):67-73.
3. Martins FC, Botelho MF, Cabrita AM, de Oliveira CF:Influence of normal mammary epithelium on breast cancer progression: the protective role of early pregnancy.Tumori2010,96(6):999-1003.
4. Cazzaniga M, Decensi A, Bonanni B, Luini A, Gentilini O:Biomarkers for risk assessment and prevention of breast cancer.Curr Cancer Drug Targets
2009,9(4):482-499.
5. Graham K, Ge X, de Las Morenas A, Tripathi A, Rosenberg CL:Gene expression profiles of estrogen positive and estrogen receptor-negative breast cancers are detectable in histologically normal breast epithelium.Clin Cancer Res2010,17(2):236-246.
6. Pauwels EK, Kairemo K:Fatty acid facts, part II: role in the prevention of carcinogenesis, or, more fish on the dish?Drug News Perspect2008, 21(9):504-510.
7. Gillet L, Roger S, Bougnoux P, Le Guennec JY, Besson P:Beneficial effects of omega-3 long-chain fatty acids in breast cancer and cardiovascular diseases: voltage-gated sodium channels as a common feature?
Biochimie2010,93(1):4-6.
8. Terry PD, Terry JB, Rohan TE:Long-chain (n-3) fatty acid intake and risk of cancers of the breast and the prostate: recent epidemiological studies, biological mechanisms, and directions for future research.J Nutr2004, 134(12 Suppl):3412S-3420S.
9. Wall R, Ross RP, Fitzgerald GF, Stanton C:Fatty acids from fish: the anti-inflammatory potential of long-chain omega-3 fatty acids.Nutr Rev2010, 68(5):280-289.
10. Wendel M, Heller AR:Anticancer actions of omega-3 fatty acids-current state and future perspectives.Anticancer Agents Med Chem2009, 9(4):457-470.
11. Escrich E, Moral R, Grau L, Costa I, Solanas M:Molecular mechanisms of the effects of olive oil and other dietary lipids on cancer.Mol Nutr Food Res2007,51(10):1279-1292.
12. Escrich E, Solanas M, Moral R, Escrich R:Modulatory effects and molecular mechanisms of olive oil and other dietary lipids in breast cancer.Curr Pharm Des2010,17(8):813-830.
13. Chalmers TC, Berrier J, Hewitt P, Berlin J, Reitman D, Nagalingam R, Sacks H: Meta-analysis of randomized controlled trials as a method of estimating rare complications of non-steroidal anti-inflammatory drug therapy.
Aliment Pharmacol Ther1988,2(Suppl 1):9-26.
14. DerSimonian R, Laird N:Meta-analysis in clinical trials.Control Clin Trials
1986,7(3):177-188.
15. Hozo SP, Djulbegovic B, Hozo I:Estimating the mean and variance from the median, range, and the size of a sample.BMC Med Res Methodol
2005,5:13.
16. Koopman L, van der Heijden GJ, Grobbee DE, Rovers MM:Comparison of methods of handling missing data in individual patient data meta-analyses: an empirical example on antibiotics in children with acute otitis media.Am J Epidemiol2008,167(5):540-545.
17. Hedlund C, Rapoport AM, Dodick DW, Goadsby PJ:Zolmitriptan nasal spray in the acute treatment of cluster headache: a meta-analysis of two studies.Headache2009,49(9):1315-1323.
18. Kall L, Storey JD, Noble WS:QVALITY: non-parametric estimation of q-values and posterior error probabilities.Bioinformatics2009,25(7):964-966. 19. Finak G, Bertos N, Pepin F, Sadekova S, Souleimanova M, Zhao H, Chen H,
Omeroglu G, Meterissian S, Omeroglu A,et al:Stromal gene expression predicts clinical outcome in breast cancer.Nat Med2008,14(5):518-527. 20. Karnoub AE, Dash AB, Vo AP, Sullivan A, Brooks MW, Bell GW,
Richardson AL, Polyak K, Tubo R, Weinberg RA:Mesenchymal stem cells within tumour stroma promote breast cancer metastasis.Nature2007, 449(7162):557-563.
21. Radvanyi L, Singh-Sandhu D, Gallichan S, Lovitt C, Pedyczak A, Mallo G, Gish K, Kwok K, Hanna W, Zubovits J,et al:The gene associated with trichorhinophalangeal syndrome in humans is overexpressed in breast cancer.Proc Natl Acad Sci USA2005,102(31):11005-11010.
22. Richardson AL, Wang ZC, De Nicolo A, Lu X, Brown M, Miron A, Liao X, Iglehart JD, Livingston DM, Ganesan S:X chromosomal abnormalities in basal-like human breast cancer.Cancer Cell2006,9(2):121-132. 23. Turashvili G, Bouchal J, Baumforth K, Wei W, Dziechciarkova M, Ehrmann J,
differentiation of lobular and ductal invasive breast carcinomas by laser microdissection and microarray analysis.BMC Cancer2007,7:55. 24. Zhao H, Langerod A, Ji Y, Nowels KW, Nesland JM, Tibshirani R, Bukholm IK,
Karesen R, Botstein D, Borresen-Dale AL,et al:Different gene expression patterns in invasive lobular and ductal carcinomas of the breast.Mol Biol Cell2004,15(6):2523-2536.
25. Liu T, Li L, Korantzopoulos P, Goudevenos JA, Li G:Meta-analysis of association between C-reactive protein and immediate success of electrical cardioversion in persistent atrial fibrillation.Am J Cardiol2008, 101(12):1749-1752.
26. Chin SF, Wang Y, Thorne NP, Teschendorff AE, Pinder SE, Vias M, Naderi A, Roberts I, Barbosa-Morais NL, Garcia MJ,et al:Using array-comparative genomic hybridization to define molecular portraits of primary breast cancers.Oncogene2007,26(13):1959-1970.
27. Desmedt C, Piette F, Loi S, Wang Y, Lallemand F, Haibe-Kains B, Viale G, Delorenzi M, Zhang Y, d’Assignies MS,et al:Strong time dependence of the 76-gene prognostic signature for node-negative breast cancer patients in the TRANSBIG multicenter independent validation series.Clin Cancer Res2007,13(11):3207-3214.
28. Kao KJ, Chang KM, Hsu HC, Huang AT:Correlation of microarray-based breast cancer molecular subtypes and clinical outcomes: implications for treatment optimization.BMC Cancer2011,11:143.
29. Loi S, Haibe-Kains B, Desmedt C, Lallemand F, Tutt AM, Gillet C, Ellis P, Harris A, Bergh J, Foekens JA,et al:Definition of clinically distinct molecular subtypes in estrogen receptor-positive breast carcinomas through genomic grade.J Clin Oncol: J Am Soc Clin Oncol2007, 25(10):1239-1246.
30. Loi S, Haibe-Kains B, Desmedt C, Wirapati P, Lallemand F, Tutt AM, Gillet C, Ellis P, Ryder K, Reid JF,et al:Predicting prognosis using molecular profiling in estrogen receptor-positive breast cancer treated with tamoxifen.BMC Genomics2008,9:239.
31. Minn AJ, Gupta GP, Siegel PM, Bos PD, Shu W, Giri DD, Viale A, Olshen AB, Gerald WL, Massague J:Genes that mediate breast cancer metastasis to lung.Nature2005,436(7050):518-524.
32. van de Vijver MJ, He YD, van’t Veer LJ, Dai H, Hart AA, Voskuil DW, Schreiber GJ, Peterse JL, Roberts C, Marton MJ,et al:A gene-expression signature as a predictor of survival in breast cancer.N Engl J Med2002, 347(25):1999-2009.
33. van’t Veer LJ, Dai H, van de Vijver MJ, He YD, Hart AA, Mao M, Peterse HL, van der Kooy K, Marton MJ, Witteveen AT,et al:Gene expression profiling predicts clinical outcome of breast cancer.Nature2002,41(6871):530-536. 34. Hess KR, Anderson K, Symmans WF, Valero V, Ibrahim N, Mejia JA, Booser D, Theriault RL, Buzdar AU, Dempsey PJ,et al:Pharmacogenomic predictor of sensitivity to preoperative chemotherapy with paclitaxel and
fluorouracil, doxorubicin, and cyclophosphamide in breast cancer.J Clin Oncol: J Am Soc Clin Oncol2006,24(26):4236-4244.
35. Huang E, Cheng SH, Dressman H, Pittman J, Tsou MH, Horng CF, Bild A, Iversen ES, Liao M, Chen CM,et al:Gene expression predictors of breast cancer outcomes.Lancet2003,361(9369):1590-1596.
36. Ma XJ, Wang Z, Ryan PD, Isakoff SJ, Barmettler A, Fuller A, Muir B, Mohapatra G, Salunga R, Tuggle JT,et al:A two-gene expression ratio predicts clinical outcome in breast cancer patients treated with tamoxifen.Cancer Cell2004,5(6):607-616.
37. Sotiriou C, Neo SY, McShane LM, Korn EL, Long PM, Jazaeri A, Martiat P, Fox SB, Harris AL, Liu ET:Breast cancer classification and prognosis based on gene expression profiles from a population-based study.Proc Natl Acad Sci USA2003,100(18):10393-10398.
38. Wang Y, Klijn JG, Zhang Y, Sieuwerts AM, Look MP, Yang F, Talantov D, Timmermans M, Meijer-van Gelder ME, Yu J,et al:Gene-expression profiles to predict distant metastasis of lymph-node-negative primary breast cancer.Lancet2005,365(9460):671-679.
39. Hedenfalk I, Duggan D, Chen Y, Radmacher M, Bittner M, Simon R, Meltzer P, Gusterson B, Esteller M, Kallioniemi OP,et al:Gene-expression profiles in hereditary breast cancer.N Engl J Med2001,344(8):539-548. 40. Fould B, Garlatti V, Neumann E, Fenel D, Gaboriaud C, Arlaud GJ:Structural
and functional characterization of the recombinant human
mitochondrial trifunctional protein.Biochemistry2010,49(39):8608-8617. 41. Spiekerkoetter U:Mitochondrial fatty acid oxidation disorders: clinical
presentation of long-chain fatty acid oxidation defects before and after newborn screening.J Inherit Metab Dis2010,33(5):527-532.
42. Gold B, Kirchhoff T, Stefanov S, Lautenberger J, Viale A, Garber J, Friedman E, Narod S, Olshen AB, Gregersen P,et al:Genome-wide association study provides evidence for a breast cancer risk locus at 6q22.33.Proc Natl Acad Sci USA2008,105(11):4340-4345.
43. Takeuchi H, Kojima K, Sekine S, Murano Y, Aoyama T:Effect of dietary n-6/ n-3 ratio on liver n-6/n-3 ratio and peroxisomal beta-oxidation activity in rats.J Oleo Sci2008,57(12):649-657.
44. Behrends C, Sowa ME, Gygi SP, Harper JW:Network organization of the human autophagy system.Nature2010,466(7302):68-76.
45. Erickson KL, Hubbard NE:Fatty acids and breast cancer: the role of stem cells.Prostaglandins Leukot Essent Fatty Acids2010,82(4-6):237-241. 46. Delongchamp RR, Bowyer JF, Chen JJ, Kodell RL:Multiple-testing strategy
for analyzing cDNA array data on gene expression.Biometrics2004, 60(3):774-782.
doi:10.1186/1756-0500-5-25
Cite this article as:Mamtani and Kulkarni:Association ofHADHA expression with the risk of breast cancer: targeted subset analysis and meta-analysis of microarray data.BMC Research Notes20125:25.
Submit your next manuscript to BioMed Central and take full advantage of:
• Convenient online submission
• Thorough peer review
• No space constraints or color figure charges
• Immediate publication on acceptance
• Inclusion in PubMed, CAS, Scopus and Google Scholar
• Research which is freely available for redistribution