R E S E A R C H A R T I C L E
Open Access
Predicting mortality of residents at admission to
nursing home: A longitudinal cohort study
Ingibjörg Hjaltadóttir
1,2,3*, Ingalill Rahm Hallberg
1,4, Anna Kristensson Ekwall
1and Per Nyberg
1Abstract
Background:An increasing numbers of deaths occur in nursing homes. Knowledge of the course of development over the years in death rates and predictors of mortality is important for officials responsible for organizing care to be able to ensure that staff is knowledgeable in the areas of care needed. The aim of this study was to investigate the time from residents’ admission to Icelandic nursing homes to death and the predictive power of demographic variables, health status (health stability, pain, depression and cognitive performance) and functional profile (ADL and social engagement) for 3-year mortality in yearly cohorts from 1996-2006.
Methods:The samples consisted of residents (N = 2206) admitted to nursing homes in Iceland in 1996-2006, who were assessed once at baseline with a Minimum Data Set (MDS) within 90 days of their admittance to the nursing home. The follow-up time for survival of each cohort was 36 months from admission. Based on Kaplan-Meier analysis (log rank test) and non-parametric correlation analyses (Spearman’s rho), variables associated with survival time with a p-value < 0.05 were entered into a multivariate Cox regression model.
Results:The median survival time was 31 months, and no significant difference was detected in the mortality rate between cohorts. Age, gender (HR 1.52), place admitted from (HR 1.27), ADL functioning (HR 1.33-1.80), health stability (HR 1.61-16.12) and ability to engage in social activities (HR 1.51-1.65) were significant predictors of mortality. A total of 28.8% of residents died within a year, 43.4% within two years and 53.1% of the residents died within 3 years.
Conclusion:It is noteworthy that despite financial constraints, the mortality rate did not change over the study period. Health stability was a strong predictor of mortality, in addition to ADL performance. Considering these variables is thus valuable when deciding on the type of service an elderly person needs. The mortality rate showed that more than 50% died within 3 years, and almost a third of the residents may have needed palliative care within a year of admission. Considering the short survival time from admission, it seems relevant that staff is trained in providing palliative care as much as restorative care.
Background
Knowledge about predictors of mortality of nursing home residents is sparse, in particular regarding whether the survival time has been shortening in recent decades due to more restrictive admission criteria. Additionally, knowledge about predictors of mortality is needed to provide appropriate care and ensure that the staff are knowledgeable in the areas of care that are most needed. Officials organizing care and services for older people also need to be aware of shifts in the need for services
that may take place over time due to changes in, for instance, financial resources.
Several factors have been found to predict mortality at admission to a nursing home. Three studies investigating admission status have all reported cancer or history of malignancy to be a predictor of mortality (UK; N = 308) [1] (US; n = 100,669)[2] (UK; N = 1557) [3]. Predictors reported by two studies have been related to physical dis-ability [1,2], problems with eating [2,3] and use of medi-cation [1,3]. Other predictors reported have been infection at admittance [1], pressure ulcer, bowel inconti-nence [2], age, male gender, sleep disturbance, where admitted from, and respiratory disease [3]. The mean sur-vival time for newly admitted nursing home residents * Correspondence: ingihj@landspitali.is
1Department of Health Sciences, Lund University, Lund, Sweden
Full list of author information is available at the end of the article
differs and has been reported as 76 days for men and 134 days for women [1] or 5.9 years for both genders [3].
Study design, time of assessment and the delay in assessment from time of admittance are most likely factors that affect the outcome. For instance, predictors of mortality at admission in relation to predictors of mortality among residents living in a nursing home for more than one year seemingly differ [2]. There is no consensus on how to assess for predictors of mortality and therefore comparison may be difficult. Thus, there is not yet a coherent body of knowledge about factors predicting mortality at admission with sufficiently clear implications for planning and nursing care. The current knowledge base has weaknesses both in terms of the low number of studies, the methods used to identify predictors, and whether there have been changes in mortality over time.
Death may not be openly discussed in nursing homes, even though an increasing number of deaths occur there [4]. However, a short survival time underlines the need for knowledge of palliative care in nursing homes [5]. It has been pointed out that the framework of pal-liative care may be appropriate not only for older people at the very end of life but also for those receiving long-term care [6]. Research has shown a lack of symptom treatment and access to palliative care for dying resi-dents, resulting in their suffering [7,8]. Furthermore, researchers have pointed out several internal factors that are challenging when delivering palliative care in nursing homes. These include the staffs’ knowledge on how to provide palliative care, their attitude toward palliative care, staffing levels, lack of physician support, lack of privacy, family expectations for care, and the hospitaliza-tion of residents [9].
The official policy in Iceland is to enable older people to stay at home as long as possible [10]. The long term care available is home care, including both domestic help and nursing care. Those needing around-the-clock care either go first into residential care or directly to a nursing home, depending on their needs. A percentage of the resident’s pension goes toward their upkeep; otherwise the service is government funded [10]. A short standardized preadmission assessment is used to prioritize who is to be admitted into a residential or nursing home [11].
In Iceland there are 62 nursing homes, with room for about 2500 residents or about 8% of those in Iceland aged 67 and older (retirement age in Iceland) [10,12]. A nursing home in Iceland is an institution or ward where nursing care is provided to the residents 24 hours a day. The care is delivered by registered nurses, licensed prac-tical nurses and nursing assistants. On average 4.1-5.0 nursing hours are provided per patient per 24-hour per-iod, and the nurse-patient ratio is 0.88. Registered
nurses constitute 18% of the staff, licensed practical nurses 20%, other professionals 1%, and nursing assis-tants 61% [10]. Assistance with the activities of daily living (ADL), moving about and recreation is provided at the nursing home. A physician visits the nursing home 3-5 times a week as well as being on call around the clock for emergencies. Physiotherapy is provided at most nursing homes, and some also provide occupa-tional therapy. End of life care is provided in the nursing homes and most of the residents die there; as few as 20% of residents move to a hospital before death [13]. A few nursing homes provide respite care or rehabilita-tion and nursing homes also provide care for people younger than 67 years old [10]. An earlier analysis of the sample used in this study showed that 52.7% to 67.1% of the cohorts admitted to Icelandic nursing homes in the period 1996-2006 were women, and the mean age was from 80.1 to 82.8 years. Those with pain every day ran-ged from 29.6% to 40.9%, and 16.2% to 31% had signs of depression. Bladder incontinence ranged from 17.8% to 41.6% and bowel incontinence from 6.5% to 20%. Resi-dents having short-term memory problems varied from 49.2% to 75.7%, and those needing extensive assistance or who were totally dependent on help in getting to the toilet ranged from 20.3% to 54.8% [14].
Knowledge of factors influencing mortality, the aver-age length of survival and residents’ health status at admission are critical to managers and health officials involved in nursing home care. The staff’s knowledge has also been shown to affect resident’s quality of care [15]. The main goal of the nursing care of residents may not be to prolong their life [16] but, rather, to add qual-ity to their lives. The present study will contribute knowledge about changes and the trend over time in residents’health conditions and factors associated with the mortality of those moving to nursing homes.
The aim of this study was to investigate the time from residents’ admission to Icelandic nursing homes to death and the predictive power of demographic vari-ables, health status (health stability, pain, depression and cognitive performance) and functional profile (ADL and social engagement) for 3-year mortality in yearly cohorts from 1996-2006.
Methods
Sample
assessed; however, according to official data 4700 were admitted to nursing homes, leaving 33 extra assessments possibly due to residents moving between nursing homes [17]. The study sample represented 46.6% of the total admissions over the years. The admission criteria were not changed over the research period. The data were accessed from a central database stored by the Icelandic Ministry of Health. The database also stores the residents’ time of death retrieved from the national registry where all deaths are registered. The follow-up time for time of death for each cohort was 3 years from admission.
Instrument and procedure
The Minimum Data Set (MDS) is a part of the Resident Assessment Instrument (RAI) and is used to assess func-tioning and health care needs of nursing home residents [18,19]. Since 1996 the MDS assessment of all nursing home residents has been mandatory in accordance with a regulation set by the Icelandic Minister of Health [10]. The MDS assessment has been used internationally for research purposes but was originally designed as a clinical tool intended to improve care [18,19]. The Minimum Data Set for nursing homes (MDS), version 2.0, has 21 sections with about 350 clinical data elements. The MDS instrument is considered to be an extensive, reliable and valid instrument [20-22] and has enabled comparison between countries and institutions. The assessment is carried out by registered nurses, with physiotherapists and doctors participating, and is based on observation, clinical documentation and interviews with the residents and or their family members. Researchers have reported adequate inter-rater reliability (Kappa > 0.6) for 85% of the MDS data elements [23]. Ten of the variables used in this study have been reported to have moderate to per-fect agreement [24]. The variables from the MDS assess-ment used in this analysis were demographic variables (age, gender, year of admittance, place admitted from, and month of death) and scores from scales and indices developed especially for the MDS which can be used to monitor changes over time.
TheCHESS Scale (Changes in Health, End-stage dis-ease and Signs and Symptoms) ranges from 0 meaning that the individual is stable to a score of 5 indicating unstable health, risk of mortality, hospitalization, pain, caregiver stress and poor self-rated health. The scale is known to be a strong predictor of mortality [25].
The Pain Scale(PS) ranges from 0 indicating no pain to a score of 3 meaning that the resident is in severe (horrible/excruciating) pain [26]. It has been reported valid in detecting pain in nursing home residents [26].
The Depression Rating Scale(DRS) is a 15-point scale ranging from 0-14. A score of 0 means no indication of depression. A score of 3 indicates mild depression and a score of 14 very severe depression [27]. Researchers
have reported excellent sensitivity and acceptable speci-ficity; however, there is a need for further testing [27].
The Cognitive Performance Scale(CPS) ranges from 0 indicating that the resident is cognitively intact to 6 indicating severe cognitive impairment. The scale corre-lates moderately well with the Mini-Mental State Exami-nation [28].
TheADL long scaleis a 29-point scale, with a higher score indicating a greater need for assistance in the ADL activities (scale range 0-28) [20]. The scale has been reported to be sensitive to change [29].
The Index of Social Engagement (ISE) ranges from 0 meaning severe withdrawal from social engagement to 6 indicating that the resident has much initiative and participates in social activities. The range 0-2 has been described as indicating low social engagement compared to those with scores 3-6 [30].
Statistical methods
This study follows cohorts of residents admitted each year from 1996-2006. Descriptive and analytical statistics were used. The Mann-Whitney U-test with a Bonferroni correc-tion for multiple comparisons was used for ordinal data and skewed continuous data. The chi-square test and the chi-square test for trend were used for nominal data. Sur-vival analysis, comprising 36 months from admission, was performed, controlling for age. The association between survival and categorical potential risk variables (gender, age-group, where admitted from, year of admission) were analysed using Kaplan-Meier analysis (log-rank test). The association between survival and ordinal risk variables (RAI scales) was analysed by non-parametric correlation analyses (Spearman’s rho). Variables in these analyses associated with survival time with a p-value < 0.05 were entered into a multivariate Cox regression model (Back-ward stepwise; Likelihood-ratio) [31]. The Cox regression was performed controlling for age and controlling for age and gender. No multi-collinearity problem was detected. Partial correlation was used to further explore the relation-ship between social engagement and survival time while controlling for ADL functioning and health stability. The ADL Long scale was collapsed into 4 groups (scores 0-3, 4-9, 10-17, 18-28) in order to have fewer groups in the Cox regression. A limitation in the analysis is due to that nursing home as a variable was not possible to obtain and thus interpretation of the results should be made with that in mind. Data analysis was conducted with the software program SPSS version 17 and PASW Statistics 18.
Ethical approval
Results
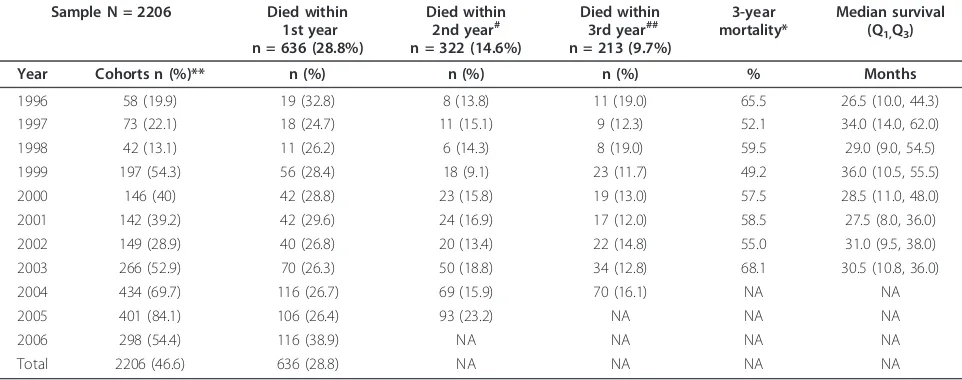
Of the total sample (N = 2206) 59.8% were women and the mean age was 82.5 years (SD 7.60). Women were older than men at admission (p < 0.0001) (n = 1319). Their mean age was 82.9 years (SD 7.80), and the mean age of men (n = 887) was 81.4 years (SD 8.20). Variation in sample size is shown in table 1. Residents were admitted from home (n = 1019, 46.8%), hospital (n = 805, 37.0%) other residential or nursing homes (n = 201, 9.2%) and assisted-living facilities (n = 151, 6.9%). A sig-nificant difference was not found within cohorts in gen-der and the average age of the excluded residents (assessed later than 90 days from admission), compared with the sample. The excluded residents’mean age ran-ged in each cohort from 80.6 to 82.8 years (NS), and the proportion of women was from 60.5% to 67.7% (NS) [14]. The median survival time for those admitted from 1996 to 2003 was 31 months (IQR 40), and 53.1% (n = 1171) of the residents died during the first 3 years of living in a nursing home. Residents dying in the first year were 28.8% (n = 636) of the total; 14.6% (n = 322) died during the sec-ond year, and 9.7% (n = 213) died during the third year. In the different cohorts residents dying in the first year ran-ged from 24.7% to 38.9% of the total, in the second year 9.1% to 23.2% and in the third year 11.7% to 19.0%. Resi-dents living longer than 3 years were 46.9% (n = 1035) of the total. No significant difference was seen in median sur-vival and mortality rates between cohorts (Table 1).
The median score of the sample for health stability was 1 (IQR 2), for pain 1 (IQR 2), for depression 1 (IQR 2), for cognitive performance 2 (IQR 2), for ADL perfor-mance 9 (IQR 14) and for social engagement 2 (IQR 4).
The health of residents dying in the first year after admis-sion to a nursing home was more unstable (p < 0.001) and their ADL performance was worse (p < 0.001) at admittance than for those dying in the second and third year. They also had more pain (p = 0.02) than those dying in the second year and were more depressed (p = 0.009) and less involved in social engagement (p < 0.001) than those dying in the third year. The health of residents dying in the second year after admission was less stable than for those dying in the third year (p < 0.001). Resi-dents living more than 3 years from admission had better ADL performance (P = 0.004), better cognitive perfor-mance and were more involved in social engagement (p < 0.001) than those dying in the first to third year from admittance. Their health was more stable than of those dying in the first and second year (p < 0.001), and they were less depressed and in less pain than those dying in the first year (p < 0.001). The median values, Q1and Q3 of the variables for those dying in the first to third year or lived longer than 3 years are shown in Table 2.
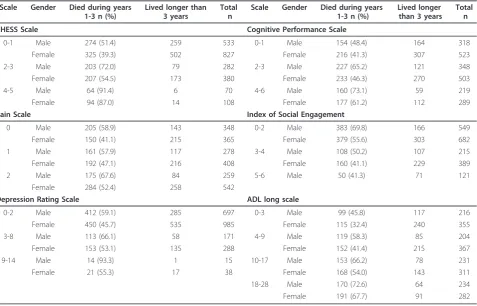
[image:4.595.57.538.512.702.2]The number of males and females who died within the first three years (%) and of those who survived longer than 3 years are shown by scale values for the CHESS Scale, Pain Scale, Depression Rating Scale, Cog-nitive Performance Scale, ADL Long Scale and the Index of Social Engagement in table 3. The death rate for males and females increased with higher scores for the CHESS Scale, Depression Rating Scale, Cognitive Performance Scale, and the ADL Long Scale. In con-trast, the death rate decreased with higher scores for the Index of Social Engagement, i.e. increased activity (table 3).
Table 1 Number of residents in each cohort (1996-2006) dying within the 1st, 2nd and 3rd years from admittance, 3-year mortality and median survival in months
Sample N = 2206 Died within 1st year n = 636 (28.8%)
Died within 2nd year#
n = 322 (14.6%)
Died within 3rd year##
n = 213 (9.7%)
3-year mortality*
Median survival (Q1,Q3)
Year Cohorts n (%)** n (%) n (%) n (%) % Months
1996 58 (19.9) 19 (32.8) 8 (13.8) 11 (19.0) 65.5 26.5 (10.0, 44.3)
1997 73 (22.1) 18 (24.7) 11 (15.1) 9 (12.3) 52.1 34.0 (14.0, 62.0)
1998 42 (13.1) 11 (26.2) 6 (14.3) 8 (19.0) 59.5 29.0 (9.0, 54.5)
1999 197 (54.3) 56 (28.4) 18 (9.1) 23 (11.7) 49.2 36.0 (10.5, 55.5)
2000 146 (40) 42 (28.8) 23 (15.8) 19 (13.0) 57.5 28.5 (11.0, 48.0)
2001 142 (39.2) 42 (29.6) 24 (16.9) 17 (12.0) 58.5 27.5 (8.0, 36.0)
2002 149 (28.9) 40 (26.8) 20 (13.4) 22 (14.8) 55.0 31.0 (9.5, 38.0)
2003 266 (52.9) 70 (26.3) 50 (18.8) 34 (12.8) 68.1 30.5 (10.8, 36.0)
2004 434 (69.7) 116 (26.7) 69 (15.9) 70 (16.1) NA NA
2005 401 (84.1) 106 (26.4) 93 (23.2) NA NA NA
2006 298 (54.4) 116 (38.9) NA NA NA NA
Total 2206 (46.6) 636 (28.8) NA NA NA NA
*Chi-square test for trend showed no significant difference in mortality between cohorts.
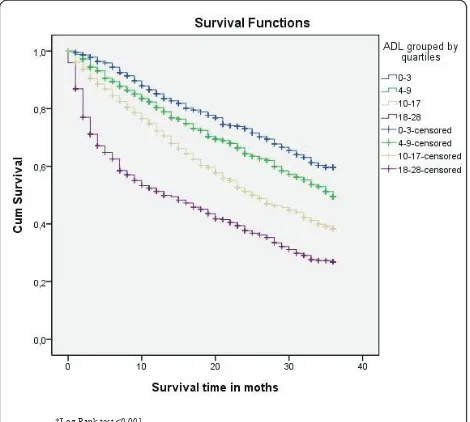
Figures 1, 2 and 3 display the survival curves for the CHESS scale, the ADL scale and the index of social engagement (log rank test p < 0.001).
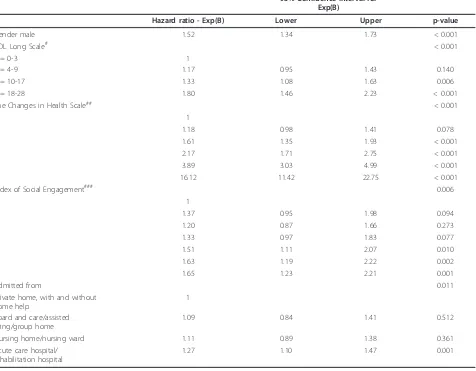
The probability of dying increased with age, male gen-der, admitted from a hospital, more disability in ADL
[image:5.595.68.539.122.306.2]function and less stability in health. Predictors of mor-tality are presented in table 4 adjusted for age and in table 5 adjusted for age and gender. The probability of dying decreased with a higher ability to participate in social engagement. There was also a weak but significant
Table 2 Median values, Q1and Q3at admission for the CHESS Scale, Pain Scale, Depression Rating Scale, Cognitive
Performance Scale, ADL Long Scale and the Index of Social Engagement for residents dying within the 1st, 2nd and 3rd years or living longer than 3 years from admission to a nursing home
Scale Died within the
1st year n = 636 (28.8%)
Died within the 2nd year n = 322 (14.6%)
Died within the 3rd year n = 213 (9.7%)
Lived longer than 3 years n = 1035 (46.9%)
Median (Q1,Q3) Median (Q1,Q3) Median (Q1,Q3) Median (Q1,Q3)
CHESS Scale (range 0-5)
2 (1, 3) 1 (0, 2) 1 (0, 2) 1 (0, 2)
Pain Scale (range 0-5)
1 (0, 2) 1 (0, 2) 1 (0, 2) 1 (0, 2)
Depression Rating Scale (range 0-14)
1 (0, 3) 1 (0, 2) 1 (0, 2) 1 (0, 2)
Cognitive Performance Scale (range 0-6)
3 (1, 5) 3 (1, 4) 3 (1, 3) 2 (1, 3)
ADL long scale (range 0-28)
14 (7, 23) 10 (5, 15) 9 (3, 14) 6 (2, 13)
Index of Social Engagement (range 0-6)
1 (0, 3) 2 (0, 4) 2 (0, 4) 3 (1, 4)
[image:5.595.61.539.430.736.2]Age 84 (80, 89) 83 (78, 88) 84 (79, 88) 82 (77, 86)
Table 3 Number of males and females who died within first three years (%) and survived longer than 3 years by scale values for the CHESS Scale, Pain Scale, Depression Rating Scale, Cognitive Performance Scale, ADL Long Scale and the Index of Social Engagement
Scale Gender Died during years 1-3 n (%)
Lived longer than 3 years
Total n
Scale Gender Died during years 1-3 n (%)
Lived longer than 3 years
Total n
CHESS Scale Cognitive Performance Scale
0-1 Male 274 (51.4) 259 533 0-1 Male 154 (48.4) 164 318
Female 325 (39.3) 502 827 Female 216 (41.3) 307 523
2-3 Male 203 (72.0) 79 282 2-3 Male 227 (65.2) 121 348
Female 207 (54.5) 173 380 Female 233 (46.3) 270 503
4-5 Male 64 (91.4) 6 70 4-6 Male 160 (73.1) 59 219
Female 94 (87.0) 14 108 Female 177 (61.2) 112 289
Pain Scale Index of Social Engagement
0 Male 205 (58.9) 143 348 0-2 Male 383 (69.8) 166 549
Female 150 (41.1) 215 365 Female 379 (55.6) 303 682
1 Male 161 (57.9) 117 278 3-4 Male 108 (50.2) 107 215
Female 192 (47.1) 216 408 Female 160 (41.1) 229 389
2 Male 175 (67.6) 84 259 5-6 Male 50 (41.3) 71 121
Female 284 (52.4) 258 542
Depression Rating Scale ADL long scale
0-2 Male 412 (59.1) 285 697 0-3 Male 99 (45.8) 117 216
Female 450 (45.7) 535 985 Female 115 (32.4) 240 355
3-8 Male 113 (66.1) 58 171 4-9 Male 119 (58.3) 85 204
Female 153 (53.1) 135 288 Female 152 (41.4) 215 367
9-14 Male 14 (93.3) 1 15 10-17 Male 153 (66.2) 78 231
Female 21 (55.3) 17 38 Female 168 (54.0) 143 311
18-28 Male 170 (72.6) 64 234
partial correlation between social engagement and survi-val time whilst controlling for ADL functioning and health stability (r = 0.062, n = 2204, p < 0.004), with more social engagement being associated with longer survival. The zero order correlation (r = 0.191) sug-gested that controlling for ADL capacity and health sta-bility had some effect on the relationship of social engagement and survival time. The ADL performance score from 4-9 was not a significant predictor of mortal-ity, whereas higher scores were. The changes in health score were significant in all categories except the lowest
score of 1. A higher score (2-5), i.e. more instability in health, meant a higher hazard ratio. A score of 5 meant a 15.7 times greater likelihood of dying than the refer-ence group, i.e. than those with a score of 0. The scores 0-2 (withdrawal) on social engagement were significant predictors of mortality (Tables 4-5).
Discussion
This study showed the median survival time of nursing home residents in Iceland to be 31 months (2.6 years) with a stable death rate over the period of the study. Almost a third of the residents had died within a year from admission; a majority had died within 3 years, and less than half of the residents lived longer than 3 years. Those dying within the first year had less stable health, worse ADL performance, more pain, more depression and were less involved in social engagement. Significant predictors of mortality were age, gender, where admit-ted from, ADL functioning, health stability and social engagement.
The reported survival time in this study is similar to two recent studies with a 5 year follow-up time where the median survival of nursing homes was 2.3 years (N. Irel.; n = 2.112) [32] (US; n = 468) [33]. Other studies have reported higher [3] or lower [1] mean survival times. However, any cross-country comparison of survival times must take into account the availability of home care ser-vices and the criteria for nursing home placement in the respective countries; admission criteria for nursing home placement especially may complicate comparison.
[image:6.595.306.540.87.302.2]Combined health stability and ADL performance seem to be valid predictors of mortality and should thus be *Log Rank test p<0.001
Figure 1Survival curves for the CHESS scale.
*Log Rank test <0.001
Figure 2Survival curves for residents’ADL scores by quartiles.
[image:6.595.56.295.88.303.2]*Log Rank test p<0.001
[image:6.595.57.292.498.709.2]considered when selecting a preferable type of service for older persons. These findings resemble those in other studies with regard to health stability [2,34] as well as ADL capacity [1,35]. In this study health stabi-lity, in particular a score of 2 or higher, was a strong predictor of mortality. Residents with this score were 1.61 times likelier to die during the investigation period, and those with a score of 5 were 16.12 times likelier to die. Also, a score of 10 or higher in ADL performance significantly predicted a higher risk of mortality than for those with a lower score. For instance those with a score 10-17 were 1.33 times likelier to die during the investigation period, and those with a score of 18-28 were 1.80 times likelier to die. Thus assessment of ADL and health stability seems to be helpful in selecting the most appropriate type of service. It may well be that
older persons having a health stability score lower than 2 and an ADL score below 10 are better off in home care than nursing home placement. However, using only ADL capacity and health stability as a reference may be too narrow an approach. There may be other reasons for deciding on nursing home placement apart from those with increasing risk of mortality, such as difficult social circumstances or the person’s mental health. Still it turned out that unstable health and low ADL capacity should be considered as important indicators of death and, in turn, more nursing care needs, such as services available at a nursing home.
[image:7.595.63.539.108.479.2]It was noteworthy that low social engagement seems to be an important variable to take into account when pre-dicting mortality. As a concept it may be viewed as the opposite of unstable health and low ADL capacity, as such
Table 4 Predictors of mortality (controlled for age*) **
95% Confidence Interval for Exp(B)
Hazard ratio - Exp(B) Lower Upper p-value
Gender male 1.52 1.34 1.73 < 0.001
ADL Long Scale# < 0.001
1 = 0-3 1
2 = 4-9 1.17 0.95 1.43 0.140
3 = 10-17 1.33 1.08 1.63 0.006
4 = 18-28 1.80 1.46 2.23 < 0.001
The Changes in Health Scale## < 0.001
0 1
1 1.18 0.98 1.41 0.078
2 1.61 1.35 1.93 < 0.001
3 2.17 1.71 2.75 < 0.001
4 3.89 3.03 4.99 < 0.001
5 16.12 11.42 22.75 < 0.001
Index of Social Engagement### 0.006
6 1
5 1.37 0.95 1.98 0.094
4 1.20 0.87 1.66 0.273
3 1.33 0.97 1.83 0.077
2 1.51 1.11 2.07 0.010
1 1.63 1.19 2.22 0.002
0 1.65 1.23 2.21 0.001
Admitted from 0.011
Private home, with and without home help
1
Board and care/assisted living/group home
1.09 0.84 1.41 0.512
Nursing home/nursing ward 1.11 0.89 1.38 0.361
Acute care hospital/ rehabilitation hospital
1.27 1.10 1.47 0.001
*Cox regression was performed controlling for age in four age groups (50-79, 80-84, 85-89, 90-104).
**Variables entered into the Cox regression were: gender, ADL Long Scale, CHESS, ISE, admitted from, pain scale, CPS and DRS. # Score 0 = independent or only needs supervision; Score 28 = severe impairment in all four ADL activities.
debilitation would hinder a person from seeking or devel-oping effective social engagement. The level of ADL capa-city, however, does have some effect on the relationship of social engagement and survival time. In this study those with the least social engagement had an increased risk of death compared with the reference group who were deemed to have high initiative and participated in social activities. Those with a score of 2 were 1.51 times likelier to die than the reference group, and those with a score of 0, i.e. demonstrating severe withdrawal from social engagement, were 1.65 times likelier to die. Other studies have reported decreased social engagement to be a predic-tor of mortality for residents already living in nursing homes [3,36], rather than at admission. A study of one-year mortality of residents (US; n = 30.070) showed that greater levels of social engagement (scores 0-6 on the same scale as the present study) were associated with
[image:8.595.57.541.101.466.2]longer survival (p = 0.0001), and a one-point decrease in the index of social engagement meant that residents were 1.16 times as likely to die during the follow-up period [36]. The present study, however, revealed that only a score of 2 and lower in social engagement significantly predicted mortality, and the risk decreased with higher levels of engagement (Table 4). Causality cannot be established in the present study although it has been stated that social engagement influences residents well-being, and that social isolation may increase mortality and morbidity [37]. The nature of the relationship between social engagement and survival is complex. Social engagement may be hin-dered by disease and disabilities or other factors. Further-more, environmental factors, activity and action by the individual may influence a person’s health status [38]. Thus, it may well be that stimulating social engagement and individual activity may increase survival time.
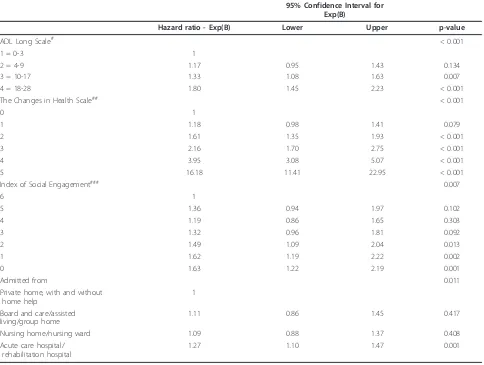
Table 5 Predictors of mortality (controlled for age and gender*) **
95% Confidence Interval for Exp(B)
Hazard ratio - Exp(B) Lower Upper p-value
ADL Long Scale# < 0.001
1 = 0-3 1
2 = 4-9 1.17 0.95 1.43 0.134
3 = 10-17 1.33 1.08 1.63 0.007
4 = 18-28 1.80 1.45 2.23 < 0.001
The Changes in Health Scale## < 0.001
0 1
1 1.18 0.98 1.41 0.079
2 1.61 1.35 1.93 < 0.001
3 2.16 1.70 2.75 < 0.001
4 3.95 3.08 5.07 < 0.001
5 16.18 11.41 22.95 < 0.001
Index of Social Engagement### 0.007
6 1
5 1.36 0.94 1.97 0.102
4 1.19 0.86 1.65 0.303
3 1.32 0.96 1.81 0.092
2 1.49 1.09 2.04 0.013
1 1.62 1.19 2.22 0.002
0 1.63 1.22 2.19 0.001
Admitted from 0.011
Private home, with and without home help
1
Board and care/assisted living/group home
1.11 0.86 1.45 0.417
Nursing home/nursing ward 1.09 0.88 1.37 0.408
Acute care hospital/ rehabilitation hospital
1.27 1.10 1.47 0.001
*Cox regression was performed controlling for age in four age groups (50-79, 80-84, 85-89, 90-104) and gender. **Variables entered into the Cox regression were: ADL Long Scale, CHESS, ISE, admitted from, pain scale, CPS and DRS. # Score 0 = independent or only needs supervision; Score 28 = severe impairment in all four ADL activities.
The high percentage of residents dying in the first to third years of living in a nursing home suggests that the concept of palliative care may be a useful model for care in a nursing home. Research has furthermore indicated that increasing numbers of residents are dying in nur-sing homes instead of hospitals [4]. The findings of the present study suggest that one third of those admitted were already in a palliative stage at admission. Thus, the focus of nursing care in nursing homes needs to be on palliative care as much as restorative care. However, knowledge of palliative care and symptom management adapted to older people [4] as well as to those suffering from dementia is lacking in nursing homes [39].
The death rate was stable between cohorts, and in the first year after admission, it was 28.8% despite the fact that resources for nursing home care have decreased over the years. Findings from other studies differ and have reported both lower (17.5%) [3] and higher rates (34%) [2]. In a Swedish study on two cohorts (2001 and 2002) of old people (N = 626; 65-98 years) receiving public long-term care, the two-year mortality rate was 30% and 31%, respectively [35]. This was considerably lower than in the present study (43.4%). It should be noted that the Swedish subjects were receiving care at home as well as in nursing homes. However, where peo-ple were living was not an independent predictor of mortality [35]. Almost a third of the residents in the present study may have needed palliative care within a year of admission. These residents had less stable health, more ADL dependency, pain and depression and were less engaged socially - needs well within the concept of palliative care. Thus dying is a central issue in nursing care in nursing homes.
Although a majority died within a year in this study, 46.9% of the residents (n = 1035) lived longer than 3 years. They may have been detected prior to nursing home placement by systematic assessment of ADL capa-city and health stability. Some of them may have bene-fitted from receiving a type of service other than nursing home placement. For instance, home care and rehabilitation might have delayed entry into nursing homes. Such an approach would have been more in line with the official policy of enabling older people to stay at home as long as possible. Enabling old people in rela-tively stable health and needing low levels of ADL assis-tance to stay at home longer would probably decrease the demand for nursing home placement.
The strength of this study is the inclusion of 11 cohorts and data based on residents’admission status. Registered nurses trained for the purpose performed the assessments, and only a valid instrument was used [22,40]. Nevertheless, this study has some limitations, such as variation in the sample of 13% to 84% of the total residents admitted each year to nursing homes
[14]. The low percentage of the sample in the early years stems from the fact that these were the first years for mandatory assessment in all nursing homes in Ice-land. It took some years for the assessment to be fully implemented, and in the early years residents were often not assessed until they had spent considerable time in the nursing home. Another limitation of concern is that the residents in the sample may have suffered some changes to their health after admittance and before being assessed. The delay in assessment is probably mostly related to workload and the absence of staff due to sickness or leaves rather than characteristics of the residents. The error should therefore be random rather than systematic. However, this can not be substantiated. Researchers have reported, however, a decline among nursing home residents over a six-month period [41] and a lower mortality risk of recently admitted residents compared to others [32]. The researchers’position, how-ever, was that data from assessments within 90 days would sufficiently reflect the admission status of the residents.
Difference in mortality rates between nursing homes cannot be ruled out. It would have been preferable to investigate this, of course, but information on placement within individual nursing homes was not available. The reported significance of predictors of mortality may therefore vary in relation to nursing homes and this needs to be considered a limitation. Nursing homes in Iceland have however the same admission criteria and any difference in mortality rates are unlikely to have had a powerful effect.
Conclusions
Acknowledgements
The authors thank the support of the Department of Health Sciences at Lund University, Sweden; the Scientific Fund of The National University Hospital of Iceland; the Scientific Fund of the Icelandic Nurses Association; and the Scientific Fund of the Icelandic Geriatric Council. The authors also thank Terry G. Lacy, translator, for her language assistance and proofreading of this article.
Author details 1
Department of Health Sciences, Lund University, Lund, Sweden.2Faculty of Nursing, University of Iceland, Reykjavik, Iceland.3Internal medical Services, The National University Hospital of Iceland, Reykjavik, Iceland.4The Swedish Institute for Health Sciences, Lund University, Lund, Sweden.
Authors’contributions
IH participated in the conception and design of the study, analysis and interpretation of data and was the main writer of the article. IRH participated in the conception and design of the study, writing of the article and critical revisions, analysis and interpretation of data and provided the principal oversight of the research. AKE and PN participated in the conception and design of the study, analysis and interpretation of data, oversight of the research, writing of the article and critical revisions. All authors read and approved the final manuscript.
Competing interests
The authors declare that they have no competing interests.
Received: 23 September 2010 Accepted: 20 April 2011 Published: 20 April 2011
References
1. Sutcliffe C, Burns A, Challis D, Mozley CG, Cordingley L, Bagley H, Huxley P:
Depressed mood, cognitive impairment, and survival in older people admitted to care homes in England.Am J Geriatr Psychiatry2007,
15:708-715.
2. Flacker JM, Kiely DK:Mortality-related factors and 1-year survival in nursing home residents.J Am Geriatr Soc2003,51:213-221.
3. Dale MC, Burns A, Panter L, Morris J:Factors affecting survival of elderly nursing home residents.Int J Geriatr Psychiatry2001,16:70-76. 4. Whittaker E, Kernohan WG, Hansson F, Howard V, McLaughlin D:The
palliative care education needs of nursing home staff.Nurse Education Today2006,26:501-510.
5. Hockley J, Dewar B, Watson J:Promoting end-of-life care in nursing homes an‘integrated care pathway for the last days of life’.Journal of reasearch in nursing2005,10:135-152.
6. Hallberg IR:Palliative care as a framework for older people’s long-term care.International Journal of Palliative Nursing2006,12:224-229. 7. Davies E, Higginson IJ:Better palliative care for older people.Geneva:
World Health Organisation; 2004.
8. Hall P, Schroder C, Weaver L:The last 48 hours of life in long-term care: a focused chart audit.J Am Geriatr Soc2002,50:501-506.
9. Wowchuk SM, McClement S, Bond J Jr:The challenge of providing palliative care in the nursing home part II: internal factors.Int J Palliat Nurs2007,13:345-350.
10. Icelandic Ministry of Health: Sevices for older people [Málaflokkar og stofnanir].[http://www.heilbrigdisraduneyti.is].
11. Ingimarsson O, Aspelund T, Jonsson PV:[The Preadmission Nursing Home Assessment (PNHA) in Iceland in 1992-2001 - Relationship to survival and admission to a long term care facility.].Laeknabladid2004,
90:121-129.
12. Population statistics [database on the internet].[http://hagstofa.is/ Hagtolur/Mannfjoldi/Yfirlit].
13. Jonsson A, Bernhöft I, Bernhardsson K, Jonsson P:Retrospective analysis of health variables in a Reykjavík nursing home 1983-2004.Laeknabladid
2005,91:153-160.
14. Hjaltadottir I, Hallberg IH, Ekwall AK, Nyberg P:Health and functional profile at admission of nursing home residents in Iceland over an eleven year period.International Journal of Older People Nursing. 15. Bravo G, De Wals P, Dubois MF, Charpentier M:Correlates of care quality
in long-term care facilities: A multilevel analysis.Journals of Gerontology Series B-Psychological Sciences and Social Sciences1999,54:P180-P188.
16. Sund-Levander M, Grodzinsky E, Wahren LK:Gender differences in predictors of survival in elderly nursing-home residents: a 3-year follow up.Scand J Caring Sci2007,21:18-24.
17. DHI:Directorate of Health Iceland (DHI) Analysis of nursing home admissions.2008,2008.
18. Allen JE:Long term care: Facility resident assessment instrument, users manual.New York: Springer Publishing Company; 1997.
19. Mor V:A comprehensive clinical assessment tool to inform policy and practice: applications of the minimum data set.Medical Care2004,42: III50-59.
20. Morris JN, Fiatarone M, Kiely DK, Belleville-Taylor P, Murphy K, Littlehale S, Ooi WL, O’Neill E, Doyle N:Nursing rehabilitation and exercise strategies in the nursing home.Journal of Gerontology A Biological Sciences and Medical Sciences1999,54:M494-500.
21. Morris JN, Hawes C, Fries BE, Phillips CD, Mor V, Katz S, Murphy K, Drugovich ML, Friedlob AS:Designing the national resident assessment instrument for nursing homes.Gerontologist1990,30:293-307. 22. Hawes C, Morris JN, Phillips CD, Mor V, Fries BE, Nonemaker S:Reliability
estimates for the Minimum Data Set for nursing home resident assessment and care screening (MDS).Gerontologist1995,35:172-178. 23. Mor V, Angelelli J, Jones R, Roy J, Moore T, Morris J:Inter-rater reliability of
nursing home quality indicators in the U.S.BMC Health Serv Res2003,3:20. 24. Jensdottir AB, Guðmundsdóttir H, Palsson H, Hjaltadottir I, Jonsson PV,
Sigurgeirsdottir S:Daily Life in a Nursing Home: Health status and nursing need of nursing home residents [Daglegt líf á hjúkrunarheimili:].
Reykjavik: Icelandic Ministry of Health; 1995, 1-97, pp. 1-97.
25. Hirdes JP, Frijters DH, Teare GF:The MDS-CHESS scale: a new measure to predict mortality in institutionalized older people.Journal of the American Geriatrics Society2003,51:96-100.
26. Fries BE, Simon SE, Morris JN, Flodstrom C, Bookstein FL:Pain in U.S. nursing homes: validating a pain scale for the minimum data set.
Gerontologist2001,41:173-179.
27. Burrows AB, Morris JN, Simon SE, Hirdes JP, Phillips C:Development of a minimum data set-based depression rating scale for use in nursing homes.Age Ageing2000,29:165-172.
28. Gruber-Baldini AL, Zimmerman SI, Mortimore E, Magaziner J:The validity of the Minimum Data Set in measuring the cognitive impairment of persons admitted to nursing homes.Journal of the American Geriatrics Society2000,48:1601-1606.
29. Carpenter GI, Hastie CL, Morris JN, Fries BE, Ankri J:Measuring change in activities of daily living in nursing home residents with moderate to severe cognitive impairment.BMC Geriatr2006,6:7.
30. Resnick HE, Fries BE, Verbrugge LM:Windows to their world: the effect of sensory impairments on social engagement and activity time in nursing home residents.J Gerontol B Psychol Sci Soc Sci1997,52:S135-144. 31. Altman DG:Practical statistics for medical research.London: Chapman
and Hall; 1991.
32. McCann M, O’Reilly D, Cardwell C:A Census-based longitudinal study of variations in survival amongst residents of nursing and residential homes in Northern Ireland.Age Ageing2009,38:711-717.
33. Wieland D, Boland R, Baskins J, Kinosian B:Five-year survival in a Program of All-inclusive Care for Elderly compared with alternative institutional and home- and community-based care.J Gerontol A Biol Sci Med Sci2010,
65:721-726.
34. Lee JS, Chau PP, Hui E, Chan F, Woo J:Survival prediction in nursing home residents using the Minimum Data Set subscales: ADL Self-Performance Hierarchy, Cognitive Self-Performance and the Changes in Health, End-stage disease and Symptoms and Signs scales.Eur J Public Health2009,19:308-312.
35. Jakobsson U, Hallberg IR:Mortality among elderly receiving long-term care: a longitudinal cohort study.Aging Clin Exp Res2006,18:503-511. 36. Kiely DK, Flacker JM:The protective effect of social engagement on
1-year mortality in a long-stay nursing home population.Journal of Clinical Epidemiology2003,56:472-478.
37. House JS:Social isolation kills, but how and why?Psychosom Med2001,
63:273-274.
38. WHO:International classification of functioning, disability and health.
Geneva: World health Organization; 2001.
40. Morris JN, Fries BE, Morris SA:Scaling ADLs within the MDS.Journal of Gerontology A Biological Sciences and Medical Sciences1999,54:M546-553. 41. Scocco P, Rapattoni M, Fantoni G:Nursing home institutionalization:
a source of eustress or distress for the elderly?International Journal of Geriatric Psychiatry2006,21:281-287.
Pre-publication history
The pre-publication history for this paper can be accessed here: http://www.biomedcentral.com/1472-6963/11/86/prepub
doi:10.1186/1472-6963-11-86
Cite this article as:Hjaltadóttiret al.:Predicting mortality of residents at
admission to nursing home: A longitudinal cohort study.BMC Health Services Research201111:86.
Submit your next manuscript to BioMed Central and take full advantage of:
• Convenient online submission
• Thorough peer review
• No space constraints or color figure charges
• Immediate publication on acceptance
• Inclusion in PubMed, CAS, Scopus and Google Scholar
• Research which is freely available for redistribution