BioMedCentral
Page 1 of 7
(page number not for citation purposes)
BMC Research Notes
Open Access
Short Report
Update on comparative genome mapping between
Malus
and
Pyrus
Jean-Marc Celton
1,2, David Chagné
2, Stuart D Tustin
3, Shingo Terakami
4,
Chikako Nishitani
4, Toshiya Yamamoto
4and Susan E Gardiner*
2Address: 1University of Western Cape, Biotechnology Department, Modderdam Road, Bellville, Cape Town, 7535, South Africa, 2The New Zealand Institute for Plant & Food Research Limited, Palmerston North 4442, New Zealand, 3The New Zealand Institute for Plant & Food Research Limited, Hawke's Bay, PB 1401, Havelock North 4157, New Zealand and 4National Institute of Fruit Tree Science, Tsukuba, Ibaraki 305-8605, Japan
Email: Jean-Marc Celton - [email protected]; David Chagné - [email protected];
Stuart D Tustin - [email protected]; Shingo Terakami - [email protected]; Chikako Nishitani - [email protected]; Toshiya Yamamoto - [email protected]; Susan E Gardiner* - [email protected]
* Corresponding author
Abstract
Background: Comparative genome mapping determines the linkage between homologous genes of related taxa. It has already been used in plants to characterize agronomically important genes in lesser studied species, using information from better studied species. In the Maloideae sub-family, which includes fruit species such as apple, pear, loquat and quince, genome co-linearity has been suggested between the genera Malus and Pyrus; however map comparisons are incomplete to date.
Findings: Genetic maps for the apple rootstocks 'Malling 9' ('M.9') (Malus × domestica) and 'Robusta 5' ('R5') (Malus × robusta), and pear cultivars 'Bartlett' and 'La France' (Pyrus communis) were constructed using Simple Sequence Repeat (SSR) markers developed from both species, including a new set of 73 pear Expressed Sequence Tag (EST) SSR markers. Integrated genetic maps for apple and pear were then constructed using 87 and 131 SSR markers in common, respectively.
The genetic maps were aligned using 102 markers in common, including 64 pear SSR markers and 38 apple SSR markers. Of these 102 markers, 90 anchor markers showed complete co-linearity between the two genomes.
Conclusion: Our alignment of the genetic maps of two Malus cultivars of differing species origin with two Pyrus communis cultivars confirms the ready transferability of SSR markers from one genus to the other and supports a high level of co-linearity within the sub-family Maloideae between the genomes of Malus and Pyrus.
Findings
Comparative genomics involves the assessment of the degree of genomic conservation between species to enable the transfer of genetic information, such as the position of major genes, quantitative trait loci (QTL), and candidate genes, in order to validate their role. Practically, compara-tive genome mapping determines the linkage between
homologous genes of related taxa by aligning genome maps using orthologous molecular markers, which can greatly assist in genetic analysis of less-studied species. It is often measured by the degree of synteny, that is, the conservation of gene content, and co-linearity, which rep-resents the conservation of gene order between conserved genomic regions. The first example of genome compari-Published: 14 September 2009
BMC Research Notes 2009, 2:182 doi:10.1186/1756-0500-2-182
Received: 11 June 2009 Accepted: 14 September 2009 This article is available from: http://www.biomedcentral.com/1756-0500/2/182
© 2009 Gardiner et al; licensee BioMed Central Ltd.
BMC Research Notes 2009, 2:182 http://www.biomedcentral.com/1756-0500/2/182
Page 2 of 7
(page number not for citation purposes)
son in plants was made between tomato and potato and used conserved restricted fragment length polymorphism (RFLP) probes [1] to reveal a high degree of co-linearity between these species.
The Maloideae sub-family includes fruit species such as apple, pear, loquat and quince. Apple (Malus × domestica) and pear (Pyrus species) are major temperate fruit crops that have been cultivated in Europe and Asia for at least 2,000 to 3,000 years [2]. Molecular markers linked to a number of agronomically important traits, such as resist-ance to pests and diseases, tree architecture, and fruit qual-ity, have been identified in both apple [3] and pear [4]. Their identical chromosome number (2n = 2x = 34) and similar genome size (apple 1.57 pg/2C [5]; pear 1.11 pg/ 2C) [6], as well as their supposed recent divergence date (33.9 to 55.8 million years ago [7]) suggests that their genomes might be highly co-linear. When co-linearity between Malus and Pyrus was examined by comparing maps of the European pears (Pyrus communis) 'Bartlett' and 'La France', and the Japanese pear (Pyrus pyrifolia) 'Housui' with those of apple cultivars (Malus × domestica) 'Fiesta' and 'Discovery' [8] using 66 transferable apple simple sequence repeat (SSR) loci, all the pear linkage groups were aligned to the apple consensus linkage groups with at least one marker in common [9]. These results showed that positions of SSR loci are well con-served between apple and pear, suggesting that partial co-linearity exists between the genera. A study by [10] reported that more than 100 apple SSR markers could be positioned on pear genetic linkage maps. [11] described the mapping of six pear SSR loci on the linkage maps of apples 'Fiesta' and 'Discovery', and their location in homologous linkage groups. This was confirmed in a later study based on a larger set of pear SSR markers mapped in a 'Malling 9' × 'Robusta 5' ('M.9' × 'R5') apple rootstock population [12].
Here we report on a detailed comparison of the apple and pear genomes using a new set of transferable SSR markers developed from pear coding sequences.
Methods
Plant materialThe genetic maps that were used as framework maps for positioning the new markers have previously been described. Construction of the genetic map of the Euro-pean pear cultivars 'La France' and 'Bartlett' is described in [9]. The apple rootstock genetic linkage maps constructed in 'M.9' (Malus × domestica) and 'R5' (Malus × robusta) are described in [12]. The new SSR markers were screened over 60 F1 individuals from the 'M.9' × 'R5' population, consisting of the bin mapping set [12] of 14 plants together with 46 additional seedlings.
SSR markers
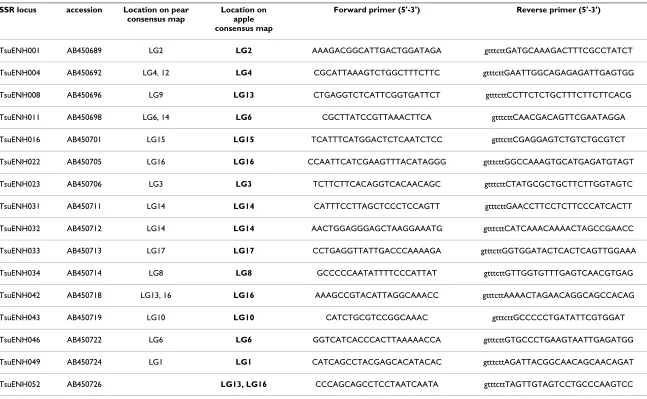
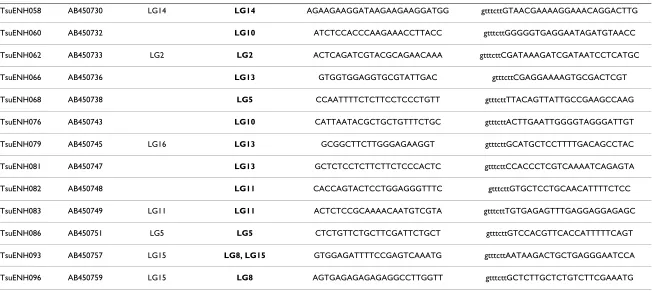
Seventy-three new SSR markers developed from pear EST were tested for their amplification and segregation in the 'M.9' × 'R5' apple population. These markers are prefixed by TsuENH and their PCR primer sequence and accession of the EST are given in Table 1. PCR amplifications were performed as described in [13] with the modifications described in [12]. PCR fragments were separated as described in [9] and [12] for pear and apple, respectively.
Linkage analysis and map integration
The new EST-based SSR markers were positioned on the parental apple and pear genetic maps using JoinMap v3.0 software [14] with a minimum LOD score of 5.0 for grouping using the Kosambi function. Integrated consen-sus genetic maps were constructed by merging the 'M.9' and 'R5' datasets for apple, and the 'La France' and 'Bar-tlett' datasets for pear, using the "combine" function of JoinMap v3.0. This merging method is based on the calcu-lation of mean recombination frequencies and combined LOD scores. Graphical representations of the maps were drawn using MapChart v2.0 [15]. For the integration of the female and male maps, SSR markers in common among homologous linkage groups were used for the analysis, and all apple SSR markers mapped on pear, as well as all pear SSR markers mapped on apple, were included. Other types of markers, such as amplified frag-ment length polymorphisms (AFLP), single nucleotide polymorphisms (SNP), sequence characterized amplified regions (SCAR), and isozymes were removed from the map, except when located in large gaps between SSR markers, or at the extreme end of a linkage group.
Results
Pear EST-SSR polymorphism
All 73 pear SSR markers developed from pear expressed sequence tags (EST) amplified a PCR product when tested on apple and 29 (40%) were polymorphic in the 'M.9' × 'R5' population (Table 1). Two markers, TsuENH052 and TsuENH093, amplified two loci in apple. Nineteen and 22 pear EST-SSR markers were mapped on 'M.9' and 'R5', respectively, bringing the total number of pear markers mapped on 'M.9' to 51 and 'R5' to 61 [12]. The integrated consensus 'M.9' × 'R5' map contained a total of 96 SSR loci derived from 90 primer pairs developed from either pear genomic DNA or EST.
Genetic map integration and comparison
BMC Research Notes
200
9,
2
:18
2
http://ww
w.b
iomed
central.com/1
756
-0
500
/2
/18
2
Page
3
of
7
[image:3.792.90.737.112.511.2](page number not for citation purposes)
Table 1: List of pear EST-based SSR markers tested in apple.
SSR locus accession Location on pear consensus map
Location on apple consensus map
Forward primer (5'-3') Reverse primer (5'-3')
TsuENH001 AB450689 LG2 LG2 AAAGACGGCATTGACTGGATAGA gtttcttGATGCAAAGACTTTCGCCTATCT
TsuENH004 AB450692 LG4, 12 LG4 CGCATTAAAGTCTGGCTTTCTTC gtttcttGAATTGGCAGAGAGATTGAGTGG
TsuENH008 AB450696 LG9 LG13 CTGAGGTCTCATTCGGTGATTCT gtttcttCCTTCTCTGCTTTCTTCTTCACG
TsuENH011 AB450698 LG6, 14 LG6 CGCTTATCCGTTAAACTTCA gtttcttCAACGACAGTTCGAATAGGA
TsuENH016 AB450701 LG15 LG15 TCATTTCATGGACTCTCAATCTCC gtttcttCGAGGAGTCTGTCTGCGTCT
TsuENH022 AB450705 LG16 LG16 CCAATTCATCGAAGTTTACATAGGG gtttcttGGCCAAAGTGCATGAGATGTAGT
TsuENH023 AB450706 LG3 LG3 TCTTCTTCACAGGTCACAACAGC gtttcttCTATGCGCTGCTTCTTGGTAGTC
TsuENH031 AB450711 LG14 LG14 CATTTCCTTAGCTCCCTCCAGTT gtttcttGAACCTTCCTCTTCCCATCACTT
TsuENH032 AB450712 LG14 LG14 AACTGGAGGGAGCTAAGGAAATG gtttcttCATCAAACAAAACTAGCCGAACC
TsuENH033 AB450713 LG17 LG17 CCTGAGGTTATTGACCCAAAAGA gtttcttGGTGGATACTCACTCAGTTGGAAA
TsuENH034 AB450714 LG8 LG8 GCCCCCAATATTTTCCCATTAT gtttcttGTTGGTGTTTGAGTCAACGTGAG
TsuENH042 AB450718 LG13, 16 LG16 AAAGCCGTACATTAGGCAAACC gtttcttAAAACTAGAACAGGCAGCCACAG
TsuENH043 AB450719 LG10 LG10 CATCTGCGTCCGGCAAAC gtttcttGCCCCCTGATATTCGTGGAT
TsuENH046 AB450722 LG6 LG6 GGTCATCACCCACTTAAAAACCA gtttcttGTGCCCTGAAGTAATTGAGATGG
TsuENH049 AB450724 LG1 LG1 CATCAGCCTACGAGCACATACAC gtttcttAGATTACGGCAACAGCAACAGAT
BMC Research Notes
200
9,
2
:18
2
http://ww
w.b
iomed
central.com/1
756
-0
500
/2
/18
2
Page
4
of
7
(page number not for citation purposes)
TsuENH058 AB450730 LG14 LG14 AGAAGAAGGATAAGAAGAAGGATGG gtttcttGTAACGAAAAGGAAACAGGACTTG
TsuENH060 AB450732 LG10 ATCTCCACCCAAGAAACCTTACC gtttcttGGGGGTGAGGAATAGATGTAACC
TsuENH062 AB450733 LG2 LG2 ACTCAGATCGTACGCAGAACAAA gtttcttCGATAAAGATCGATAATCCTCATGC
TsuENH066 AB450736 LG13 GTGGTGGAGGTGCGTATTGAC gtttcttCGAGGAAAAGTGCGACTCGT
TsuENH068 AB450738 LG5 CCAATTTTCTCTTCCTCCCTGTT gtttcttTTACAGTTATTGCCGAAGCCAAG
TsuENH076 AB450743 LG10 CATTAATACGCTGCTGTTTCTGC gtttcttACTTGAATTGGGGTAGGGATTGT
TsuENH079 AB450745 LG16 LG13 GCGGCTTCTTGGGAGAAGGT gtttcttGCATGCTCCTTTTGACAGCCTAC
TsuENH081 AB450747 LG13 GCTCTCCTCTTCTTCTCCCACTC gtttcttCCACCCTCGTCAAAATCAGAGTA
TsuENH082 AB450748 LG11 CACCAGTACTCCTGGAGGGTTTC gtttcttGTGCTCCTGCAACATTTTCTCC
TsuENH083 AB450749 LG11 LG11 ACTCTCCGCAAAACAATGTCGTA gtttcttTGTGAGAGTTTGAGGAGGAGAGC
TsuENH086 AB450751 LG5 LG5 CTCTGTTCTGCTTCGATTCTGCT gtttcttGTCCACGTTCACCATTTTTCAGT
TsuENH093 AB450757 LG15 LG8, LG15 GTGGAGATTTTCCGAGTCAAATG gtttcttAATAAGACTGCTGAGGGAATCCA
TsuENH096 AB450759 LG15 LG8 AGTGAGAGAGAGAGGCCTTGGTT gtttcttGCTCTTGCTCTGTCTTCGAAATG
[image:4.792.89.741.146.437.2]EST: expressed sequence tag. SSR: single sequence repeat. LG: linkage group.
BMC Research Notes 2009, 2:182 http://www.biomedcentral.com/1756-0500/2/182
Page 5 of 7
(page number not for citation purposes)
The alignment of the integrated pear and apple maps was performed using 102 SSR markers in common (Addi-tional file 1). Of these 102 markers, 90 (53 pear and 37 apple SSR) mapped at similar locations on homologous linkage groups in apple and pear, and three mapped in what are considered to be homoeologous linkage groups (i.e. LG 13 and LG 16; Figure 1). Eight SSR markers in common between apple and pear were mapped in
non-homologous and non-homoeologous linkage groups (Table 2).
Discussion
Apple and pear genome synteny
Alignment of the genetic linkage maps made it possible to validate a high degree of co-linearity between the apple and pear genomes (Additional file 1). All pear linkage
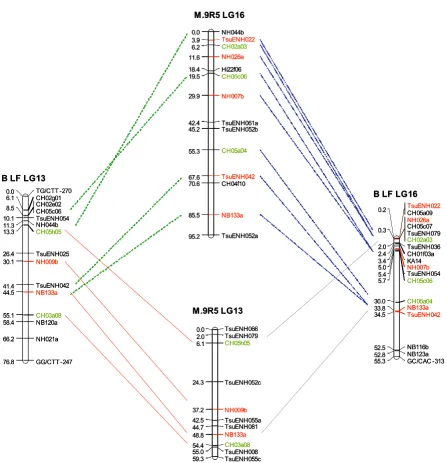
[image:5.612.80.528.88.551.2]Alignment of pear and apple linkage groups (LG) 13 and 16 showing inter-specific co-linearity and intra-specific LG homeology
Figure 1
Alignment of pear and apple linkage groups (LG) 13 and 16 showing inter-specific co-linearity and intra-specific LG homeology. Alignment of the apple (M.9 R5) and pear (B LF) consensus genetic maps. SSR markers in common between the linkage groups are linked to each other with a line and are presented in color. SSR markers developed from apple sequences are in green while SSR markers developed from pear sequences are in red. M.9: 'Malling 9'. R5: 'Robusta 5'; B: 'Bar-tlett'. LF: 'La France'. SSR: single sequence repeat.
TsuENH066 0.0 TsuENH079 2.0 CH05h05 6.1 TsuENH052c 24.3 NH009b 37.2 TsuENH055a 42.5 TsuENH081 44.7 NB133a 48.8 CH03a08 54.4 TsuENH008 55.0 TsuENH055c 59.3 M.9R5 LG13 TG/CTT -270 0.0 CH02g01 6.1 CH02e02 CH05c06 8.5 TsuENH054 10.1 NH044b 11.3 CH05h05 13.3 TsuENH025 26.4 NH009b 30.1 TsuENH042 41.4 NB133a 44.5 CH03a08 55.1 NB120a 58.4 NH021a 66.2 GG/CTT -247 76.8
B LF LG13
NH044b 0.0 TsuENH022 3.9 CH02a03 6.2 NH026a 11.6 Hi22f06 18.4 CH05c06 19.5 NH007b 29.9 TsuENH061a 42.4 TsuENH052b 45.2 CH05a04 55.3 TsuENH042 67.6 CH04f10 70.6 NB133a 85.5 TsuENH052a 95.2 M.9R5 LG16 TsuENH022 CH05a09 0.2 NH026a CH05c07 TsuENH079 CH02a03 0.3 TsuENH036 2.0 CH01f03a 2.4 KA14 3.4 NH007b 5.0 TsuENH054 5.4 CH05c06 5.7 CH05a04 30.0 NB133a 33.8 TsuENH042 34.5 NB116b 52.5 NB123a 52.8 GC/CAC -313 55.3
B LF LG16
TsuENH066 0.0 TsuENH079 2.0 CH05h05 6.1 TsuENH052c 24.3 NH009b 37.2 TsuENH055a 42.5 TsuENH081 44.7 NB133a 48.8 CH03a08 54.4 TsuENH008 55.0 TsuENH055c 59.3 M.9R5 LG13 TG/CTT -270 0.0 CH02g01 6.1 CH02e02 CH05c06 8.5 TsuENH054 10.1 NH044b 11.3 CH05h05 13.3 TsuENH025 26.4 NH009b 30.1 TsuENH042 41.4 NB133a 44.5 CH03a08 55.1 NB120a 58.4 NH021a 66.2 GG/CTT -247 76.8
B LF LG13
NH044b 0.0 TsuENH022 3.9 CH02a03 6.2 NH026a 11.6 Hi22f06 18.4 CH05c06 19.5 NH007b 29.9 TsuENH061a 42.4 TsuENH052b 45.2 CH05a04 55.3 TsuENH042 67.6 CH04f10 70.6 NB133a 85.5 TsuENH052a 95.2 M.9R5 LG16 TsuENH022 CH05a09 0.2 NH026a CH05c07 TsuENH079 CH02a03 0.3 TsuENH036 2.0 CH01f03a 2.4 KA14 3.4 NH007b 5.0 TsuENH054 5.4 CH05c06 5.7 CH05a04 30.0 NB133a 33.8 TsuENH042 34.5 NB116b 52.5 NB123a 52.8 GC/CAC -313 55.3
BMC Research Notes 2009, 2:182 http://www.biomedcentral.com/1756-0500/2/182
Page 6 of 7
(page number not for citation purposes)
groups could be successfully aligned to the 'M.9' × 'R5' consensus map by at least one SSR marker. The whole of the pear LG 8 and LG 15 could be aligned to their apple homologues using five and six SSR markers, respectively. Other pear linkage groups, such as LG 2, LG 4, LG 10, LG 14 and LG 16 were partially aligned to the apple consen-sus map (Additional file 1). Other portions of the genomes, such as LG 7, the top of LG 3 and LG 6, and the bottom of LG 12 and LG 14 still remain incompletely aligned, and these should become the focus of future research aimed at aligning the complete apple and pear genomes at the level of genetic markers.
In most instances, the order and distances between indi-vidual markers were similar for apple and pear, suggesting the presence of regions that are highly conserved between the two genomes. Some SSR markers demonstrated multi-locus amplification across the two genera, such as CH05c06, NH044b, NB133a, TsuENH042, TsuENH079 and TsuENH052, that mapped on both LG 13 and LG 16 in both apple and pear (Figure 1). A few apparent inver-sions in marker order can be observed in Additional file 1: (i) LG 1, KA4b is above TsuENH049 in pear; (ii) LG 2, TsuENH062 is above BGT23b in pear; (iii) LG 9, CH05c07 and CH01f03b are inverted in pear with respect to apple; (iv) LG 11, CH04h02 and TsuENH083 are inverted in pear; (v) LG 12, NH207a is above NZ28f04 in pear. These apparent inversions may be a consequence of the relatively small number of individuals used to map these markers, 55 to 63 individuals in the pear popula-tion, and 60 individuals for apple. The number of progeny individuals genotyped in the mapping populations will need to be increased in future studies in order to validate these possible marker inversions. Overall, a high level of
co-linearity between apple and pear genetic maps was confirmed.
As shown in Table 2, eight SSR markers mapped to non-homologous and possible uncharacterized homoeolo-gous linkage groups in apple and pear. Fragments obtained from PCR amplification of four loci (NH013a, NH045a, NB104a and TsuENH008) using apple DNA were cloned and sequenced (data not shown). Their sequences were checked for the presence of a SSR motif and then compared to the original pear sequence when available. The amplification products obtained in apple using NH013a, NH045a and TsuENH008 contained a SSR motif, whereas NB104a did not. The sequence for pear and apple NH013a and NH045a were highly similar, except at the level of the SSR motif, which was shorter for apple than pear for both loci. The apparent change in map location does not correspond to unspecific PCR amplifica-tion, but could have resulted from small regions of genome re-organization in apple and pear. However, the current density of markers in common between the two integrated maps presented in this study does not allow such an interpretation of the results for the present.
Genome synteny in the Maloideae
Extensive comparative mapping studies in plant families such as Solanaceae, Poaceae and Brassicaceae have con-sistently indicated that genome evolution within a family consists mainly of limited chromosome rearrangements, leading to the conservation of large chromosome frag-ments. Similar results have already been found in the Rosaceae within the genus Prunus [16,17], and have resulted in the complete alignment of the peach and apri-cot genomes [18]. Within the Maloideae, the results of our study confirm the high level of co-linearity between Malus and Pyrus genomes proposed by [2]. It is possible that fur-ther comparative mapping studies among ofur-ther members of the Maloideae, such as loquat and quince, will demon-strate that all members of this family should be consid-ered as a single genetic system. SSR markers from Malus have been used to construct the first genetic linkage map of loquat (Eriobotrya japonica) [19] and to conduct a diver-sity study in quince (Cydonia oblonga) [20].
[image:6.612.54.296.110.308.2]These findings could be the precursor to the development of a set of genetic markers common to all members of the Maloideae. Markers with multi-locus amplification across two genera, such as observed for CH05c06, NH044b, NB133a, TsuENH042, TsuENH079 and TsuENH052 that mapped on homeologous linkage groups LG 13 and LG 16 in both apple and pear (Figure 1), would be invaluable for this purpose. A comprehensive marker set would ena-ble a more efficient identification of loci for disease resist-ance and quality traits using comparative genome mapping across the Maloideae.
Table 2: SSR markers mapping in non-homologous and unknown homoeologous linkage groups in apple and pear
Apple LG Pear LG
CH-Vf1 1 10
NH041a 5/10 7
NH027a 6 15
NB104a 9 12
NH045 11 10
TsuENH008 13 9
NB111a 15 11
NH013a 17 1
BMC Research Notes 2009, 2:182 http://www.biomedcentral.com/1756-0500/2/182
Page 7 of 7
(page number not for citation purposes)
Conclusion
We have extended the list of SSR markers used for compar-ative genome mapping in the Maloideae, specifically for Malus and Pyrus. As the apple whole genome sequence will be available soon, we propose that apple should be used as the model for species in the Maloideae and that genetic information can be inferred in the other species by comparison of their genetic maps with that of apple. Fur-thermore, we suggest that this approach may be extended to include other members of the Rosaceae, such as Prunus, Rubus and Rosa.
Competing interests
The authors declare that they have no competing interests.
Authors' contributions
JMC tested and screened the pear SSR in apple; performed the genetic mapping analysis and map comparison, designed these experiments and prepared the manuscript. DC contributed to the experiments and the preparation of the manuscript. SDT provided plant material for the apple ('M.9' × 'R5') mapping population. ST, CN and TY devel-oped the pear SSR markers and the reference maps for pear (B LF). SEG was project leader. All authors have read and approved the manuscript.
Additional material
Acknowledgements
This worked was funded by a grant (contract number PREV0401) from the New Zealand Foundation for Research, Science and Technology, and Pre-var™ Limited, HortResearch internal funding and by a grant from the Min-istry of Agriculture, Forestry and Fisheries of Japan (Genomics for Agricultural Innovation, DD-4040).
We thank Dr VGM Bus, JM Bushakra and RV Espley for helpful editing of the manuscript.
References
1. Bonierbale MW, Plaisted RL, Tanksley SD: RFLP maps based on a common set of clones reveal modes of chromosomal evolu-tion in potato and tomato. Genetics 1988, 120(4):1095-1103. 2. Yamamoto T, Kimura T, Saito T, Kotobuki K, Matsuta N, Liebhard R,
Gessler C, Weg E Van de, Hayashi T: Genetic linkage maps of
Jap-anese and European pears aligned to the apple consensus map. Acta Horticulturae 2004, 663:51-56.
3. Gardiner SE, Bus VGM, Rusholme RL, Chagné D, Rikkerink EHA: Genome mapping and molecular breeding in plants. In Fruit and NutsVolume 4. Edited by: Kole C. Springer, Berlin; 2007:1-62. 4. Itai A: Genome mapping and molecular breeding in plants. In
Fruit and Nuts Volume 4. Edited by: Kole C. Springer, Berlin; 2007:157-170.
5. Tatum TC, Stepanovic S, Biradar DP, Rayburn AL, Korban SS: Varia-tion in nuclear DNA content in Malus species and cultivated apples. Genome 2005, 48:924-930.
6. Arumanagathan K, Earle ED: Nuclear DNA content of some important plant species. Plant Mol Biol Rep 1991, 9:229-241. 7. Wolfe JA, Wehr W: Rosaceous Chamaebatiaria -like foliage
from the paleogene of western North America. Aliso 1988, 12:177-200.
8. Liebhard R, Koller B, Gianfranceschi L, Gessler C: Creating a satu-rated reference map for the apple (Malus × domestica
Borkh.) genome. Theor Appl Genet 2003, 106:1497-1508. 9. Yamamoto T, Kimura T, Terakami S, Nishitani C, Sawamura Y, Saito
T, Kotobuki K, Hayashi T: Integrated genetic linkage maps for pear based on SSR and AFLP markers. Breeding Science 2007, 57:321-329.
10. Pierantoni L, Cho K-H, Shin I-S, Chiodini R, Tartarini S, Dondini L, Kang S-J, Sansavini S: Characterisation and transferability of apple SSRs to two European pear F1 populations. Theoretical and Applied Genetics 2004, 109:1519-1524.
11. Silfverberg-Dilworth E, Matasci CL, Weg WE Van de, Van Kaauwen MPW, Walser M, Kodde LP, Soglio V, Gianfranceschi L, Durel CE, Costa F, et al.: Microsatellite markers spanning the apple (Malus × domestica Borkh.) genome. Tree Genetics and Genomes
2006, 2(4):202-224.
12. Celton J-M, Tustin DS, Chagné D, Gardiner SE: Construction of a dense genetic linkage map for apple rootstocks using SSRs developed from Malus ESTs and Pyrus genomic sequences.
Tree Genetics and Genomes 2009, 5:93-107.
13. Gianfranceschi L, Seglias N, Tarchini R, Komjanc M, Gessler C: Sim-ple sequence repeats for the genetic analysis of apSim-ple. Theo-retical and Applied Genetics 1998, 96(8):1069-1076.
14. Van Ooijen JW, Voorrips RE: JoinMapR 3.0: Software for the cal-culation of genetic linkage maps. Wageningen, The Nether-lands. 1998.
15. Voorrips RE: MapChart version 2.0: windows software for the graphical presentation of linkage maps and QTLs. Plant Research International, Wageningen, The Netherlands. 1998.
16. Dirlewanger E, Graziano E, Joobeur T, Garriga-Caldere F, Cosson P, Howad W, Arus P: Comparative mapping and marker-assisted selection in Rosaceae fruit crops. PNAS 2004, 101(26):9891-9896.
17. Vilanova S, Sargent D, Arus P, Amparo M: Synteny conservation between two distantly-related Rosaceae genomes: Prunus (the stone fruits) and Fragaria (the strawberry). BMC Plant Biology 2008, 8:67.
18. Dondini L, Lain O, Geuna F, Banfi R, Gaiotti F, Tartarini S, Bassi D, Testolin R: Development of a new SSR-based linkage map in apricot and analysis of synteny with existing Prunus maps.
Tree Genetics and Genomes 2007, 3:239-249.
19. Gisbert AD, Martinez-Calvo J, Llacer G, Badenes ML, Romero C: Development of two loquat [Eriobotrya japonica (Thunb.) Lindl.] linkage maps based on AFLPs and SSR markers from different Rosaceae species. Molecular Breeding 2009, 23:523-538. 20. Yamamoto T, Kimura T, Soejima J, Sanada T, Ban Y, Hayashi T: Iden-tification of quince varieties using SSR markers developed from pear and apple. Breeding Science 2004, 54(3):239-244.
Additional file 1
Alignment of the 17 linkage groups (LG) of apple and pear. The figure provided represents the alignment of the apple (M.9 R5) and pear (B LF) consensus genetic maps. SSR markers in common between the maps are linked to each other with a black line and are presented in color. SSR markers developed from apple sequences are in green while SSR markers developed from pear sequences are in red. M.9: 'Malling 9'. R5: 'Robusta 5'; B: 'Bartlett'. LF: 'La France'. SSR: single sequence repeat.
Click here for file