Quarterly Economic
Commentary
Joseph Durkan
Cormac O’Sullivan
Spring 2011
The forecasts in this Commentary are based on data available by
early-May 2011. Draft completed 6
thMay 2011.
Research Bulletin
11/1
Editor:
Tim Callan
Authors
Joseph Durkan is an Associate Research Professor and Editor of the Commentary, Cormac O’Sullivan is a Research Assistant at the Economic and Social Research Institute (ESRI).
The Commentary and Research Bulletin contained within have been accepted for publication by the Institute, which is not responsible for either the content or the views expressed.
Table of Contents
Page
QUARTERLY ECONOMIC COMMENTARY
Joseph Durkan, Cormac O’Sullivan
SUMMARY TABLE iv
SUMMARY 1
1. INTRODUCTION 6
2. EXPORTS OF GOODS AND SERVICES 9
3. INVESTMENT 15
4. HOUSEHOLD CONSUMPTION 18
5. PUBLIC FINANCES 28
6. EMPLOYMENT AND UNEMPLOYMENT,EARNINGS AND PRICES 32
7. IMPORTS AND THE BALANCE OF PAYMENTS 36
8. OVERALL OUTPUT 38
9. BANKING CRISIS AND THE REAL ECONOMY 41
10. GENERAL ASSESSMENT 45
RESEARCH BULLETIN 11/1
49Equality and Discrimination: Lessons from a Research Programme and a Conference
Frances McGinnity and Helen Russell 51
Creating a Health Promoting Environment: The Role of Food Access
Richard Layte 57
The Changing Workplace
Dorothy Watson, Helen Russell, Philip J. O’Connell 61
Support from Grandparents to Families with Infants
Summary Table
2009 2010 2011(f) 2012(f)
OUTPUT
(Real Annual Growth %)
Private Consumer Expenditure -7.0 -1.2 0 2 Public Net Current Expenditure -4.4 -2.2 -2 -4
Investment -31.0 -27.9 -10¼ -2
Exports -4.1 9.4 7½ 7½
Imports -9.7 6.6 6 6¼
Gross Domestic Product (GDP) -7.6 -1.0 2 3 Gross National Product (GNP) -10.7 -2.1 ½ 2 GNP per capita (constant prices) -11.4 -2.3 ¾ 1¾
PRICES
(Annual Growth %)
Harmonised Index of Consumer Prices (HICP) -1.7 -1.6 1½ 1
Consumer Price Index (CPI) -4.5 -1.0 2½ 1½
Wage Growth -0.8 -1.7 ¾ ¾
LABOUR MARKET
Employment Levels (ILO basis (000s)) 1,929 1,848 1,820 1,825 Unemployment Levels (ILO basis (000s)) 259 292 304 295 Unemployment Rate (as % of Labour Force) 11.8 13.6 14¼ 14
PUBLIC FINANCE
1
Summary
The set of forecasts in this Commentary describe an economy in transition. This transition is from an economy where growth was led by domestic demand to one where export growth by both multinational and local firms will become the engine of growth. This transition is underway as domestic firms in the tradable goods sector have sought to replace falling domestic demand by sales in overseas markets. Output and exports from traditional firms increased in 2010, with exports from the food and drink sectors in particular rising by 11 per cent in value terms. This is very similar to the experience of the 1980s, when exports led growth, and the reverse of what happened in the 2000s when the strong growth in domestic demand led firms to shift their emphasis from exports to the domestic market.
While in 2010 the shift to exports was not sufficient to counteract the decline in domestic demand following a rise in the personal savings rate and the 2010 contractionary budget, we expect some very modest growth this year with GNP (GDP) rising by about ½ (2) per cent, and strengthening in 2012 to 2 (3) per cent. This year the stimulus is coming entirely from the external sector (both service and merchandise exports) as domestic demand will fall again, along with investment and government current expenditure. We expect household expenditure to rise very modestly during the year, following what looks like a slight rise in household spending in the first quarter. Households have been reducing their indebtedness very sharply since 2008 and some households may now be satisfied with their net debt position. Consequently, we expect a decline in the savings rate in 2012. Domestic demand will be very slightly positive in 2012, while we expect external demand to grow by 7½ per cent in both 2001 and 2012.
A feature of the forecast is that the balance of payments on the current account is expected to be in surplus both this year and next, amounting to 1.2 per cent and 2.8 per cent of GNP respectively. These surpluses represent net savings by society and are a big change in the position since the early 2000s when the balance of payments on the current account went into deficit.
2
pattern will be very uneven during the year as oil prices are rising in the first half of the year but could fall back in the second half. Of greater importance may be shifting by consumers to lower priced products and outlets as price variations across goods and services remain very large. The deflator for total household consumption is expected to remain at the 2010 average level in 2011, but to increase by about 1 per cent in 2012.
We expect total employment to fall again in 2011, but at a much slower pace than in recent years. Unemployment will be higher on average than in 2010, but the extent of it will be moderated by migration. The extent of the latter will become clearer when the first 2011 census results become available. Nevertheless, it is worth noting that there are emerging skill shortages in some of the fast growing services exports sector.
The Public Finance position remains challenging. It is still too early to form a definitive view about the likely outcome for this year, but the Budget figures, modified to take account of the increased interest costs associated with the recent bank restructuring, look achievable. We think that, given the need to return to financial markets within a very short period, attempts should be made to correct the budget deficit more rapidly than currently envisaged. In particular proposed capital expenditures should be examined more critically now, given the increased cost of funds and the lower level of income and output currently prevailing. Current expenditure also needs to be examined both to eliminate waste and to be consistent with the new lower level of output in the economy. The medium-term profile for the budgetary aggregates set out in Ireland –
Stability Programme Update will lead to a sustainable debt position.
Attempts at EU and ECB level to contain the banking crisis within the countries most directly affected do not take account of the spillover effects of the initial problem and the solution currently in place. What is needed is an EU or Eurozone solution that does not place the whole of the burden of recapitalising banks onto national budgets already stretched by recession.
3
NATIONAL ACCOUNTS 2010 (Estimate)
A: Expenditure on Gross National Product
2009 2010 Change in 2010
Estimate Estimate %
€bn €bn Value Price Volume
.Private Consumer Expenditure 84.3 81.4 -3.4 -2.2 -1.2 .Public Net Current Expenditure 27.7 26.0 -6.2 -4.1 -2.2 .Gross Fixed Capital Formation 24.7 17.5 -29.5 -2.2 -27.9 .Exports of Goods and Services (X) 144.8 158.4 9.4 0 9.4 .Physical Changes in Stocks -2.3 -0.8
.Final Demand 279.3 282.5 1.1 -0.8 2.0
.less:
.Imports of Goods and Services (M) 120.4 129.3 7.4 0.8 6.6
.Statistical Discrepancy 0.7 0.7 - -
.GDP at Market Prices 159.6 153.9 -3.6 -2.6 -1.0
.less:
.Net Factor Payments (F) 28.4 29.1 - - -
.GNP at Market Prices 131.2 124.9 -4.9 -2.9 -2.1
B: Gross National Product by Origin
2009 2010 Change in 2010
Estimate Estimate
€bn €bn €bn %
.Agriculture, Forestry, Fishing 2.2 2.7 0.5 22.7 .Non-Agricultural: Wages, etc. 72.7 68.8 -3.9 -5.4
Other: 53.9 51.8 -2.1 -3.9
.Adjustments: Stock Appreciation 1.0 1.0 0.0 - Statistical Discrepancy -0.7 -0.7 0.0 -
.Net Domestic Product 129.1 123.6 -5.5 -4.3
.less:
.Net Factor Payments 28.4 29.1 0.7 -
.National Income 100.7 94.5 -6.2 -6.2
.Depreciation 14.8 15.0 0.2 -
.GNP at Factor Cost 115.5 109.5 -6.0 -5.2
.Taxes less Subsidies 15.8 15.4 -0.4 -
.GNP at Market Prices 131.2 124.9 -6.3 -4.9
C: Balance of Payments on Current Account
2009 2010 Change in 2010
Estimate Estimate
€m €m €m
.Exports (X) less Imports (M) 24.4 29.1 +4.7 .Net Factor Payments (F) -28.4 -29.1 -0.7
.Net Transfers -0.9 -1.1 -0.2
.Balance on Current Account -4.9 -1.1 +3.8
4
FORECAST NATIONAL ACCOUNTS 2011
A: Expenditure on Gross National Product
2010 2011 Change in 2011
Estimate Estimate %
€bn €bn Value Price Volume
Private Consumer Expenditure 81.4 81.4 0 0 0
Public Net Current Expenditure 26.0 25.5 -2.0 0 -2.0 Gross Fixed Capital Formation 17.4 15.7 -10.2 0 -10.3 Exports of Goods and Services (X) 158.4 172.0 8.6 1 7.5
Physical Changes in Stocks -0.8 0.5 - - -
Final Demand 282.5 295.1 4.5 0.8 3.6
less:
Imports of Goods and Services (M) 129.3 137.7 6.5 0.6 6.0
Statistical Discrepancy 0.7 0.7 - - -
GDP at Market Prices 153.9 158.1 2.7 0.6 2.0
less:
Net Factor Payments (F) 29.1 31.8 - - -
GNP at Market Prices 124.9 126.3 1.2 0.6 0.5
B: Gross National Product by Origin
2010 2011 Change in 2011
Estimate Forecast
€bn €bn €bn %
Agriculture, Forestry, Fishing 2.7 3.0 0.3 11.1 Non-Agricultural: Wages, etc. 68.7 68.0 -0.7 -1.0
Other: 51.8 55.4 3.6 7.0
Adjustments: Stock Appreciation 1.0 1.0 0.0 - Statistical Discrepancy -0.7 -0.7 0.0 -
Net Domestic Product 123.5 126.7 3.2 2.6
less:
Net Factor Payments 29.1 31.8 2.7 -
National Income 94.4 94.8 0.4 0.5
Depreciation 15.0 15.1 0.1 0.5
GNP at Factor Cost 109.4 109.9 0.5 0.5
Taxes less Subsidies 15.4 16.4 0.9 -
GNP at Market Prices 124.9 126.3 1.5 1.2
C: Balance of Payments on Current Account
2010 2011 Change in 2011
Estimate Forecast
€m €m €m
Exports (X) less Imports (M) 29.1 34.3 5.2
Net Factor Payments (F) -29.1 -31.8 -2.7
Net Transfers -1.2 -1.0 0.2
Balance on Current Account -1.1 1.5 2.6
5
FORECAST NATIONAL ACCOUNTS 2012
A: Expenditure on Gross National Product
2011 2012 Change in 2012
Estimate Estimate %
€bn €bn Value Price Volume
Private Consumer Expenditure 81.4 83.8 2.9 0.9 2.0 Public Net Current Expenditure 25.5 24.5 -3.9 0 -3.9 Gross Fixed Capital Formation 15.7 15.6 -0.6 1.3 -1.9 Exports of Goods and Services (X) 172.0 186.7 8.5 1.0 7.4
Physical Changes in Stocks 0.5 0.5 - - -
Final Demand 295.1 311.1 5.4 1.1 4.3
less:
Imports of Goods and Services (M) 137.7 147.7 7.2 1.0 6.2
Statistical Discrepancy 0.7 0.7 - - -
GDP at Market Prices 158.1 164.1 3.8 0.7 3.0
less:
Net Factor Payments (F) 31.8 34.4 - - -
GNP at Market Prices 126.3 129.7 2.7 0.8 1.9
B: Gross National Product by Origin
2011 2012 Change in 2012
Estimate Forecast
€bn €bn €bn %
Agriculture, Forestry, Fishing 3.0 3.1 0.1 3.3 Non-Agricultural: Wages, etc. 68.0 68.7 0.7 1.0
Other: 55.4 60.3 4.9 8.8
Adjustments: Stock Appreciation 1.0 1.0 - - Statistical Discrepancy -0.7 -0.7 - -
Net Domestic Product 126.7 132.3 5.7 4.5
less:
Net Factor Payments 31.8 34.4 2.6 -
National Income 94.8 98.0 3.1 3.3
Depreciation 15.1 15.1 0.0 -
GNP at Factor Cost 109.9 113.0 3.1 2.8
Taxes less Subsidies 16.2 16.5 0.3 -
GNP at Market Prices 126.3 129.7 3.4 2.7
C: Balance of Payments on Current Account
2011 2012 Change in 2012
Estimate Forecast
€m €m €m
Exports (X) less Imports (M) 34.3 39.0 4.7 Net Factor Payments (F) -31.8 -34.4 -2.6
Net Transfers -1.0 -1.0 0.0
Balance on Current Account 1.5 3.6 2.1
6
1. Introduction
The basic theme of this Commentary is that the Irish economy is in the process of transition. This transition is from an economy where domestic demand was the engine of growth back to one where export growth, from both multinational and indigenous firms, becomes the main driver of the economy. The growth in exports from indigenous firms in 2010 represents a shift in their focus in response to weak domestic demand. The situation is comparable to that of the 1980s where export demand led the recovery1 and lay at the heart of the performance of the economy from the mid 1980s for more than a decade. The external environment was more favourable in the 1980s as the UK, which was the main market for Irish goods and services, was experiencing a rapid growth phase (the “Lawson Boom”), whereas now the main markets are still experiencing some effects of the Great Recession.
T
HEM
ACROP
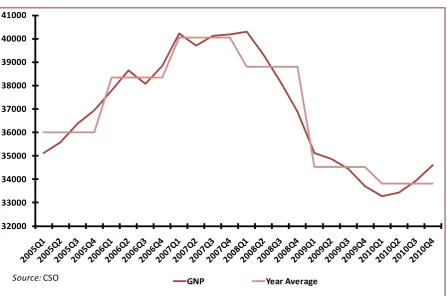
ICTUREFigure 1 shows the path of the economy (GNP) since the middle of the last decade. It is apparent that the economy was fairly flat in 2007. This was followed by a catastrophic fall in output in 2008 which continued into 2009 and 2010. The decline in output from 2007 to the trough in the first quarter of 2010 was 16.6 per cent.
While the economy experienced a decline in output for 2010 as a whole, GNP increased in each of the final three quarters of 2010. This resulted in a positive carryover into 2011 at 2.4 per cent. This contrasts with a negative carryover of 2.4 per cent into 2010 which was associated with a decline in output of 2.1 per cent for the year. Figure 1 also shows average quarterly GNP for each year, which allows us to see this positive carryover from 2010 to 2011.2
1
Durkan, Joseph (1992). “Recovery, recession and recovery again: some aspects of Irish economic performance and prospects 1986-1993.” University College Dublin, Centre for Economic Research Policy paper PP92/3.
2
7
32000 33000 34000 35000 36000 37000 38000 39000 40000 41000
GNP Year Average
Source:CSO
[image:11.595.76.524.187.483.2]The forecasts in this Commentary are that GNP will grow by about ½ per cent this year, with the positive carryover pulled back by the cuts in expenditure and tax increases in the December Budget. For 2012 the growth rate forecast is 2 per cent; it is also limited by the fiscal consolidation required by the EU/IMF bailout.
Figure 1: Quarterly GNP and Year Average, Constant Prices (€000’s)
The factors that lie behind the fall in output since 2007 have been widely discussed. First, there was a collapse in the construction sector following the bursting of the property bubble. Second, there was the consequent contractionary fiscal policy as government sought to reduce the fiscal deficit and to provide funding for bank restructuring. Third, there was the increase in the personal savings rate from 5.6 per cent in 2008 to an estimated 13 per cent and 14 per cent in 2009 and 2010 respectively as people have sought to repair damaged balance sheets and guard against negative income shocks.
8
9
2. Exports of Goods and
Services
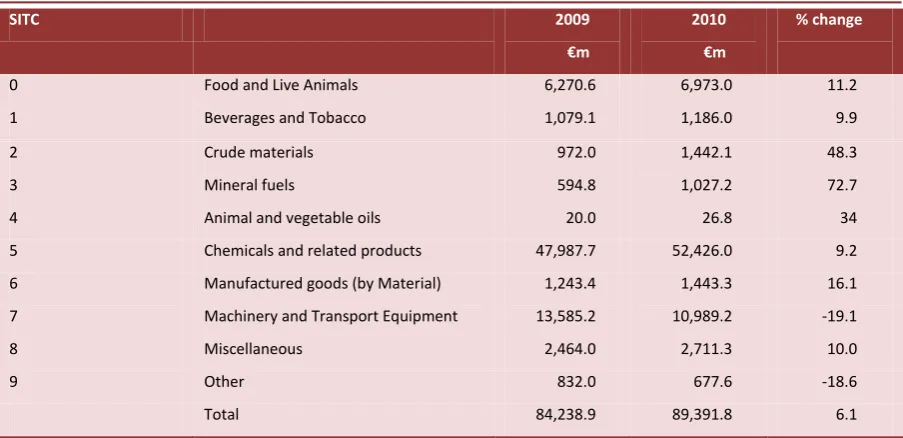
[image:13.595.72.524.375.594.2]The overall volume of exports of goods and services increased by 9.4 per cent in 2010, following declines in 2008 and 2009, and was 4.2 per cent above the previous peak level in 2007. Merchandise exports increased by 7.7 per cent in volume terms. Table 1 below shows the level of exports of goods in 2009 and 2010 and the percentage change organised by SITC Section. The data indicate an increase of 6.1 per cent in total merchandise exports in 2010, with considerable variation on growth rates across categories.3
Table 1: Merchandise Exports by Category (Value)
SITC 2009
€m
2010
€m
% change
0 Food and Live Animals 6,270.6 6,973.0 11.2
1 Beverages and Tobacco 1,079.1 1,186.0 9.9
2 Crude materials 972.0 1,442.1 48.3
3 Mineral fuels 594.8 1,027.2 72.7
4 Animal and vegetable oils 20.0 26.8 34
5 Chemicals and related products 47,987.7 52,426.0 9.2
6 Manufactured goods (by Material) 1,243.4 1,443.3 16.1
7 Machinery and Transport Equipment 13,585.2 10,989.2 -19.1
8 Miscellaneous 2,464.0 2,711.3 10.0
9 Other 832.0 677.6 -18.6
Total 84,238.9 89,391.8 6.1
Source: CSO.
Modern sector exports (corresponding to Chemicals, some part of Machinery and Transport equipment and Miscellaneous), which are primarily produced by multinationals, account for the bulk of merchandise exports, and these exports
3
10
are heavily concentrated in SITC 6 and 7. We estimate that the value of these exports increased by 4 per cent from 2009 to 2010, while all other exports increased in value by 12.5 per cent. In effect, the growth rate of non-modern exports exceeded that of modern sector exports. These other exports are produced in the main by indigenous and traditional firms, concentrated in SITC Sections 0-2, 4, and parts of 6, 7 and 8. Table 1 shows these growth rates; for example, food exports (the value of live animal exports is very small) increased by 11.2 per cent, while beverage exports rose by 9.9 per cent and similar increases were recorded by other traditional sectors.
Following the approach adopted with exports, we categorise production data from the CSO into modern and traditional sectors. These data show that output volumes in the modern sector increased by 10.7 per cent in 2010 following an increase of 2.6 per cent in 2009, while output in the traditional sector rose by 1.9 per cent following a fall of 14.1 per cent in 2009. If we exclude the production of construction related output then traditional sector output rose by around 3.1 per cent. There were quite divergent patterns in price changes between the modern and traditional sectors. In the pharmaceuticals sector for instance there were significant price falls while there were significant price increases in the dairy sector.
A combination of these two patterns, against a background where domestic demand is falling [See Table 4], suggests that traditional sector firms have increased output which has gone into export sales. This was facilitated by the improvement in competitiveness over the past three years and by an improvement in other costs relative to competitor countries. This is the classic ‘expenditure shifting’ that governments hope for when reducing domestic demand to correct a payments deficit or when correcting a budget deficit leads to a reduction in domestic demand.
This shifting to export markets by traditional firms is an important positive signal of Ireland returning to export led growth. This finding is not surprising as previous research (Durkan, 1992) shows similar patterns of behaviour. This is not to say that all firms are successfully exporting but rather that sufficient numbers are exporting to more than compensate for those firms that have reduced output and exports. This finding is also consistent with the findings of Gleeson and Ruane4 which show that Irish firms have been able to enter and then re-enter
4
11
export markets even at a time when total export sales were contracting. A key issue for policy is to explore how this shift into exporting by Irish firms can be strengthened.
E
XPORTS OFG
OODS ANDS
ERVICES IN2011
AND2012
The world economy continues to grow with the developed economies recovering well, albeit more slowly than in previous economic recoveries. The UK economy also seems set to maintain some growth in spite of the demand deflationary impact of budget measures by the new government and the short-term shock to that economy due to very adverse weather conditions in the final quarter of 2010 and the first quarter of 2011. World output in the first quarter of 2011 has been adversely affected by the earthquake in Japan and political changes in North Africa. The latter may be resolved by the second half of this year, while the effect of the former is uncertain – clearly the loss of life will affect output, and some part of the capital stock is now gone. The earthquake has also caused some disruption to the global supply chain, though it now seems, not as much as originally feared. Reconstruction will lead to increased economic activity to replace lost capital. While there are serious international difficulties, the world economy is performing reasonably well and is not facing the declines in trade experienced in 2008/2009.
The relationship between merchandise trade data and merchandise trade data adjusted for balance of payments purposes for Ireland is no longer as clear-cut as previously thought. The multinational sector adopts a variety of approaches to the recorded relationship between the company operating in Ireland, the parent and its subsidiaries and third parties which affect exports and imports of goods, exports and imports of services and factor income flows. Ideally, we would like a complete analysis of these relationships to separate out the balance of payments impact and the domestic value added impact, but the published data do not permit this. Merchandise exports adjusted for balance of payments purposes were fairly flat during 2010, though running at much higher levels than in 2009.
12
The structure of exports from Ireland, with a heavy emphasis on pharmaceuticals, reduces the sensitivity of Irish exports to world income changes. In terms of supply capacity, in addition to the factors mentioned earlier, the critical issue in this sector is the effect of restructuring arising from mergers. This has led to some reduction in output and employment, but has resulted in a more efficient set of firms. We would expect an increase in modern sector output and exports of some 5 per cent this year and about the same in 2012. Output prices for the modern sector may continue to decline.
Traditional sector exports are also likely to grow very well. We expect domestic firms to continue to increase sales in overseas markets, building on their performance in 2010. The key sectors are food, drink and other non-construction related manufacturing. Since these exports are still relatively small in relation to the markets in which these firms are operating, volume increases of 7.5 per cent both this year and next are not unrealistic, given that the supply capacity is available. There may be some constraint in milk as the milk quota was reached in the 2010/2011 milk quota year, though there could easily be further shifting to higher value dairy products. Prices particularly for food and food related products are likely to continue to increase perhaps by as much as 4 per cent in both 2011 and 2012. Overall prices for merchandise exports are not expected to change by much though, as noted above, there will be differences between the traditional and modern sectors.
Exports of services recovered well in 2010, increasing by 11.5 per cent in volume terms on 20095 and running well above the previous peak in 2007, in spite of a continued decline in tourism receipts. As noted above, exports of services reflect the diversity of arrangements within the multinational sector as well as straightforward services. These latter lie behind the growth of the recent past and will generate continued growth in the future. Within exports of services, computer services account for almost 40 per cent of the total and these increased by a sixth in 2010 in nominal terms, while business services account for about one-third of the total and increased by about 10 per cent in 2010. The services sector has seen new overseas firms being established here and the expansion of existing firms so that the capacity is there for further increases in exports.6 In addition, Irish service sector firms have turned more to overseas markets given the weakness here, much like the manufacturing sector. Thus, exports of services could easily see a growth of 9-10 per cent in value and volume in both 2011 and 2012.
5
CSO, Quarterly National Accounts, Quarter 4 2010 and year 2010.
6
13
Tourism receipts are more difficult to anticipate. The number of trips to Ireland in 2010 was 25 per cent below the peak level reached in 2007 and has declined now for three years in a row, with the associated expenditure falling by slightly more. The greater part of the decline has been in visits from Britain and this has been among those holidaying here rather than visiting friends and relatives. There are obvious reasons why Ireland would be a natural destination for British tourists – language and proximity, among others. Against this the price level in Ireland and poor growth in disposable incomes in Britain have acted to reduce numbers, and there may also have been a change in preferences once the “growth miracle” collapsed. As part of the adjustment underway in the economy there has been a very large decline in hotel prices and in the costs of eating out, and a reduction in the overall price level. Both now seem to have stabilised. Together these have improved the cost competitiveness of Ireland vis-à-vis other countries. The critical issue for UK visitors is whether their increasing awareness of the change in the competitiveness of the tourist sector in Ireland is sufficient to outweigh the other negative factors, particularly the uncertainty surrounding the development of the UK economy. Awareness is likely to improve given the forthcoming visits of President Obama and Queen Elizabeth, though how and when this might translate into increased tourism is uncertain.
There was a slight change in the trend in the total number of visitors to Ireland in the final quarter of 2010 with an increase in numbers following the declines that had been there since 2007. Given these factors, we expect an increase in visitor numbers, with expenditure growing by 7¾ in volume terms in both years.
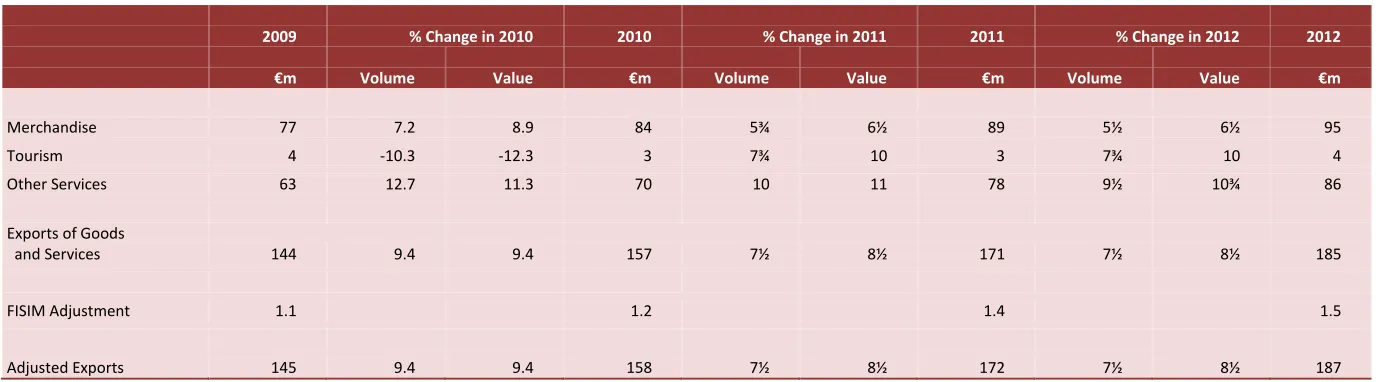
Table 2 : Exports of Goods and Services
2009 % Change in 2010 2010 % Change in 2011 2011 % Change in 2012 2012
€m Volume Value €m Volume Value €m Volume Value €m
Merchandise 77 7.2 8.9 84 5¾ 6½ 89 5½ 6½ 95
Tourism 4 -10.3 -12.3 3 7¾ 10 3 7¾ 10 4
Other Services 63 12.7 11.3 70 10 11 78 9½ 10¾ 86
Exports of Goods
and Services 144 9.4 9.4 157 7½ 8½ 171 7½ 8½ 185
FISIM Adjustment 1.1 1.2 1.4 1.5
15
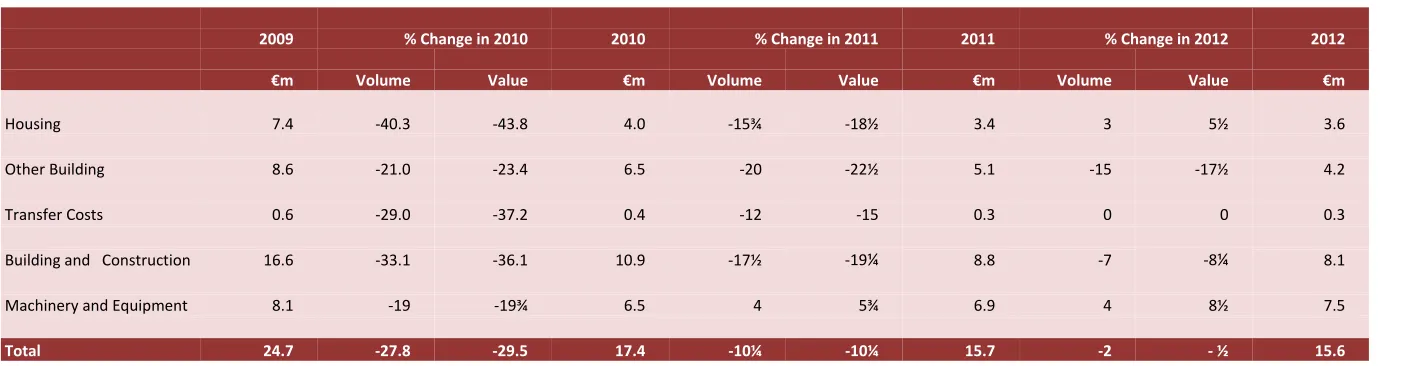
3. Investment
Total Investment fell by 27.8 per cent in volume terms in 2010.7 In volume terms, the building and construction component declined by over 30 per cent while machinery and equipment and other elements of investment fell by over 15 per cent. Within the building and construction sector,8 housing fell by 40.3 per cent in volume terms, civil engineering works by 21 per cent and the remainder by 30.6 per cent. There is less detailed information on other investment expenditure, but there were declines in expenditure on transport equipment, and in other machinery and equipment.
Investment has declined for every quarter since mid-2007 and this is set to continue – albeit at a moderated pace – as the overall investment outlook is unlikely to improve in the next 2-3 years. Housing output may decline further, both because of the number of unsold houses (new and second-hand) available for sale and because of the difficulties of raising finance. Civil engineering works are heavily influenced by the Public Capital Programme, and this has been cut back in nominal terms this year and next. The fall in the Public Capital Programme between 2010 and 2011 is 27.7 per cent.9 Even allowing for declines in contract prices there are clearly some big volume declines implicit in these figures. Actual public expenditure this year may also turn out to be less than budgeted as the need for fiscal consolidation may pressurise government to delay or abandon the start of any new capital projects.
For new service sector firms or the expansion of existing ones, there is an abundance of empty office space, so that additional investment expenditure is unlikely to be needed for some time. As international services increase there is likely to be continued take-up of existing empty spaces, but this can run for some years yet before additional investment is required.
Investment in the manufacturing sector may improve as expansion of existing facilities is undertaken, as new manufacturing firms begin their operations, and
7
CSO, Quarterly National Accounts Quarter 4 2010 and year 2010.
8
CSO, Production in Building and Construction Index Quarter 4 2010.
9
16
Table 3 : Gross Fixed Capital Formation
2009 % Change in 2010 2010 % Change in 2011 2011 % Change in 2012 2012
€m Volume Value €m Volume Value €m Volume Value €m
Housing 7.4 -40.3 -43.8 4.0 -15¾ -18½ 3.4 3 5½ 3.6
Other Building 8.6 -21.0 -23.4 6.5 -20 -22½ 5.1 -15 -17½ 4.2
Transfer Costs 0.6 -29.0 -37.2 0.4 -12 -15 0.3 0 0 0.3
Building and Construction 16.6 -33.1 -36.1 10.9 -17½ -19¼ 8.8 -7 -8¼ 8.1
Machinery and Equipment 8.1 -19 -19¾ 6.5 4 5¾ 6.9 4 8½ 7.5
18
4. Household Consumption
Household spending fell by 3.4 per cent in nominal terms in 2010, well down on the fall in 2009 of 11.1 per cent. In volume terms the declines were 7.0 per cent in 2009 and 1.2 per cent in 2010, which represented the third year in a row that household spending fell in volume terms. Since the end of 2007 there have been declines in spending in nine of the twelve quarters to end-2010, at which point the level was back at about end-2005/early 2006 levels.
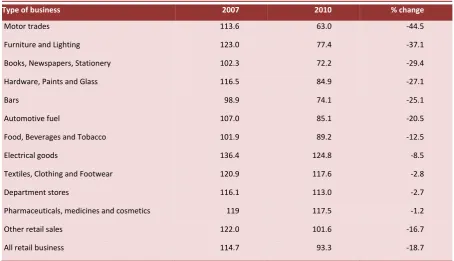
There are two main sources of data on household spending: the retail sales index, which looks at sales type of business and is available monthly, and the household expenditure by types of goods and services which is available on an annual basis. The data are not ideal for measuring household consumption as expenditure under both these headings includes spending by tourists to Ireland, which has fallen in recent years by more than the decline in domestic consumption, as indicated above. Nevertheless, from the retail sales data we can see that expenditure has fallen since the peak in 2007 and has declined by vastly different amounts by type of retail outlet (see Table 4).
19
Table 4: Retail Sales in 2007 and 2010 (2005=100)
Type of business 2007 2010 % change
Motor trades 113.6 63.0 -44.5
Furniture and Lighting 123.0 77.4 -37.1
Books, Newspapers, Stationery 102.3 72.2 -29.4
Hardware, Paints and Glass 116.5 84.9 -27.1
Bars 98.9 74.1 -25.1
Automotive fuel 107.0 85.1 -20.5
Food, Beverages and Tobacco 101.9 89.2 -12.5
Electrical goods 136.4 124.8 -8.5
Textiles, Clothing and Footwear 120.9 117.6 -2.8
Department stores 116.1 113.0 -2.7
Pharmaceuticals, medicines and cosmetics 119 117.5 -1.2
Other retail sales 122.0 101.6 -16.7
All retail business 114.7 93.3 -18.7
Source: CSO.
Detailed household expenditure data by type of good are only available up to 2009.10 These data are much broader in coverage than retail sales but the picture by expenditure head is similar. They show that expenditure on public transport and communications fell. Housing, which includes imputed rent, private and public rents and repairs, increased. Some services, including education, also increased in volume terms.
The decline in household expenditure was particularly marked in 2009 and was associated with a rise in the savings rate from 5.2 per cent of disposable income in 2008 to about 13 per cent in 200911 and about 14 per cent in 2010. The increase in the savings rate has been ascribed to increased uncertainty about post-tax incomes and employment maintenance as the necessary fiscal correction gets underway. There could be other factors at work, in particular the need by borrowers to reduce the level of their indebtedness to sustainable levels and the need by those on tracker mortgages to provide for inevitable increases in mortgage interest rates. A rise in the savings rate in these circumstances is not unusual. What is unusual is that it had fallen to 3.6 per cent of disposable income in 2007. This 2007 figure is an average across all households. Those who normally
10
CSO, National Income and Expenditure 2009.
11
20
save may have changed their behaviour very little. Others had borrowed to finance expenditure, other than on housing, and as this borrowing ceased, given the changed circumstances of the banking system, household spending collapsed.
While there is more clarity now about the scale of public indebtedness and the associated fiscal challenges, and the direction of interest rates, the environment is not one where any major reduction in planned savings rates, back to mid-2000s levels of 6-7 per cent of disposable income, is likely in the short run, though actual savings may turn out to be less than planned. Disposable income this year looks set to fall by about 2-3 per cent (see Table 5). Households may maintain consumption levels, with some highly income elastic expenditure heads, such as holidays abroad, experiencing further declines. Although car demand is also highly income elastic, there are stock issues as cars age and some part of new registrations are used to replace older vehicles. The exceptional levels of sales in 2000, associated with the new millennium, may result in greater replacement as vehicles pass the 10 year mark. Company car sales may also recover. The transformation of the system of annual motor taxation and the Vehicle Registration Tax in 2008 from an engine size to a CO2 based system reduced the
residual value of cars and reduced the level of company car purchases, as replacement would have forced loses on firms.
The early indications for 2011 are that the declines in retail sales have levelled off in volume terms. This is despite the tax changes and expenditure cuts introduced in the December Budget. The tax changes came into effect and were known at the start of the year, so that declines in consumer expenditure could have been affected immediately. The retail sales index (excluding cars) for the first quarter of 2011 is running 0.4 per cent above the fourth quarter level of 2010. This series has exhibited false dawns previously so that more than a few months’ data are required to confirm either a levelling off or recovery. Even so the level is still 1.5 per cent below the average level in 2010 but should increase as the year progresses, especially if tourism recovers. While an increase in tourism numbers and expenditure does not directly affect domestic household consumption, an increase in retail sales will help to stabilise employment levels across the retail sector. We expect an increase in non-car retail sales of 1.5 per cent this year and about 3 per cent in 2012.
21
Motor fuel and other household fuel expenditure are likely to fall again in 2011 in real terms but power expenditure may stabilise as the price reductions by the ESB materialise. Household expenditure on direct medical and dental services may continue to decline because of the fall in incomes. Practitioners can maintain volumes by cutting prices and competition within these sectors could lead to price falls. There has been a very small fall in doctors’ fees, while dentists’ fees fell by 4 per cent in the last year. Neither decline is likely to offset the impact of the fall in income on those who must pay themselves for care. Health insurance premia have increased very significantly in recent months (by a seventh alone in February) and the numbers with health insurance have fallen.
The recent increase in interest rates will have some negative impact on economic activity not least because so much has been borrowed by banks from the ECB and the Irish Central Bank. The rate increases to date are small so that the overall effect will be slight and it may very well be that prudent tracker mortgage holders have prepared for this. Savers will benefit marginally, but then returns for savings have been very marginal. The critical issue is whether this is seen as a pointer to future increases. The danger is that higher inflation currently experienced in the Eurozone becomes embedded in expectations and leads to higher wage inflation. With the exception of Germany it is difficult to see this, as the higher inflation experienced in many countries reflects a spike in energy prices associated with the situation in Libya and in Japan following the devastation caused by the earthquake. This is likely to reverse in the short run. The situation in Germany is different as the rapid growth in the economy is leading to greater pressure in the labour market and this could lead to higher wage inflation and greater price inflation in Germany. This is a not unwelcome outcome from the point of view of other Eurozone countries given the excess competitiveness of the German economy, as evidenced by the continuing balance of payments surplus and the fast growth in exports. An increase in German wage and price inflation is almost the only mechanism for reducing the balance of payments imbalances in the Eurozone. This will be much harder to achieve if interest rates depress economies. Nevertheless interest rate increases seem likely so that by end 2012 they may be 1 percentage point higher than now.
22
Real disposable income is likely to fall by about 1 per cent next year. We are assuming that government will keep broadly to the agreed programme for reducing the budget deficit, but that the savings rate will fall, giving an increase in household spending of about 2 per cent. While this might seem optimistic the critical difference for households is that they now know the parameters of the adjustment that the economy faces and can plan accordingly. Furthermore, households have been reducing their financial liabilities and increasing their financial assets with the net position positive since 2008. Recent data on household loans and deposits indicate that this deleveraging by households is continuing into 2011. There were very large reductions in bank loans to the private sector of some €27 billion from end-September 2010 to end March 2011, while deposits fell by €12 billion. At some point the household sector and the private corporate sector will decide that the net asset position has reached the desired level, and will then reduce additions to the stock of savings and increase expenditure. This could happen quite quickly in the household sector, as not all households have mortgages and big bank debt. Even with the assumption we have made with regard to increased household expenditure, the savings rate will be 9 per cent – still well above the rates in the period 1990-1995 before house prices began to rise.
Table 5 : Personal Disposable Income
2009 % Change in 2010 2010 % Change in 2011 2011 % Change in 2012 2012
€m % €m €m % €m €m % €m €m
Agriculture, etc. 2.2 22¾ 0.5 2.7 11 0.3 3.0 3¼ 0.1 3.1
Non-Agricultural Wages 72.7 -5½ -3.9 68.7 -1 -0.7 68.0 1 0.6 68.6
Other Non-Agricultural Income 16.6 2¼ 0.4 16.9 -2¼ -0.4 16.6 9½ 1.6 18.2
Total Income Received 91.4 -3¼ -3.1 88.3 -1 -0.8 87.5 3 2.5 90.0
Current Transfers 27.0 - ¼ -0.1 26.9 -2½ -0.7 26.2 -2½ -0.7 25.5
Gross Personal Income 118.4 -2¾ -3.2 115.2 -1¼ -1.5 113.7 1½ 1.8 115.5
Direct Personal Taxes 21.6 -3½ -0.8 20.8 4 0.8 21.6 8¾ 1.9 23.5
Personal Disposable Income 96.8 -2½ -2.4 94.5 -2½ -2.3 92.1 0 -0.1 92.0
Consumption 84.3 -3½ -2.9 81.4 0 0.0 81.4 3 2.4 83.8
Personal Savings 12.5 13.0 10.7 8.2
Savings Ratio 12.9 13.8 11½ 9
24
BOX 1: MORTGAGE ARREARS
by David Duffy
[image:28.595.76.522.262.536.2]Statistics on mortgage arrears from the Central Bank shows a steady rise in the number and proportion of mortgages in arrears. Of the 786,164 private residential mortgage accounts in Ireland, 44,508 or 5.7 per cent were in arrears for more than 90 days at the end of December 2010 (Figure 1A). This represents an increase of 15,905 from the end of 2009, and continues earlier trend increases in the number of mortgages in arrears. In December 2006 it was estimated that 11,252, mortgage accounts were in arrears for more than 90 days (1.2 per cent).12
Figure 1A: Mortgage Arrears
The latest release also includes data showing that 59,229 mortgages have been restructured by lenders as part of forbearance measures to assist borrowers facing difficulty. A move to an “interest only” mortgage accounts for the largest proportion of restructures (38.3 per cent), while reduced payments (paying greater and less than interest only) account for 28.3 per cent of restructures. Other types of restructuring include term extension (12.2 per cent) and arrears capitalisation (11.9 per cent). A payment moratorium accounts for just 4.3 per cent of restructures to date, while other forms of restructuring account for another 4.9 per cent. Taking account of an overlap between restructured
12
Financial Regulator, “Findings of Arrears and Repossessions Handling Procedures Examination”, Press Release, 16 December 2008.
26,271 28,603 32,321 36,438 40,472 44,508
3.3% 3.6% 4.1% 4.6% 5.1% 5.7% 0% 1% 2% 3% 4% 5% 6% 0 5,000 10,000 15,000 20,000 25,000 30,000 35,000 40,000 45,000 50,000
Sep-09 Dec-09 Mar-10 Jun-10 Sep-10 Dec-10
Number (LHS) % of loan accounts (RHS)
Source: Central Bank of Ireland, press release, February 28, 2011
25
mortgages and mortgages in arrears shows that 79,713 mortgage accounts are either in arrears greater than 90 days or have been restructured, amounting to 10.1 per cent of mortgage accounts.
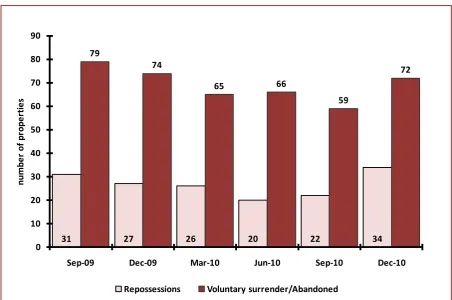
[image:29.595.72.525.416.716.2]The Central Bank also publishes data on the number of properties repossessed in a quarter and the number of properties that have been abandoned or voluntarily surrendered by the occupant. The number of properties being repossessed had declined between September 2009 and September 2010 but the most recent data show an increase in repossession levels (Figure 1B). Repossessions represent a very difficult outcome for the individual or family involved but it is worth noting that with the number of mortgage accounts at over 780,000 the number of repossessions represents a very small proportion of outstanding mortgages. The data also show a number of residential mortgage holders in each quarter are deciding to abandon their properties or to voluntarily surrender the property to the lender, suggesting some borrowers consider their situation to be too difficult to resolve. Analysis by the Irish Banking Federation shows that the repossession rate in Ireland is low when compared to the UK; for example, there were 13 repossessions per 100,000 mortgages here compared to 69 per 100,000 mortgages in the UK in Quarter 4, 2010.
Figure 1B: Number of Properties Abandoned or Voluntarily Surrendered
31 27 26 20 22 34
79 74 65 66 59 72 0 10 20 30 40 50 60 70 80 90
Sep-09 Dec-09 Mar-10 Jun-10 Sep-10 Dec-10
n u mb e r o f p ro p e rt ie s
26
Aron and Muellbauer (2010)13 identify the three main economic drivers of arrears and repossessions in the UK to be the unemployment rate, the incidence of negative equity and mortgage affordability (the ratio of mortgage service cost to disposable income). Based on the forecasts in this Commentary, the unemployment rate is expected to remain above average at 14 per cent over the short term. Duffy (2010)14 estimates that a high proportion of borrowers are in negative equity, numbering approximately 300,000. US research by Foote, Gerardi and Willen (2008)15 finds negative equity is a necessary but not a sufficient condition for default. It is the interaction of housing equity, a household’s cash flow16 and house price depreciation or appreciation that determines the decision to default. Furthermore, Ghent and Kudlyak, (2010)17 examine mortgage defaults across US states with both recourse and non-recourse borrowing and find that the decision to default where borrowing is on a recourse basis is substantially less sensitive to negative equity.
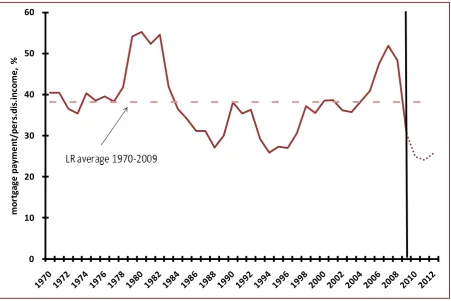
Mortgage affordability in Ireland has shown an improvement in recent years, reflecting low official interest rates and house price falls that have been greater than cuts in income. However, the ECB recently raised official interest rates and the expectation is that further increases are to come. Furthermore, domestic mortgage rates have risen independently of official ECB rates, as banks, given the cost of funds, raise mortgage rates. Figure 1C shows mortgage affordability over the long run (1970-2012), measured by the level of mortgage debt, interest rate and personal disposable income. Affordability improved significantly between 2006 and 2010, reflecting falling house prices and low interest rates. The forecasts in this Commentary suggest that a combination of rising interest rates and stable house prices may result in deteriorating affordability in 2012. Thus, the economic outlook suggests that high levels of arrears will persist from some time.
13
Aron, J., and J. Muellbauer, 2010. “Modelling and Forecasting UK Mortgage Arrears and Possessions”, Centre for Economic Policy Research, Discussion Paper Series No. 7986, September.
14
Duffy, D., 2010. Negative Equity in the Irish Housing Market, The Economic and Social Review, Spring, Vol. 41. No.1.
15
Foote, C. L., K. Gerardi and P. S. Willen, 2008. “Negative Equity and Fore-closure: Theory and Evidence”, Journal of Urban Economics, Vol. 64, No. 2, pp.234-245.
16
For example, a household’s cashflow can be adversely affected by unemployment, divorce and illness.
17
27
Figure 2C: Mortgage Affordability
0 10 20 30 40 50 60
mo
rt
ga
ge
p
ay
me
n
t/p
e
rs
.d
is
.i
n
co
me
,
28
5. Public Finances
While the exchequer framework is not ideal for the purposes of analysis, it has been in use for decades and is readily understood particularly now that details of the main expenditures by department are available on a monthly basis. This allows analysis of monthly data under main department heads throughout the year.
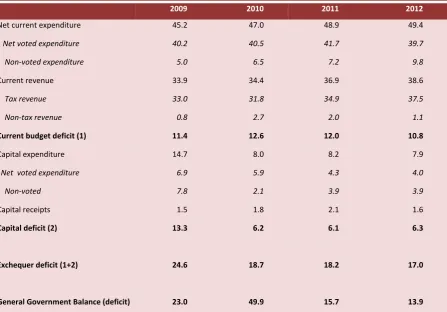
[image:32.595.75.523.371.683.2]Table 6 sets out the budget figures for 2011, amended slightly by later figures with the end year returns, the figures taken from the Revised Estimates of Public Expenditure and Ireland – Stability Programme Update, April 2011 (Department of Finance)
Table 6: Exchequer Finances €billion
2009 2010 2011 2012
Net current expenditure 45.2 47.0 48.9 49.4
Net voted expenditure 40.2 40.5 41.7 39.7
Non-voted expenditure 5.0 6.5 7.2 9.8
Current revenue 33.9 34.4 36.9 38.6
Tax revenue 33.0 31.8 34.9 37.5
Non-tax revenue 0.8 2.7 2.0 1.1
Current budget deficit (1) 11.4 12.6 12.0 10.8
Capital expenditure 14.7 8.0 8.2 7.9
Net voted expenditure 6.9 5.9 4.3 4.0
Non-voted 7.8 2.1 3.9 3.9
Capital receipts 1.5 1.8 2.1 1.6
Capital deficit (2) 13.3 6.2 6.1 6.3
Exchequer deficit (1+2) 24.6 18.7 18.2 17.0
General Government Balance (deficit) 23.0 49.9 15.7 13.9
29
The underlying budgetary position is set to improve at a much better rate than these figures indicate, as once-off expenditures in relation to Anglo-Irish Bank and the Irish Nationwide Building Society are included in the capital expenditure in 2010. The underlying position may also be distorted during the year by the cost of the recently announced additional bank restructuring, depending on how the capital cost is treated in the accounts. The estimate for Central Fund Services includes the estimated interest cost of the restructuring, but the capital cost is not included in the General Government Balance.
The first quarter exchequer returns provide some indication of how the budgetary situation is developing. Voted expenditure is running 2.3 per cent below the expected total for the period. A precise year-on -year comparison with 2010 is not straightforward as the treatment of the Health Levy has changed. The Health Levy is now part of the new Universal Social Charge. The revenue from the Universal Social Charge is included within the heading “income tax”. Ideally, this should be separated out so that like-for-like comparisons can be made.18 In 2010 the quarterly revenue from the Health Levy was approximately €0.5 billion, and if allowance is made for this, underlying voted current expenditure rose by just over 1 per cent.
The tax revenue figures provide mixed messages. Overall they increased by 3.7 per cent on the first quarter of 2010. Figure 2 charts the basic data, these data seasonally corrected and a trend curve that eliminates random movements from the seasonally corrected data. Seasonally corrected19 quarterly tax revenue shows a slight upturn, but the trend looks quite flat for the first quarter of the year despite the reclassification of the health levy as tax revenue as part of the Universal Social Charge. The data were thus somewhat disappointing. However, it is very early in the year and quarterly revenue data are very volatile and there could easily be an improvement in the second quarter. The April Exchequer Returns point to such an improvement.
18
Previously the Health Levy was accounted for as revenue to the Health Services Executive. This had the effect of reducing the net expenditure, but not, of course, gross expenditure.
19
30 7,000 8,000 9,000 10,000 11,000 12,000 13,000 14,000 15,000 16,000 2 0 0 5 Q 1 2 0 0 5 Q 2 2 0 0 5 Q 3 2 0 0 5 Q 4 2 0 0 6 Q 1 2 0 0 6 Q 2 2 0 0 6 Q 3 2 0 0 6 Q 4 2 0 0 7 Q 1 2 0 0 7 Q 2 2 0 0 7 Q 3 2 0 0 7 Q 4 2 0 0 8 Q 1 2 0 0 8 Q 2 2 0 0 8 Q 3 2 0 0 8 Q 4 2 0 0 9 Q 1 2 0 0 9 Q 2 2 0 0 9 Q 3 2 0 0 9 Q 4 2 0 1 0 Q 1 2 0 1 0 Q 2 2 0 1 0 Q 3 2 0 1 0 Q 4 2 0 1 1 Q 1
Trend Unadjusted Seasonally Adjusted
Source:Department of Finance and own calculations
€
m
ill
io
[image:34.595.76.523.97.374.2]n
Figure 2: Tax Revenue, Seasonally Corrected and Trend Component
The budget target, adjusted for the extra interest costs associated with bank restructuring, still looks as if it can just about be realised. On the expenditure side there may be some slippage as the Live Register is running above the levels assumed at budget time. However, the new programmes for retraining may not have kicked in yet, there is also still some work to be done on restructuring the welfare code by shifting payments to those in need and reducing emerging disincentives to seek work. In total, transfer payments could be higher than budgeted. While the Budget has allowed for a decline of 2.2 per cent in the pay and pensions bill, with a slightly faster fall in numbers at 3.1 per cent, the Revised Estimates of Public Expenditure show a fall of 0.2 per cent in the pay and pensions bill and a fall of only 1.2 per cent in numbers.
31
second half of the year and into 2012. It is also likely that some capital projects will be delayed during this period of adjustment and this would reduce the borrowing requirement. On the revenue side, while the first quarter returns were less than we had expected, they could easily improve as the economy develops during the year. Taken together, and given the risks on the revenue side, a reduction in capital expenditure could guarantee that the borrowing targets are met. There is a benefit in this over the period of the programme and not just in 2011 and 2012. The figures for 2012 include an adjustment of €3.6 billion by way of expenditure cuts and tax increases designed to maintain the broad pattern necessary under the bailout programme. The overall figures for 2012 seem achievable at this stage.
Net current expenditure on goods and services could decline by about 2 per cent this year and 4 per cent in 2012. This is a slightly different time profile to that set out in the budget, but occurs mostly because of delays in effecting the necessary changes.
The increase in the level of debt in recent years has been very rapid. The fiscal consolidation to date has been very large but the scale of the budget deficits and the need to provide funding for the banking system has led to continued increases both to the level of debt and the debt/GDP (or debt/GNP) ratio. The
Stability Programme Update2011 20 sets out the time profile of the evolution of the overall budget deficit and the debt to 2015. This envisages the ratio of debt to GDP peaking at 1.18 in 2013 and then declining. In order that the debt to GDP ratio be stabilised it is necessary to run a primary budget balance (i.e., the budget deficit/surplus excluding debt interest payments) equal to the difference between the growth in the economy and the interest rate times the previous year’s debt/GDP ratio. To reduce the ratio of debt to GDP the primary balance must be greater than this. The assumptions for GDP growth in nominal terms of about 4 per cent in 2014 and 2015, and nominal interest rates of 5.6 per cent, together with debt/GDP at 1.18 and a primary budget surplus of 1.7 per cent and 3.4 per cent of GDP in 2014 and 2015 respectively mean that the condition for debt sustainability is satisfied. This is very important, but can only be realised if the fiscal consolidation is pursued. Furthermore, sustainability is not optimality so that we must continue efforts to have pro-growth micro policies, to reduce the interest rate, and if possible to have some burden sharing in relation to the level of debt at EU level because of the potential spillover effects to other EU countries of the banking crisis here.
20
32
6. Employment and
Unemployment, Earnings and
Prices
The Quarterly National Household Survey from the CSO is the major source of data on trends in employment and unemployment. Total employment continued to fall during 2010. By year end it was 3.4 per cent lower than a year earlier and 14.7 per cent below the peak level in 2008. The participation rate has also fallen, standing now at 60.7 per cent of the population aged 15 and over, compared with 63.5 per cent in the first quarter of 2008. The corresponding figures for unemployment in 2008 and 2010 are 14.7 per cent and 4.9 per cent.
There are also big differences between male and female unemployment rates: male unemployment now stands at 17.9 per cent while female unemployment stands at 10.6 per cent. The gap of 7.3 percentage points between the two rates contrasts significantly from the situation that prevailed in early 2008 when the gap was just 1.9 percentage points. The rise in male unemployment from Q1 2008 to Q4 2010 at 139.7 thousand is very similar to the fall in male employment in the construction sector at 139.3 thousand. These are net figures for unemployment changes. There are large gross flows on and off the Live Register so that not all the increase in male unemployment is among those who worked in construction. The fall in female employment, as evidenced from the QNHS, is much more dispersed across sectors.
33
While employment at an aggregate level has continued to decline, the latest
QNHS does show some sectors experiencing increases in employment. There was a rise in employment in industry in the final quarter of 2010 from a very low base in the third quarter. There was also an increase in the numbers employed in the wholesale and retail trade and in some administrative and support service activities. The increases are all small and outweighed by declines in other sectors, but these are tentative signs of a change in direction following several years of decline across all sectors. The increase in employment in industry is not surprising given the rise in industrial output that took place in 2010 and further increases are forecast during 2011 and 2012. In the same way some service sector employment will increase as services exports rise, though there are emerging shortages in some areas.
[image:37.595.72.529.557.762.2]The Expert Group on Future Skill Needs reported in March that in spite of the recession and the level of unemployment there are still vacancies and these have increased, with shortages of labour in ICT, engineering, healthcare and finance. We expect some very modest increases in wholesale and retail employment over the coming years. Non-market service sector employment is likely to decline – in healthcare, education and public administration and defence. There may be some increase in private healthcare employment as constraints in the public hospital system lead to a shift to private hospital care. Overall, employment may change very little from the level at end-2010 implying a fall of about 1 per cent in total. Unemployment however will remain high at 14¼ per cent this year and 14 per cent in 2012. Both of these forecasts depend crucially on emigration and may be lower if emigration is greater than in 2010. Table 7 sets out our forecasts for employment and unemployment.
Table 7: Employment and Unemployment
Annual Averages 000s
2009 2010 2011 2012
Agriculture 96 85 88 90
Industry 411 360 345 345
Services 1,422 1,403 1,386 1,390
Total at Work 1,929 1,848 1,820 1,825
Unemployed 259 292 304 295
Labour Force 2,187 2,140 2,124 2,120
Unemployment Rate % 11.8 13.6 14¼ 14
Net Migration -7.8 -34.5 -60.0 -40.0
of which: Inward Migration 57.3 30.8 15.0 20.0
34
Average private sector hourly earnings stabilised at end 2009 levels during 2010. There are differences in hourly rates across sectors but relative stability is a common feature of the recent data. Given the state of the labour market there is unlikely to be pressure for any major upward changes in wage rates at an aggregate level, though in areas where shortages exist there could easily be increases in basic wage rates. Average earnings for existing workers could also rise as firms increase exports if hours worked increase. We do not expect any further declines in hourly rates of pay in the private sector. There may even be increases in those areas where skill shortages are emerging.
Pay and pensions in the public sector are protected by the Croke Park Agreement, but government has indicated that there could be further declines in pay if productivity gains do not result in significant savings. Given the increase in output in industry, unit labour costs have decreased sharply again in 2010 and they should fall further in 2011 and 2012.
The outlook for price inflation is more uncertain. As is well recognised there are major differences between the different measures of inflation, especially in the context of housing cost adjustments. Tracker mortgages may be under-represented in the CPI as they were less common when the base for the CPI was selected. There may also be problems of bias in the methodology used to determine the mortgage interest component as set out by Colm McCarthy in a previous edition of the Commentary.21
In addition to these concerns it should be noted that the Consumer Price Index (CPI) and the Harmonised Index of Consumer Prices (HICP) are fixed base indices and thus take little account of shifting patterns of expenditure. That these patterns have changed is amply demonstrated in Table 4 which examined the extent to which expenditure by retail outlet has varied during this crisis. The implied deflator for household consumption is better at picking up these changes and it declined in 2010 by 2.4 per cent while the CPI and the HICP fell by just 1.0 per cent and 1.6 per cent respectively.
The divergent patterns of the CPI, the HICP and the personal consumption deflator are represented below in Figure 3. While we expect the CPI to increase by 2½ per cent this year and HICP to rise by 1½ per cent, the household consumption deflator may remain unchanged. Furthermore, the quarterly
21
35
-7 -6 -5 -4 -3 -2 -1 0 1 2 3
2009Q1 2009Q2 2009Q3 2009Q4 2010Q1 2010Q2 2010Q3 2010Q4 2011Q1
CPI HICP Consumption Deflator
%
Source: CSO
[image:39.595.72.526.200.494.2]pattern during the year may be very uneven and affect the different measures differentially. The increase in interest rates will impact on the CPI but not on the HICP. The increase in fuel prices may be short-lived and could reverse from mid-year, and the fall in electricity prices for ESB customers will pull down the index. However, there are risks of further inflation should fuel and energy-related prices prove not to be transitory, and these will have to be monitored closely.
36
7. Imports and the Balance of
Payments
Imports of Goods and Services increased by 6.6 per cent in volume terms and by 7.4 per cent in value terms in 2010. Imports of goods rose by 1.3 per cent in volume while imports of services increased by 9.9 per cent. Much of imports of services, with the obvious exception of expenditure abroad by residents, are now related to exports, which is why a set of inter-related accounts for the multinational sector is important. As multinational exports increase, royalty payments and other services are charged directly to the activity. Consequently, the large increase in exports of goods in 2010 is associated with a corresponding increase in imports of services. The same applies to 2011 and 2012. Thus, we expect imports of goods and services to increase by 6 per cent this year and about the same in 2012 both in volume terms. Within these numbers, expenditure abroad by tourists from Ireland is expected to fall in 2011, but to increase in 2012 (see Table 9 opposite).
[image:40.595.72.531.566.680.2]Reflecting the pattern of trade the balance of payments is forecast to go into surplus this year at €1.65 billion (1.2 per cent of GNP) increasing to €3.6 billion (2.9 per cent of GNP) in 2012. The Balance of Payments are set out below in Table 8.
Table 8: Balance of Payments 2010-2012, €billion
2010 2011 2012
Exports of goods and services 158.4 172.0 186.7
Imports of goods and services -129.3 -137.7 -147.7
Net Factor Payments -29.1 -31.8 -34.4
Net Transfer -1.1 -1.0 -1.0