Nutrient limitation or home field advantage: does microbial community adaptation 1
overcome nutrient limitation of litter decomposition in a tropical peatland? 2
3
Jorge Hoyos-Santillan1*, Barry H. Lomax1, Benjamin L. Turner2and Sofie Sjögersten1 4
5
1The University of Nottingham, School of Biosciences, Division of Agricultural and 6
Environmental Science, Room C-36 Gateway Building, Sutton Bonington Campus, 7
Loughborough, LE12 5RD, UK 8
2Smithsonian Tropical Research Institute, Apartado 0843-03092, Balboa, Ancon, Republic of 9
Panama 10
11
*Corresponding author: Jorge Hoyos-Santillan 12
e-mail: jhoyosantillan@hotmail.com 13
tel: +52 012292695268 14
15
17
Summary 18
1.Litter decomposition is an important control on carbon accumulation in tropical peatlands. 19
Stoichiometric theory suggests that decomposition is regulated by elemental ratios in litter while 20
the home field advantage hypothesis predicts that decomposer communities are adapted to local 21
conditions. To date, the relative importance of these contrasting theories for litter decomposition 22
and therefore the carbon balance of tropical peatlands remains poorly understood. 23
2.We conducted twoin situlitter decomposition experiments in a lowland tropical peatland. The 24
first experiment tested the importance of the stoichiometric theory using a factorial nutrient 25
addition experiment at two sites with contrasting vegetation (Raphia taedigeraand 26
Campnosperma panamensis) to assess how nutrient addition affected microbial enzyme activity 27
and litter mass loss at the peat surface and at 50 cm depth. The second experiment tested the 28
importance of home field advantage by reciprocal translocation of leaf litter fromR. taedigera 29
andC. panamensisforests, which differed in both litter chemistry and soil nutrient availability, 30
to separate the influence of litter chemistry and soil/site properties on litter mass loss. 31
3.The activities of hydrolytic enzymes involved in the decomposition of large plant polymers 32
were stimulated by nitrogen addition only where nitrogen availability was low relative to 33
phosphorus, and were stimulated by phosphorus addition where phosphorus availability was low. 34
4.The addition of nitrogen, but not phosphorus, increased leaf litter decomposition under 35
5.Decomposition was greatest for autochthonous litter irrespective of site nutrient status, 37
indicating that adaptation of the microbial community to low nutrients can partly overcome 38
nutrient limitation, and suggesting that home field advantage can influence litter decomposition 39
rates. 40
6.Synthesis. Our study shows that leaf litter decomposition and the activity of microbial 41
enzymes in tropical peatlands are constrained in part by nutrient availability. However, such 42
nutrient limitation of litter decomposition can be overcome by adaptation of the microbial 43
45
Highlights: 46
Nitrogen and phosphorus stimulated activity of hydrolytic enzymes associated with 47
decomposition in agreement with stoichiometric theory. 48
Nitrogen availability limited leaf litter decomposition under anoxic conditions, 49
suggesting environmental and litter chemistry controls of nutrient limitation. 50
Litter decomposition was greatest at the site where the litter originated, irrespective of 51
site nutrient status, supporting home field advantage theory. 52
53
54
55
56
57
58
59
1. Introduction 61
Decomposition rates of organic matter influence carbon storage and regulate nutrient availability 62
in natural ecosystems. Decomposition is carried out by complex groups of microorganisms and 63
the rate of decomposition is controlled by how the substrate properties, together with the abiotic 64
environment, meet the demands of the microbial communities (Kaiseret al.2014). According to 65
stoichiometric theory, the balance of carbon (C), nitrogen (N) and phosphorus (P) that 66
decomposer organisms must maintain to regulate metabolic function and growth limits 67
decomposition rates when nutrient ratios in the substrate do not match demand by individual 68
microorganisms (Sterner & Elser 2002; Manzoni & Porporato 2009). If this holds true, 69
decomposition rates should not be limited by nutrient availability when the composition (with 70
regards to C, N and P) of the substrate (e.g.leaf litter) is similar to that of the decomposer 71
organisms. Indeed, greater nutrient availability enhances decomposition in a wide range of 72
ecosystems (e.g., subarctic heaths, mangroves), supporting the notion of nutrient limitation of 73
decomposition (Questedet al.2005; Cornwellet al.2008; Keuskampet al.2015b). However, in 74
other instances nutrient addition has had limited effects on decomposition rates (e.g. 75
decomposition of low quality litter has been found to be energy rather than nutrient limited; 76
Knorret al.2005; Keuskampet al.2013). Furthermore, nutrient limitation of litter 77
decomposition fluctuates over time, reflecting changing nutrient demands of the decomposer 78
organisms as well as changes in litter chemistry as decomposition progresses (Kaiseret al. 79
2014). 80
Microorganisms can overcome resource limitation by up-regulating the production of 82
extracellular enzymes involved in C, N and P acquisition, depending on which nutrients are 83
limiting their growth (Sinsabaugh & Follstad Shah 2012). For example, low P availability 84
increases the activity of acid phosphatases in a range of soils (Olander & Vitousek 2000; Allison 85
et al.2007; Sjögerstenet al.2011), while low nutrient availability can drive tight nutrient cycling 86
within microbial communities (Kaiseret al.2014). Strong interactions between the composition 87
and functioning of the microbial community and the dominant litter inputs are one of the 88
explanations of the so called “home field advantage” (HFA), whereby the decomposer 89
community becomes adapted, or optimized, to degrade the litter at a given site (Austinet al. 90
2014). This results in faster litter decomposition rates when litter decomposes adjacent to the 91
plants that produced it (Vivanco & Austin 2008). This pattern is relatively weak, but holds true at 92
the global scale, with an approximately 8% greater mass loss when litter material was 93
decomposing at “home” (Ayreset al.2009; Veenet al.2015). However, the effects of the home 94
field advantage are more pronounced when sites differ considerably in soil nutrient availability 95
and plant species composition, suggesting lower degree of redundancy among decomposer 96
communities across locations with strongly contrasting soil and litter type characteristics (Veen 97
et al.2015). 98
Lowland tropical peatlands have the fastest rates of peat accumulation in the world – up to 10 99
times faster than temperate, subarctic and boreal peatlands (Gorham, Janssens & Glaser 2003; 100
Chimner & Ewel 2005; Dommain, Couwenberg & Joosten 2011) – and contain 40-90 Gt of C 101
(Kurniantoet al.2015). The functioning of tropical peatlands as a C store is currently under 102
threat as land use change, climate change and increasing levels of atmospheric N deposition 103
nutrient availability is a key limitation of decomposition in tropical peatlands, as has been found 105
at higher latitudes (Wanget al.2014), then greater nutrient availability might reduce C storage. 106
In addition, nutrient availability shapes the species composition of peat swamp forests (Brady 107
1997; Pageet al.1999; Troxler 2007; Sjögerstenet al.2011) and hence the quality and the 108
quantity of litter inputs (Wrightet al.2013; Hoyos-Santillanet al.2016), with implications for 109
the composition of the decomposer community (Troxleret al.2012) and decomposition rates 110
(Yule & Gomez 2009; Hoyos-Santillanet al.2015). 111
Litter decomposition of tropical peatland tree species varies among species (e.g.,between palms 112
and hardwoods) and tissue types (e.g.,between roots and leaves) (Yule & Gomez 2009; Hoyos-113
Santillanet al.2015). Furthermore, the degree of waterlogging and nutrient availability, as well 114
as microbial community composition, pH, and concentrations of dissolved oxygen and phenolic 115
compounds, vary within peat profiles (Freeman, Ostle & Kang 2001; Jackson, Liew & Yule 116
2009; Hoyos-Santillanet al.2015, 2016). Therefore, decomposition rates of the same litter 117
material differs depending on its position within the peat profile (Hoyos-Santillanet al.2015). 118
To test the importance of stoichiometric theory (Sterner & Elser 2002; Manzoni & Porporato 119
2009) and HFA (Austinet al.2014) for litter decomposition, we carried out two experiments in a 120
tropical peatland in Panama. The first experiment was a factorial N and P addition experiment in 121
two contrasting forest types, a nutrient rich palm swamp and a relatively less nutrient rich mixed 122
forest (Sjögerstenet al.2011). This experiment tested the hypothesis that nutrient availability 123
controls (i) activities of extra cellular hydrolytic enzymes, which are involved in microbial 124
nutrient and carbon acquisition and (ii) litter decomposition. The experiment involved 125
decomposing different litter tissue types (leaves, roots and stems) at the peat surface and at 50 126
addition would reduce microbial C:N and C:P ratios and down-regulate enzymes involved in 128
nutrient acquisition, resulting in a subsequent up-regulation on enzymes involved in the 129
breakdown of sugars, hemi-cellulose and cellulose (Sinsabaugh & Follstad Shah 2012). 130
According to stoichiometric theory, we expected nutrient addition to accelerate litter mass loss at 131
the low nutrient mixed forest site, and that litter decomposition would be greatest for both litter 132
types at the more nutrient rich palm swamp site. We also predicted that litter with high C:N and 133
C:P ratios would be more responsive to nutrient addition with respect to mass loss, in agreement 134
with Baumannet al.(2009). 135
The second experiment was a reciprocal leaf litter translocation experiment between the two 136
contrasting forest types. This experiment tested the hypothesis that litter is decomposed faster at 137
“home” than “away” irrespective of site nutrient status (Kaiseret al.2014; Austinet al.2014). 138
For this experiment we carried out reciprocal transplants of leaf litter material from two different 139
trees species that were the dominant trees at two peatlands sites with contrasting nutrient status 140
(i.e. the same two sites that were used for the nutrient addition experiment). We predicted that 141
according to the HFA theory the “home” palm leaf litter would degrade more rapidly at the palm 142
site while the litter from the low nutrient mixed forest would degrade fastest at the mixed forest 143
site,i.e. its home location (Veenet al.2015). This contrasts with our prediction above of greater 144
decomposition at the nutrient rich site following stoichiometric theory (e.g.Sterner & Elser 145
2002), allowing us to investigate the respective influences of HFA and stoichiometric theory on 146
C dynamics and, by extension, peat accumulation in tropical peatlands. 147
148
2.1. Study sites 150
The study was conducted in the north-west Caribbean coast of Panama where several large 151
peatlands are located within the Bocas del Toro province (Phillips, Rouse & Bustin 1997). 152
Rainfall averages 3092 ± 181 mm yr-1, with a mean annual air temperature of 25.9 ± 0.3 °C 153
(2003 to 2011; Smithsonian Tropical Research Institute Physical Monitoring Program). There is 154
no pronounced seasonality (Wrightet al.2011), although there are two periods of reduced 155
rainfall from February to April and August to September. 156
Seven phasic communities have been identified in these peatlands (Phillipset al.1997). We 157
studied two of these: palm swamp dominated byRaphia taedigera(Mart.), a canopy forming 158
palm in the Arecaceae family (925’29.20”N, 8224’05.60”W), and mixed forest dominated by 159
Campnosperma panamensis(Standl), an evergreen broadleaved hardwood tree in the 160
Anacardiaceae family (925’15.00”N, 8224’14.64”W). The sites were located within the 161
Changuinola peat deposit in the San San Pond Sak wetland (Ramsar site No. 611; ≈ 164 km2). 162
The distance between the sites was approximately 300 m. Both sites are freshwater (surface 163
water conductivity < 200 µS cm-1), with the water table predominantly at or just below (10 cm) 164
the peat surface. Maximum recorded water fluctuations were + 15 to − 40 cm relative to the peat
165
surface, with surface water consistently above the peat surface during periods of high rainfall. 166
Dissolved O2concentrations in the pore water were up to 3.3 ppm at the surface (Palm swamp: 167
1.35 ± 0.25 ppm; Mixed forest: 2.15 ± 0.34), but as low as 0.2 ppm at 50 cm belowground (Palm 168
swamp: 0.72 ± 0.27 ppm; Mixed forest: 0.68 ± 0.19). Nutrient levels at the two sites differ with 169
respect to total and exchangeable P (higher at the palm swamp), as well as microbial N and P 170
et al.2011). Palm sites had large amounts of palm leaf litter at the surface and a dense but 172
shallow (1.1 m depth) fibrous root system (Wrightet al.2011). The mixed forest sites had large 173
amounts ofC. panamensisleaf litter at the surface but leaf litter from other species was also 174
present (for further details on of the forest structure and composition see Sjögerstenet al., 2011 175
and Hoyos-Santillanet al., 2016).C. panamensisis characterized by woody lignified structural 176
roots reaching at least 1 m depth and abundant surface knee roots (Wrightet al.2011). 177
Microtopography within all sites consisted of shallow ponds and raised areas (close to trees 178
associated with root structures). 179
180
2.2. Experimental design and methodology 181
182
2.2.1. Nutrient addition experiment 183
The potential role of nutrient limitation on microbial activity and litter decomposition was 184
explored by a 5 month (October 2011 to March 2012) litterbag experiment. The nutrient 185
treatments were: N, P, N+P and control (Ctrl). The experiment consisted of ten blocks distributed 186
along 150 m transects running from south-east to north-west at both the palm swamp and mixed 187
forest sites (20 blocks in total). Each block was 10 × 10 m with the nutrient enrichment 188
treatments applied at each corner, blocks were 5 m apart (Fig. 1). Adjacent corners had the same 189
nutrient treatment. 190
R. taedigeraandC. panamensislitter for the decomposition study was collected from the palm 191
freshly cut leaf stalks (petioles) or stems (~5 cm in diameter), and fine lateral roots (2–4 mm 193
diameter) from the top 20 cm of the soil profile. After collection, the litter was cleaned with 194
deionized water (DI) and air dried for five days. To allow comparable masses to be weighed out, 195
the litter material was cut into smaller pieces: leaves were cut into ~ 2 × 2 cm pieces, roots were 196
cut into ~ 2 cm lengths, and stems were cut into ~ 1 cm thick discs to ensure that a cross section 197
of the stem tissue was used. Litter was weighed (leaves: ~ 2 g; whereas stems and roots: ~ 1 g), 198
placed separately into pre-weighed polyester mesh litterbags (10 × 10 cm; 560 μm mesh), and
199
tied with polyamide thread (⌀= 0.8 mm). Litter bags were placed directly on the peat surface 200
avoiding hollows. For the belowground incubation (50 cm depth), a narrow slit was cut into the 201
peat and litterbags were manually pushed to the right depth. To aid recovery, litter bags were 202
tied to a string which was securely attached to the ground surface. One litterbag of each tissue 203
type was placed at each of the incubations locations at the start of the experiment, giving a total 204
of 480 litterbags (2 depths (surface and 50 cm depth) × 3 tissue types (leaves, stems, roots) × 4 205
nutrient treatments (Ctrl, N, P and N+P) × 2 sites (palm swamp and mixed forest) × 10 blocks). 206
Nutrient enrichment was applied once at the beginning of the experiment by filling 25 cm 207
sections of dialysis tubing (Spectra/Por®membrane: 40mm diameter, 6000 to 8000 molecular 208
weight cut off) with 0.86 mol of either N (Urea: CO(NH2)2or P (calcium phosphate monobasic 209
monohydrate: Ca(H2PO4)2•H2O) fertilizer. This allowed a slow release of nutrients through the 210
membrane (Feller 1995). Within each block, fertilizer was applied at both the surface and 211
belowground (50 cm) adjacent to the litterbags (< 10 cm from litterbags). For the belowground 212
treatment the dialysis tubes were inserted in a narrow vertical slit cut into the peat. 213
After five months, soil samples were collected to evaluate the impact of the nutrient treatments 214
activities). To do this, 10 × 10 × 10 cm samples of peat were carefully cut from the surface peat 216
where the litterbags were incubated. Soil samples were stored in plastic bags at 4C for one 217
week prior to nutrient and enzymatic analyses. 218
The increase of available nutrients after the nutrient addition treatment, dissolved organic C 219
(DOC) and dissolved N fractions (TDN = dissolved organic nitrogen (DON) + inorganic fraction 220
(nitrate-nitrite and ammonium)) were extracted from surface peat (10 cm depth) by shaking 40 g 221
(fresh weight) of peat in 75 mL of 0.5 M K2SO4for 1 h (Sjögerstenet al.2011). Extracts were 222
centrifuged (8000 g, 15 min) and DOC and TDN in the supernatant were determined after a five-223
fold dilution by TOC-TN analyzer (Shimadzu, Columbia, MD). Readily-exchangeable P was 224
determined by extraction with anion exchange membranes (AEM) (Myers, Thien & Pierzynski 225
1999; Turner and Romero 2009). For this purpose, surface peat (20 g fresh weight) was shaken 226
for 24 h with 80 mL deionized water and five anion-exchange resin strips (1 × 40 mm; 227
manufactured by BDH Prolabo). The strips were rinsed in deionized water and the phosphate 228
recovered by shaking for 1 h in 50 mL of 0.25 M H2SO4. Phosphate was determined in the acid 229
solution at 880 nm following online neutralization and automated molybdate colorimetry using a 230
flow injection analyzer (Lachat Quikchem 8500, Hach Ltd, Loveland, CO). 231
To investigate the relationship between the nutrient treatments and microbial activity, we 232
measured, in the peat, microbial biomass C, N and P, and extracellular hydrolytic enzyme 233
activities; these parameters were used as indicators of the functioning of the microbial 234
community at the two experimental sites. Microbial C and N were estimated by CHCl3 235
fumigation and 0.5 M K2SO4extraction using a correction factor of 2.64 to account for the 236
unrecovered biomass C (Vance, Brookes & Jenkinson 1987) and 1.85 to account for unrecovered 237
fumigation and anion-exchange membranes as described previously (Myerset al.1999; Turner 239
& Romero 2009). Microbial P was calculated as the difference between phosphate in fumigated 240
and unfumigated samples. 241
Total C and N were measured in initial litter and peat samples collected from the peat surface 242
and 50 cm depth. Litter and peat samples were ball milled prior to analysis on a total element 243
analyzer (Thermo Flash EA 1112, CE Instruments, Wigan, UK). Peat and litter ash from loss on 244
ignition analysis was dissolved in 6 M HNO3to estimate P concentration by molybdate 245
colorimetry (Andersen 1976). For detailed methods see Hoyos-Santillan (2014). 246
To assess if nutrient addition altered the activity of enzymes involved in the release of C, N, P 247
and sulfur from organic compounds, the activities of five different extracellular hydrolytic 248
enzymes were measured at the end of the experiment using fresh surface peat collected from 249
three of the nutrient addition experimental blocks at the palm swamp and the mixed forest. 250
Assays were conducted using methylumbelliferone-linked fluorogenic substrates (Turner & 251
Romero 2009; Turner 2010). Specifically, enzymes and substrates were: i) 252
phosphomonoesterase: 4-methylumbelliferyl phosphate (MUP); ii) phosphodiesterase: bis-(4-253
methylumbelliferyl) phosphate (BisMUP); iii) arylsulfatase: 4-methylumbelliferyl sulfate 254
(MUS); iv) β-glucosidase: 4-methylumbelliferyl β-D-glucopyranoside (MUBG); v)N -acetyl-β-255
glucosaminidase: 4-methylumbelliferylN-acetyl-β-D-glucosaminide (MUNA). For the assays, 256
peat (2 g fresh weight) was added to 200 mL of 1 mM sodium azide (NaN3) solution and stirred 257
for 10 min. Aliquots (50 μL) of peat suspension were dispensed into a 96-well microplate
258
containing 100 μL of 200 μM substrate and 50 μL of sodium acetate-acetic acid buffer adjusted
259
to pH 4 (the mean peat pH). Microplates were incubated at 30 °C for 30 min; following 260
incubation 50 μL of 0.5 M NaOH was added to terminate the reaction, and fluorescence was
determined immediately on a FLUOstar Optima spectrofluorometer (BMG Labtech, Offenburg, 262
Germany). 263
264
2.2.2. Litter translocation experiment 265
The reciprocal litter translocation experiment involved incubatingR. taedigeraleaf litter in both 266
a palm swamp and a mixed forest and vice versa forC. panamensis. The litter translocation used 267
five of the ten blocks at the palm swamp and mixed forest; litterbags with leaves were installed 268
at surface of the control corners of the odd numbered blocks. Total number of litterbags was 20 269
(i.e., 2 species × 2 sites × 5 replicates). The incubation time was five months and litter mass loss 270
was quantified as in 2.2.3. 271
272
2.2.3.Litterbag recovery 273
After collection, the litterbags were carefully rinsed with deionized water. It is possible that fine 274
litter (<560 μm) was lost during the cleaning process, resulting in a slight overestimation of the
275
mass loss during the incubation. After rinsing, bags were opened and the litter visually inspected 276
to remove new root growth. Litter was then dried at 70 °C for a minimum of 48 h to constant 277
weight in pre-weighted aluminum trays. The remaining mass of litter were calculated as a 278
proportion of the initial mass remaining at the end of the experiment (Wieder & Lang 1982). 279
280
We used linear mixed models to assess the impact of the nutrient treatments on the measured 282
parameters. The models were fitted using Residual Maximum Likelihood (REML). To analyze 283
the effect of the nutrients addition experiment on nutrient concentrations, ratios (C:N, C:P and 284
N:P), hydrolytic enzyme activity, phasic community and nutrient treatment (Ctrl, N, P and N+P) 285
were used as fixed factors and block as random factor. To analyze the effect of the nutrient 286
addition on % litter remaining, the nutrient treatment (Ctrl, N, P and N+P), the different tissues, 287
and the incubation depth were used as fixed factors, and block as random factor. The 288
relationships between nutrient ratios in the extractable and microbial fractions were analyzed 289
using linear regression. For the analysis of the litter translocation experiment (% remaining 290
massdw), the sites (palm swamp and mixed forest), and the translocation treatment were used as 291
fixed factors, and block was the random factor. Residual plots were checked to ensure the 292
assumption of normality and homogeneity of the residuals were met. We calculated the home 293
field advantage index (HFAI), which quantifies the extent to which decomposition is faster or 294
slower at home. Results throughout the text and figures are presented as mean ± SE. Statistical 295
analyses were performed in GenStat (VSN International 2011). 296
2.3.1. HFAI calculation 297
The HFAI is useful to evaluate the results obtained from the reciprocal experiment in the context 298
of the home field advantage theory. The calculation was done according to Ayreset al.(2009). 299
In order to do so, we calculated ARMLa, ARMLb, BRMLaand BRMLb; which represent the Relative 300
Mass Loss (RML) of leaves from one specie at a certain site. For instance, ARMLarepresents the 301
relative mass loss of leaves from specie A at site a: 302
where Aaand Bacorrespond to the percent mass loss of leaf litter of two different species (i.e., A 304
and B) at site a. From these, HFAI was calculated as follows: 305
ܪܨܣܫ=ቂೃಾ ಽೌାೃಾ ಽ್
ଶ
ೃಾ ಽ್ାೃಾ ಽೌ
ଶ
ൗ ቃ× 100 − 100
306
3. Results 307
3.1. Differences in site and litter nutrient status 308
The two study sites differed in their nutrient status with greater TDN and readily-exchangeable P 309
concentrations at the palm swamp site, in line with Sjögerstenet al.(2011). This difference was 310
reflected in the nutrient status of the microbial community, which differed between the two sites: 311
the palm swamp had higher microbial N and P concentrations, lower microbial C:N ratios, and 312
higher microbial C:P ratios. 313
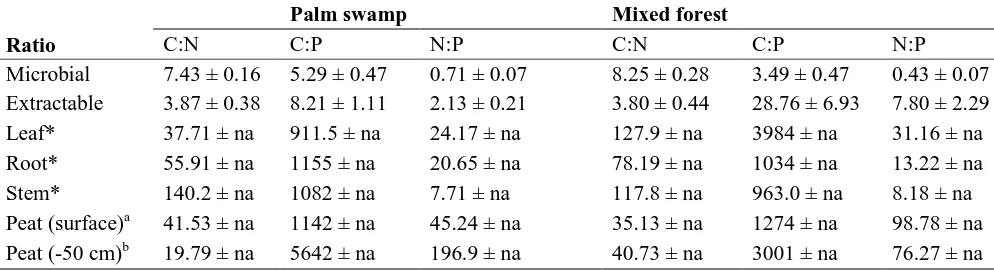
In control plots, C:N ratios were higher in the microbial fraction than in the extractable fraction, 314
while C:P and N:P ratios were lower in the microbial fraction (Table 1). Freshly fallen litter had 315
high C:N ratios but varied considerably among tissues and species withR. taedigerastems 316
having the highest C:N ratio, andR. taedigeraleaves having the lowest C:N ratio.R. taedigera 317
litter C:P ratios were comparable to the surface peat, while the peat C:P ratios at 50 cm depth 318
were much higher. TheC. panamensislitter had a more variable C:P ratio thanR. taedigerawith 319
leaf litter having four times as high ratios as root and stem tissue. The C:P ratios for all litter 320
types for both species was considerably greater than in the peat extractable and microbial 321
fractions. Litter N:P ratios were less than half of those found for surface peat, but higher than the 322
N:P ratios in the microbial and extractable fractions. 323
3.2. Nutrient addition experiment 325
326
3.2.1. Extractable and microbial nutrients 327
Five months after the nutrient addition, TDN and readily-exchangeable P were significantly 328
greater in plots where nutrients were applied (Nadd: F1,28= 8.71,P< 0.01; Padd: F1,56= 7.67,P< 329
0.01; Fig. 2), apart from TDN concentrations at the palm site. Neither DOC nor microbial C 330
varied significantly with nutrient addition (Nadd: F1,30= 1.53;P> 0.05; Padd: F1,30= 0.02;P> 331
0.05). Microbial biomass N and P did not increase in response to the fertilization treatment (Nadd: 332
F3,6= 0.87;P> 0.05; F3,6= 1.16;P> 0.05; at the palm and mixed forest, respectively; Padd: F2,11 333
= 1.04;P> 0.05; F2,10= 1.71;P> 0.05; at the palm and mixed forest, respectively; Fig. 2). 334
However, both the DOC/TDN (i.e. the extractable fraction) (Site × Nadd: F1,12= 13.66;P< 0.001) 335
and microbial C:N (Site × Nadd: F1,12= 5.59;P< 0.05) ratios decreased significantly in response 336
to N addition at the low nutrient mixed forest site (Fig. 3a,b); and there was a positive 337
relationship (F1, 23= 30.09;P< 0.001; R2= 0.56) between the DOC/TDN and microbial C:N 338
ratios (Fig. 3c). 339
340
3.2.2. Impacts of nutrient addition on extracellular enzymatic activity 341
Phosphomonoesterase activity was higher in the mixed forest site than at the palm swamp site 342
(F1,4= 58.28,P< 0.01) but was not affected by nutrient addition (F3,12= 1.95,P> 0.05) (Fig. 343
4a). The activity of phosphodiesterase did not vary between sites (F1,4= 4.23,P> 0.05) or 344
= 5.72,P< 0.05), while N addition increased arylsulfatase activity at the palm swamp but not at 346
the mixed forest site (Site × Nadd: F1,12= 5.5,P < 0.05) (Fig. 4c). β-glucosidase activity did not 347
vary between sites (Fig. 4d), but was increased by N addition at the palm swamp but not at the 348
mixed forest (Site × Nadd: F1,12= 4.03,P< 0.05). In contrast, P addition increasedN -acetyl-β-349
glucosaminidase activity at the mixed forest but not at the palm swamp (Site × Padd: F1,12= 350
14.19,P< 0.01) (Fig. 4e). 351
352
3.2.3. Impacts of nutrient addition on litter decomposition 353
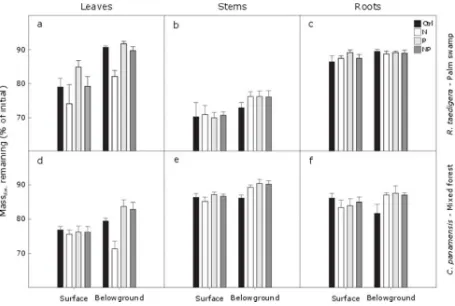
When decomposed at the surface, roots were the most recalcitrant tissue ofR. taedigera; whereas 354
stems were the most recalcitrant tissue ofC. panamensis(Fig. 5c,e). Leaves ofR. taedigera 355
decomposed slower thanC. panamensisleaves at the surface and belowground (Fig. 5a,d). 356
Leaves decomposed fastest amongC. panamensistissues; whereas stems decomposed fastest 357
amongR. taedigeratissues (Fig. 5b,d). 358
Nitrogen addition increased the belowground mass loss of bothR. taedigeraandC. panamensis 359
leaves by ~ 10% (Fig. 5a,d). However, this effect was not observed when N and P were applied 360
together. Phosphorus addition in isolation slightly reduced mass loss ofR. taedigeraandC. 361
panamensisleaves belowground (Fig. 5a,d). 362
363
Mass loss was consistently greater at the site of litter origin (F2,55= 101.48,P< 0.001) (Fig. 6). 365
Specifically, mass loss ofR. taedigeraleaves was approximately 6 % higher at the palm swamp 366
site compared to theR. taedigeralitter translocated to the mixed forest. This pattern was 367
repeated onC. panamensisleaves, with mass loss being 9 % higher in the mixed forest site 368
compared to theC. panamensisleaves translocated to the palm swamp. The home field 369
advantage index (HFAI) demonstrated a positive effect of 28 %. 370
371
4. Discussion 372
4.1. Nutrient controls of extra cellular hydrolytic enzyme activities and litter decomposition 373
As expected the mixed forest site had lower nutrient availability than the palm swamp site (Fig. 374
2) and we observed strong effects of the nutrient addition on both extractable (i.e. DOC/TDN) 375
and microbial C:N in the low nutrient mixed forest, but not in the nutrient rich palm swamp (Fig. 376
3). In contrast to our prediction that sites with microbial nutrient limitation would respond to 377
nutrient addition by down-regulating enzymes involved in nutrient acquisition, we found no 378
down-regulation of phosphomonoesterase activity at either site. However, in line with our 379
prediction, the activity of enzymes involved in the decomposition of large plant-derived 380
polymers, including β-glucosidase, arylsulfatase and N-acetyl-β-glucosaminidase, were enhanced 381
by N addition in surface peat in the palm swamp and by P addition in the mixed forest, 382
respectively (Fig. 4d, e). This reflects differences in the nutrient levels at the two sites: low N 383
relative to P concentrations at the palm swamp and low P concentrations in the mixed forest 384
(Olander & Vitousek 2000; Sjögerstenet al.2011) and suggests that the degradation of sugars as 385
nutrient status in agreement with findings from higher latitude peatlands (Bubieret al.2003; 387
Wanget al.2014). 388
389
In contrast to our prediction that nutrient addition would accelerate litter mass loss at the low 390
nutrient site, but have little effect, at the high nutrient palm site, N addition increased mass loss 391
of leaf litter deeper in the peat profile by ~ 10 % (Fig. 5a,d). This is important because foliar 392
litter inputs represent a sizable fraction (~ 30%) of the total C inputs from net primary 393
productivity (NPP; 333 g C m-2yr-1; Sjögerstenet al.2014) and partially decomposed leaf litter 394
contributes to long term C storage in peatlands as it becomes buried and preserved over time due 395
to water logged conditions (Hoyos-Santillanet al.2015). Nitrogen addition affected leaf litter 396
decomposition only at depth, indicating that nutrient limitation is an additional constraint on 397
decomposition under anaerobic conditions, and/or that nutrient limitation is more pronounced in 398
deeper, more degraded peat. Furthermore, shifts in the microbial community composition and a 399
reduction in microbial activity in response to anaerobic conditions are likely to slow nutrient 400
mineralization at depth (Jacksonet al.2009). 401
Variation in mass loss responses to N addition among litter types, with leaves decomposing 402
faster with N addition but roots and stems being unaffected, is presumably linked to differences 403
in litter organic chemistry among tissue types (Hobbie & Vitousek 2000). For example, root and 404
stem tissues from the two study species contained greater concentrations of lignin than leaves, 405
making them more recalcitrant to decomposition (Hoyos-Santillanet al.2015). As lignin 406
decomposition is strongly limited by oxygen availability (Zeikus 1981), it is plausible that 407
availability, explaining why only decomposition of labile leaf litter tissue was enhanced by the N 409
addition under the water logged conditions at 50 cm depth. 410
Phosphorus addition reduced litter mass loss, in contrast to our prediction. This might be linked 411
to suppression of phenol oxidase activity, as suggested by findings from mangrove and mineral 412
soil systems (Keuskampet al.2015a; Qiet al.2016), possibly due to a reduction in fungal 413
activity in response to greater concentrations of mineral P (Tien & Myer 1990; Hobbie 2000). As 414
a reduction in phenoloxidase activity may reduce decomposition of complex C (Freemanet al. 415
2004), suppression of phenol oxidase activity by P addition in our study might therefore explain 416
the reduction in decomposition in P treated plots. 417
Taken together, our findings in part support our hypothesis that nutrient availability influences 418
litter decomposition and activities of extra cellular hydrolytic enzymes. Nutrient addition 419
increased the activities of extra cellular enzymes involved in degradation of large plant 420
molecules, and increased leaf litter decomposition under anoxic conditions at depth following N 421
addition. However, high C:N or C:P ratios in the bulk litter tissues, relative to low C:N and C:P 422
ratios in the microbial biomass, which are at the lower range of C:N and C:P ratios for the 423
microbial biomass reported in the literature (Cleveland & Liptzin 2007; Xu, Thornton & Post 424
2013), did not predict which litter types were most affected by nutrient addition. Instead, 425
microbial C:N ratios were clearly related to the C:N ratios in the extractable dissolved fraction, 426
suggesting a decoupling between bulk litter chemistry and microbial stoichiometric ratios in line 427
with Faninet al.(2013), although the slope of the relationship shown in this study is steeper. 428
Furthermore, decomposition of leaf litters, which has the lowest lignin:N ratios of the different 429
tissue types (Hoyos-Santillanet al.2015), were most responsive to N addition. These somewhat 430
processes controlling litter decomposition in line with stoichiometric theory (Sterner & Elser 432
2002), low nutrient availability does not seem to exert a strong control of litter decomposition in 433
these two peat swamp forest communities. Instead, nutrient limitation appears to be mediated by 434
litter chemistry and position in the peat profile, reflecting peat oxygen levels (Hoyos-Santillanet 435
al.2016). 436
437
4.2 Home field advantage in the context of contrasting site nutrient status 438
Our findings of a strong positive HFA effect supported our prediction that palm leaf litter would 439
degrade faster at the palm site, while the litter from the low nutrient mixed forest would degrade 440
fastest at the mixed forest site (Fig. 6). The HFA index (28 %) was at the upper range for HFAI 441
reported in the literature (Ayreset al.2009; Veenet al.2015), which we speculate was driven by 442
the two litter species belonging to contrasting plant functional types (i.e. palm vs evergreen 443
broad leaved), which has previously been show to result in strong HFA effects and the 444
contrasting site nutrient levels (Ayreset al.2009; Veenet al.2015). 445
Furthermore, the alternative prediction that a site with higher nutrient status would increase litter 446
decomposition rates was not supported by our findings, becauseC. panamensisleaf litter 447
degraded at a marginally greater rate at the low nutrient mixed forest site than theR. taedigera 448
leaf litter at the palm site, while root litter decomposition was comparable when incubated at the 449
peat surface (Fig. 2, 5). Although the slower stem decomposition ofC. panamensiscompared 450
withR. taedigeramight be linked to low nutrient levels at the mixed forest site, contrasting 451
might also influence decomposition rates (Hoyos-Santillanet al.2015), as tissue chemistry 453
strongly affect decomposition rates (e.g. Baumannet al.2009). 454
The translocation experiment clearly supported the HFA theory. Despite greater fertility at the 455
palm swamp site (Fig. 2), which we assumed would enhance decomposition rates, decomposition 456
was always greater for autochthonous litter even when litter was decomposing in the lower 457
nutrient environment. This suggests that the microbial community is adapted to decompose site-458
specific litter and that a well-adapted decomposer community is more important for 459
decomposition than nutrient availability. This notion is supported by the fact that distinct soil 460
microbial communities accompany particular forest communities within the peatland (Troxleret 461
al.2012), suggesting that different consortia of microorganisms are responsible for litter 462
decomposition at the two different sites. This is consistent with previous findings in temperate, 463
subtropical and tropical forests (Huntet al.1988; Gholzet al.2000; Mayor & Henkel 2006; 464
Zhouet al.2008; Austinet al.2014). For example, it is plausible that different microbial 465
communities produce different enzymes (Kaiseret al.2014) suggesting that microbial 466
communities involved in decomposition are specialized rather than being functionally redundant 467
(Schimel & Schaeffer 2012; Keiseret al.2014). 468
469
4.3 Peatland C dynamics in the context of nutrient limitation and HFA 470
471
Our results indicate that nutrient limitation is an important control of decomposition processes in 472
the peat profile where nutrient levels tend to be low (Hoyos-Santillanet al.2015). However, 474
given that nutrient addition did not accelerate litter mass loss at the peat surface, which is 475
governed by oxic conditions and generally has a faster decomposition rate (Hoyos-Santillanet al. 476
2015), there does not appear to be a “nutrient latch” on C loss from litter decomposition in this 477
peatland. Our results also support HFA theory, indicating that microbial adaptations to the 478
conditions found at a given site can overcome factors often considered to exert strong controls of 479
litter decomposition rates, such as low nutrient availability. 480
In the context of long-term peatland carbon dynamics, our study demonstrates that stoichiometric 481
ecological theory applies to peatland decomposition processes, particularly under conditions 482
where oxygen and nutrient levels are low but the organic material is relatively labile (i.e. long 483
term preservation of leaf litter through the water logged parts of the peat profile). Our study also 484
suggests that decomposition rates at the peatland surface may remain high across contrasting 485
plant phasic communities as a result of a specialised decomposer communities adapted to these 486
“home” conditions. Finally, our results show that contrasting tissue chemistry should not be used 487
as a predictor ofin situdecomposition rates, or different litters contribution to long term peatland 488
C storage without considering the associated decomposer community at a given site. 489
490
Acknowledgments 491
J.H.S. thanks The National Council on Science and Technology (CONACyT-Mexico) for his 492
PhD scholarship (211962). The authors also thank the Light Hawk program for its support in the 493
aerial surveys. We thank Erick Brown for field assistance, and Gabriel Jácome, Plinio Góndola, 494
and Darren Hepworth for logistical and laboratory support. The authors declare that there are no 496
conflicts of interest. 497
Data accessibility 498
Data to support this article is publicly available at Dryad Digital Repository (Hoyos-Santillanet 499
al.2017; doi:10.5061/dryad.460mc). 500
501
References 502
Allison, V.J., Condron, L.M., Peltzer, D.A., Richardson, S.J. & Turner, B.L. (2007) Changes in 503
enzyme activities and soil microbial community composition along carbon and nutrient 504
gradients at the Franz Josef chronosequence, New Zealand. Soil Biology and Biochemistry, 505
39, 1770–1781. 506
Andersen, J. (1976) An ignition method for determination of total phosphorus in lake sediments. 507
Water Research,10, 329–331. 508
Austin, A.T., Vivanco, L., González-Arzac, A. & Pérez, L.I. (2014) There’s no place like home? 509
An exploration of the mechanisms behind plant litter-decomposer affinity in terrestrial 510
ecosystems.The New phytologist,204, 307–314. 511
Ayres, E., Steltzer, H., Simmons, B.L., Simpson, R.T., Steinweg, J.M., Wallenstein, M.D., Mellor, 512
N., Parton, W.J., Moore, J.C. & Wall, D.H. (2009) Home-field advantage accelerates leaf 513
litter decomposition in forests.Soil Biology and Biochemistry,41, 606–610. 514
Baumann, K., Marschner, P., Smernik, R.J. & Baldock, J.A. (2009) Residue chemistry and 515
Soil Biology and Biochemistry,41, 1966–1975. 517
Brady, M.A. (1997) Organic Matter Dynamics of Coastal Peat Deposits in Sumatra, Indonesia. 518
The University of British Columbia. 519
Bragazza, L., Buttler, A., Habermacher, J., Brancaleoni, L., Gerdol, R., Fritze, H., Hanajík, P., 520
Laiho, R. & Johnson, D. (2012) High nitrogen deposition alters the decomposition of bog 521
plant litter and reduces carbon accumulation.Global Change Biology,18, 1163–1172. 522
Brookes, P.P.C., Landman, A., Pruden, G. & Jenkinson, D.D.S. (1985) Chloroform fumigation 523
and the release of soil nitrogen: A rapid direct extraction method to measure microbial 524
biomass nitrogen in soil.Soil Biology and Biochemistry,17, 837–842. 525
Bubier, J., Crill, P., Mosedale, A., Frolking, S. & Linder, E. (2003) Peatland responses to varying 526
interannual moisture conditions as measured by automatic CO2 chambers. Global 527
Biogeochemical Cycles,17, 35.1-35.15. 528
Chimner, R.A. & Ewel, K.C. (2005) A tropical freshwater wetland: II. Production, decomposition, 529
and peat formation.Wetlands Ecology and Management,13, 671–684. 530
Cleveland, C.C. & Liptzin, D. (2007) C:N:P stoichiometry in soil: is there a “Redfield ratio” for 531
the microbial biomass?Biogeochemistry,85, 235–252. 532
Cornwell, W.K., Cornelissen, J.H.C., Amatangelo, K., Dorrepaal, E., Eviner, V.T., Godoy, O., 533
Hobbie, S.E., Hoorens, B., Kurokawa, H., Pérez-Harguindeguy, N., Quested, H.M., Santiago, 534
L.S., Wardle, D.A., Wright, I.J., Aerts, R., Allison, S.D., van Bodegom, P., Brovkin, V., 535
Chatain, A., Callaghan, T. V., Díaz, S., Garnier, E., Gurvich, D.E., Kazakou, E., Klein, J.A., 536
Read, J., Reich, P.B., Soudzilovskaia, N.A., Vaieretti, M.V. & Westoby, M. (2008) Plant 537
worldwide.Ecology Letters,11, 1065–1071. 539
Dommain, R., Couwenberg, J. & Joosten, H. (2011) Development and carbon sequestration of 540
tropical peat domes in south-east Asia: links to post-glacial sea-level changes and Holocene 541
climate variability.Quaternary Science Reviews,30, 999–1010. 542
Fanin, N., Fromin, N., Buatois, B. & Hättenschwiler, S. (2013) An experimental test of the 543
hypothesis of non-homeostatic consumer stoichiometry in a plant litter-microbe system (ed E 544
Cleland).Ecology Letters,16, 764–772. 545
Feller, I.C. (1995) Effects of Nutrient Enrichment on Growth and Herbivory of Dwarf Red 546
Mangrove (Rhizophora Mangle).Ecological Monographs,65, 477. 547
Freeman, C., Ostle, N.J., Fenner, N. & Kang, H. (2004) A regulatory role for phenol oxidase during 548
decomposition in peatlands.Soil Biology and Biochemistry,36, 1663–1667. 549
Freeman, C., Ostle, N. & Kang, H. (2001) An enzymic “latch” on a global carbon store.Nature, 550
409, 149. 551
Galloway, J.N., Dentener, F.J., Capone, D.G., Boyer, E.W., Howarth, R.W., Seitzinger, S.P., 552
Asner, G.P., Cleveland, C.C., Green, P.A., Holland, E.A., Karl, D.M., Michaels, A.F., Porter, 553
J.H., Townsend, A.R. & Vöosmarty, C.J. (2004) Nitrogen Cycles: Past, Present, and Future. 554
Biogeochemistry,70, 153–226. 555
Gholz, H.L., Wedin, D.A., Smitherman, S.M., Harmon, M.E. & Parton, W.J. (2000) Long-term 556
dynamics of pine and hardwood litter in contrasting environments: toward a global model of 557
decomposition.Global Change Biology,6, 751–765. 558
Gorham, E., Janssens, J.A. & Glaser, P.H. (2003) Rates of peat accumulation during the postglacial 559
Minnesota.Canadian Journal of Botany,81, 429–438. 561
Hobbie, S.E. (2000) Interactions between litter lignin and soil nitrogen availability during leaf 562
litter decomposition in a Hawaiian montane forest.Ecosystems,3, 484–494. 563
Hobbie, S.E. & Vitousek, P.M. (2000) Nutrient limitation of decomposition in hawaiian forests. 564
Ecology,81, 1867–1877. 565
Hoyos-Santillan, J. (2014) Controls of Carbon Turnover in Lowland Tropical Peatlands. The 566
University of Nottingham. 567
Hoyos-Santillan, J., Lomax, B.H., Large, D., Turner, B.L., Boom, A., Lopez, O.R. & Sjögersten, 568
S. (2015) Getting to the root of the problem: litter decomposition and peat formation in 569
lowland Neotropical peatlands.Biogeochemistry,126, 115–129. 570
Hoyos-Santillan, J., Lomax, B.H., Large, D., Turner, B.L., Boom, A., Lopez, O.R. & Sjögersten, 571
S. (2016) Quality not quantity: Organic matter composition controls of CO2 and CH4 fluxes 572
in neotropical peat profiles.Soil Biology and Biochemistry,103, 86–96. 573
Hoyos-Santillan, J., Lomax, B.H., Turner, B.L. & Sjögersten, S. (2017) Data from: Nutrient 574
limitation or home field advantage: does microbial community adaptation overcome nutrient 575
limitation of litter decomposition in a tropical peatland? 576
Hunt, H.W., Ingham, E.R., Coleman, D.C., Elliott, E.T. & Reid, C.P.P. (1988) Nitrogen Limitation 577
of Production and Decomposition in Prairie, Mountain Meadow, and Pine Forest.Ecology, 578
69, 1009–1016. 579
IPCC. (2013)Climate Change 2013: The Physical Science Basis. Contribution of Working Group 580
I to the Fifth Assessment Report of the Intergovernmental Panel on Climate Change(eds TF 581
and PM Midgley). Cambridge University Press, Cambridge, United Kingdom and New York, 583
NY, USA. 584
Jackson, C.R., Liew, K.C. & Yule, C.M. (2009) Structural and functional changes with depth in 585
microbial communities in a tropical Malaysian peat swamp forest. Microbial ecology, 57, 586
402–12. 587
Kaiser, C., Franklin, O., Dieckmann, U. & Richter, A. (2014) Microbial community dynamics 588
alleviate stoichiometric constraints during litter decay (ed N Johnson). Ecology Letters,17, 589
680–690. 590
Keuskamp, J.A., Feller, I.C., Laanbroek, H.J., Verhoeven, J.T.A. & Hefting, M.M. (2015a) Short-591
and long-term effects of nutrient enrichment on microbial exoenzyme activity in mangrove 592
peat.Soil Biology and Biochemistry,81, 38–47. 593
Keuskamp, J.A., Hefting, M.M., Dingemans, B.J.J., Verhoeven, J.T.A. & Feller, I.C. (2015b) 594
Effects of nutrient enrichment on mangrove leaf litter decomposition.The Science of the total 595
environment,508, 402–10. 596
Keuskamp, J.A., Schmitt, H., Laanbroek, H.J., Verhoeven, J.T.A. & Hefting, M.M. (2013) 597
Nutrient amendment does not increase mineralisation of sequestered carbon during 598
incubation of a nitrogen limited mangrove soil.Soil Biology and Biochemistry,57, 822–829. 599
Knorr, M., Frey, S.D., Curtis, P.S. & Knorr, A.M. (2005) Nitrogen additions and litter 600
decomposition: A meta-analysis.Ecology,86, 3252–3257. 601
Kurnianto, S., Warren, M., Talbot, J., Kauffman, B., Murdiyarso, D. & Frolking, S. (2015) Carbon 602
accumulation of tropical peatlands over millennia: A modeling approach. Global Change 603
Manzoni, S. & Porporato, A. (2009) Soil carbon and nitrogen mineralization: Theory and models 605
across scales.Soil Biology and Biochemistry,41, 1355–1379. 606
Mayor, J.R. & Henkel, T.W. (2006) Do ectomycorrhizas alter leaf-litter decomposition in 607
monodominant tropical forests of Guyana?The New phytologist,169, 579–88. 608
Myers, R.G., Thien, S.J. & Pierzynski, G.M. (1999) Using an Ion Sink to Extract Microbial 609
Phosphorus from Soil.Soil Science Society of America Journal,63, 1229. 610
Olander, L.P. & Vitousek, P.M. (2000) Regulation of soil phosphatase and chitinase activityby N 611
and P availability.Biogeochemistry,49, 175–191. 612
Page, S.E., Rieley, J.O., Shotyk, W. & Weiss, D. (1999) Interdependence of peat and vegetation 613
in a tropical peat swamp forest. Philosophical transactions of the Royal Society of London. 614
Series B, Biological sciences,354, 1885–97. 615
Phillips, S., Rouse, G.E.G. & Bustin, R.M. (1997) Vegetation zones and diagnostic pollen profiles 616
of a coastal peat swamp, Bocas del Toro, Panamá. Palaeogeography, Palaeoclimatology, 617
Palaeoecology,128, 301–338. 618
Qi, R., Li, J., Lin, Z., Li, Z., Li, Y., Yang, X., Zhang, J. & Zhao, B. (2016) Temperature effects on 619
soil organic carbon, soil labile organic carbon fractions, and soil enzyme activities under long-620
term fertilization regimes.Applied Soil Ecology,102, 36–45. 621
Quested, H.M., Callaghan, T. V., Cornelissen, J.H.C. & Press, M.C. (2005) The impact of 622
hemiparasitic plant litter on decomposition: Direct, seasonal and litter mixing effects.Journal 623
of Ecology,93, 87–98. 624
Schimel, J.P. & Schaeffer, S.M. (2012) Microbial control over carbon cycling in soil.Frontiers in 625
Sinsabaugh, R.L. & Follstad Shah, J.J. (2012) Ecoenzymatic Stoichiometry and Ecological 627
Theory.Annual Review of Ecology, Evolution, and Systematics,43, 313–343. 628
Sjögersten, S., Black, C.R., Evers, S., Hoyos-Santillan, J., Wright, E.L. & Turner, B.L. (2014) 629
Tropical wetlands: A missing link in the global carbon cycle?Global Biogeochemical Cycles, 630
28, 1371–1386. 631
Sjögersten, S., Cheesman, A.W., Lopez, O. & Turner, B.L. (2011) Biogeochemical processes 632
along a nutrient gradient in a tropical ombrotrophic peatland. Biogeochemistry, 104, 147– 633
163. 634
Sterner, R.W. & Elser, J.J. (2002) Ecological Stoichiometry: The Biology of Elements from 635
Molecules to the Biosphere. 636
Tien, M. & Myer, S.B. (1990) Selection and characterization of mutants of Phanerochaete 637
chrysosporium exhibiting ligninolytic activity under nutrient-rich conditions. Applied and 638
Environmental Microbiology,56, 2540–2544. 639
Troxler, T.G. (2007) Patterns of phosphorus, nitrogen and δ15N along a peat development gradient
640
in a coastal mire, Panama.Journal of Tropical Ecology,23, 683–691. 641
Troxler, T.G., Ikenaga, M., Scinto, L., Boyer, J.N., Condit, R., Perez, R., Gann, G.D. & Childers, 642
D.L. (2012) Patterns of Soil Bacteria and Canopy Community Structure Related to Tropical 643
Peatland Development.Wetlands,32, 769–782. 644
Turner, B.L. (2010) Variation in pH Optima of Hydrolytic Enzyme Activities in Tropical Rain 645
Forest Soils.Applied and Environmental Microbiology,76, 6485–6493. 646
Turner, B.L. & Romero, T.E. (2009) Short-Term Changes in Extractable Inorganic Nutrients 647
1972. 649
Vance, E.D., Brookes, P.C. & Jenkinson, D.S. (1987) An extraction method for measuring soil 650
microbial biomass C.Soil Biology and Biochemistry,19, 703–707. 651
Veen, G.F.C., Freschet, G.T., Ordonez, A. & Wardle, D.A. (2015) Litter quality and environmental 652
controls of home-field advantage effects on litter decomposition.Oikos,124, 187–195. 653
Vivanco, L. & Austin, A.T. (2008) Tree species identity alters forest litter decomposition through 654
long-term plant and soil interactions in Patagonia, Argentina. Journal of Ecology,96, 727– 655
736. 656
VSN International. (2011) GenStat for Windows 14th Edition. 657
Wang, M., Moore, T.R., Talbot, J. & Richard, P.J.H. (2014) The cascade of C:N:P stoichiometry 658
in an ombrotrophic peatland: from plants to peat.Environmental Research Letters,9, 24003. 659
Wieder, R.K. & Lang, G.E. (1982) A Critique of the Analytical Methods Used in Examining 660
Decomposition Data Obtained From Litter Bags.Ecology,63, 1636. 661
Wright, E., Black, C.R., Cheesman, A.W., Drage, T., Large, D., Turner, B.L. & Sjögersten, S. 662
(2011) Contribution of subsurface peat to CO2 and CH4 fluxes in a neotropical peatland. 663
Global Change Biology,17, 2867–2881. 664
Wright, E., Black, C.R., Cheesman, A.W., Turner, B.L. & Sjögersten, S. (2013) Impact of 665
simulated changes in water table depth on ex situ decomposition of leaf litter from a 666
Neotropical peatland.Wetlands,33, 217–226. 667
Xu, X., Thornton, P. & Post, W. (2013) A global analysis of soil microbial biomass carbon, 668
nitrogen and phosphorus in terrestrial ecosystems. Global Ecology and Biogeography, 22, 669
Yule, C.M. & Gomez, L.N. (2009) Leaf litter decomposition in a tropical peat swamp forest in 671
Peninsular Malaysia.Wetlands Ecology and Management,17, 231–241. 672
Zeikus, J.G. (1981) Lignin metabolism and the carbon cycle. Advances in microbial ecology (ed 673
M. Alexander), pp. 211–243. Springer US, New York. 674
Zhou, G., Guan, L., Wei, X., Tang, X., Liu, S., Liu, J., Zhang, D. & Yan, J. (2008) Factors 675
influencing leaf litter decomposition: an intersite decomposition experiment across China. 676
Plant and Soil,311, 61–72. 677
678
Table captions 680
Table 1 Mass-based ratios among C, N and P in different substrate types at the palm swamp and 681
mixed forest sites.
682
Table 1.Mass-based ratios among C, N and P in different substrate types at the palm swamp and mixed forest sites. Palm swamp Mixed forest
Ratio C:N C:P N:P C:N C:P N:P
Microbial 7.43 ± 0.16 5.29 ± 0.47 0.71 ± 0.07 8.25 ± 0.28 3.49 ± 0.47 0.43 ± 0.07 Extractable 3.87 ± 0.38 8.21 ± 1.11 2.13 ± 0.21 3.80 ± 0.44 28.76 ± 6.93 7.80 ± 2.29 Leaf* 37.71 ± na 911.5 ± na 24.17 ± na 127.9 ± na 3984 ± na 31.16 ± na Root* 55.91 ± na 1155 ± na 20.65 ± na 78.19 ± na 1034 ± na 13.22 ± na Stem* 140.2 ± na 1082 ± na 7.71 ± na 117.8 ± na 963.0 ± na 8.18 ± na Peat (surface)a 41.53 ± na 1142 ± na 45.24 ± na 35.13 ± na 1274 ± na 98.78 ± na
Peat (-50 cm)b 19.79 ± na 5642 ± na 196.9 ± na 40.73 ± na 3001 ± na 76.27 ± na *Litter areR. taedigeraandC. panamensisfor the palm swamp and mixed forest, respectively.
a,b
Peat samples were taken before the nutrient treatment was applied (October 2011) from the top 10 cm of the peat profile.
[image:34.595.50.305.569.706.2]Figure captions 683
Figure 1 Schematic diagram outlining the experimental set up for the nutrient addition, (Ctrl) 684
control, (N) nitrogen and (P) phosphorous. The same set up was used at the palm swamp and the 685
mixed forest sites. Ten blocks were set up at each site with litterbags placed both at the peat surface 686
and at 50 cm depth. 687
Figure 2Comparison of extractable (solid bars) and microbial (hatched bars) Ctrl, N and P in 689
surface peat at the two study sites, (a,c,e palm swamp; b,d,f mixed forest). Dissolved organic 690
carbon (a, b), readily-exchangeable P (c, d) and total dissolved N (e, f), after 5 months of the in 691
situnutrient addition. Note the different scales on the ordinate axis when comparing palm swamp 692
and mixed forest. Statistical analyses are presented in the text. 693
[image:35.595.67.342.240.614.2]694
Figure 3Effects of the nutrient addition treatment on the C:N ratio in: a) the extractable fraction 695
(i.e. DOC/TDN), b) the microbial biomass and c) the relationship between the C:N ratio in the 696
698
Figure 4Hydrolytic enzymes activity (nmol MU g-1min-1): a) Phosphomonoesterase (MUP), b) 699
Phosphodiesterase (BisMUP), c) Arylsulfatase (MUS), d) β-glucosidase (MUBG) and e) N-700
acetyl-β-glucosaminidase (MUNA). Surface peat samples were taken 5 months after the in situ 701
703
Figure 5Effect of nutrient addition (Control (Ctrl), N, P and N+P) on thein situ% of mass 704
remaining.R. taedigeralitter mass remaining of (a) leaves, (b) stems, (c) roots after 5 months. 705
REML outputs are: Tissue: F2,215= 121.12,P< 0.001; Surface/Belowground: F1,215= 38.88,P< 706
0.001; Treatment: F3,215= 3.14,P< 0.05; Tissue × Surface/Belowground: F2,215= 7.33,P< 707
0.001; Tissue × Treatment: F6,215= 2.97,P< 0.01; Surface/Belowground × Treatment: F3,215= 708
0.19,P> 0.05; Tissue × Surface/Belowground × Treatment: F6,215= 0.44,P> 0.05.C. 709
panamensislitter mass remaining of (d) leaves, (e) stems, (f) roots after 5 months. REML 710
outputs are: Tissue: F2,209= 95.21,P< 0.001; Surface/Belowground: F1,209= 15.33,P< 0.001; 711
Tissue × Treatment: F6,209= 2.38,P< 0.05; Surface/Belowground × Treatment: F3,209= 4.23,P< 713
0.01; Tissue × Surface/Belowground × Treatment: F6,215= 3.14,P< 0.01 714
715
[image:38.595.71.526.168.474.2]716
Figure 6Mass remaining (%) ofR. taedigera(palm swamp species) andC. panamensis(mixed 717
forest species) leaf litter after 5 months of decomposition as part of the translocation experiment 718
between palm swamp and mixed forest sites. Litterbags were placed at the peat surface. 719
Statistical analyses are presented in the text. 720
722