COMMISSION OF THE EUROPEAN COMMUNITIES
Brussels, 3.12.2002 SEC(2002) 1329
COMMISSION STAFF WORKING PAPER
Technical Annexes of the
Eighth Report on the Implementation of the Telecommunications Regulatory Package
COMMISSION OF THE EUROPEAN COMMUNITIES
Brussels, 3.12.2002 SEC(2002) 1329
COMMISSION STAFF WORKING PAPER
Technical Annexes of the
Eighth Report on the Implementation of the Telecommunications Regulatory Package
CORRIGENDUM
ANNEX 1
TABLE OF CONTENTS
1 PLAYERS IN THE FIXED MARKET ...7
1.1. LICENSING REGIMES IN THE MEMBER STATES ...8
1.2. NUMBER OF FIXED TELECOMMUNICATIONS OPERATORS...10
1.3. INCUMBENTS MARKET SHARE ON FIXED TELEPHONY MARKET ...17
1.4. SHARE OF PUBLIC OWNERSHIP IN INCUMBENT OPERATORS...20
1.5. ADMINISTRATIVE AND NUMBERING FEES FOR THE PROVISION OF PUBLIC VOICE TELEPHONY AND PUBLIC NETWORK SERVICES ...21
2 CONSUMER’S CHOICE OF FIXED OPERATORS...27
2.1. PERCENTAGE OF SUBSCRIBERS WITH CHOICE OF OPERATORS FOR FIXED CALLS...27
2.2. PERCENTAGE OF SUBSCRIBERS ACTUALLY USING AN ALTERNATIVE PROVIDER OTHER THAN THE INCUMBENT ...29
2.3. FACILITIES USED BY NEW ENTRANTS TO PROVIDE VOICE TELEPHONY ...30
3 PUBLIC NETWORK INTERCONNECTION AND INTERCONNECTION CHARGES...33
3.1. FIXED-TO-FIXED INTERCONNECTION CHARGES...33
3.2. LEASED LINE INTERCONNECTION CHARGES...35
3.3. FIXED-TO-MOBILE INTERCONNECTION CHARGES ...40
4 MOBILE MARKET...45
4.1. MOBILE PENETRATION...45
4.2. PLAYERS IN THE MOBILE MARKET...47
4.3. OPERATORS’ MARKET SHARES...49
4.4. MOBILE BASKET ...51
5 LOCAL ACCESS AND PRICING ...55
5.1. BROADBAND ACCESS ...55
5.2. PRICES FOR UNBUNDLED LOCAL LOOP...62
6 INTERNET SERVICES ...67
6.1. INTERNET MARKET DATA ...67
6.2. INTERNET ACCESS PRICING...69
7 PUBLIC VOICE TELEPHONY TARIFFS ...71
7.1. CHARGING SYSTEM...72
7.2. MONTHLY RENTAL CHARGED BY THE INCUMBENT OPERATORS...74
7.3. AVERAGE MONTHLY EXPENDITURE (COMPOSITE CALL BASKET) ...76
7.4. FIXED NATIONAL CALLS ...78
7.5. TREND OF THE BASKET FOR FIXED NATIONAL CALLS (NATIONAL BASKET)...81
7.6. ALTERNATIVE NATIONAL OPERATORS...82
7.7. PRICE OF AN AVERAGE FIXED INTERNATIONAL CALL (INTERNATIONAL CALL BASKET) ...84
7.8. PRICE OF CALLS TO EU, JAPAN, USA ...86
7.9. ALTERNATIVE INTERNATIONAL OPERATORS ...88
8 LEASED LINES RETAIL TARIFFS...91
8.1. INCUMBENTS' NATIONAL LEASED LINES...91
8.2. NATIONAL LEASED LINES PRICE TRENDS (1 AUGUST 1998 - 1 AUGUST 2002)...97
8.3. INTERNATIONAL LEASED LINES PRICES ...98
8.4. INTERNATIONAL LEASED LINES PRICE TRENDS (1 AUGUST 1998 - 1 AUGUST 2002)...102
9 EXCHANGE RATES...103
9.1. EXCHANGE RATE USED IN SECTION 6 ON INTERNET, SECTION 7 ON PUBLIC VOICE TELEPHONY TARIFFS AND SECTION 8 ON LEASED LINE TARIFFS. ...103
9.2. EXCHANGE RATE USED IN SECTION 1.5 ON ADMINISTRATIVE AND NUMBERING FEES ...103
1 PLAYERS IN THE FIXED MARKET
This section analyses the situation of the market players in the fixed telecommunications market (voice telephony and network services): number of operators authorised to operate a network and to provide public fixed voice telephony, number of players actually active in the market, licence fees for fixed services, market shares and the public ownership in the incumbent operators.
Data are based on the replies to the European Commission questionnaire provided by the national regulatory authorities and gives the situation as at August 2002.
The following definitions apply:
• Public network operators are defined as operators that install, manage and operate a telecommunications transmission network to provide public telephony services or public network services1 (i.e. provision of leased lines).
• Public fixed voice telephony is defined as a service available to the public for the direct transport on a commercial basis of real-time speech via the public switched network, such that any user can use equipment connected to a network termination point at a fixed location to communicate with another user of equipment connected to another termination point. Voice telephone could be provided on an own self-operated network or on a leased network.
• Public fixed voice telephony (not including the installation of the network): provision of national and international public voice telephony by service providers that operate, control and manage the transmission capacity which is leased from other operators. Simple call-back and calling card services and operators dealing only with marketing, billing, etc., are excluded. The definition of service provider may differ from that used in the national law of individual countries (in some countries non-self operated network operators engage exclusively in reselling activities).
• Public voice telephony on an own self-operated network (not including network services): provision of public fixed voice telephony over a network fully controlled, operated and (wholly or partially) owned by the operator, excluding the provision of network services.
• Local operators are operators authorised to offer telecommunications services only to users located in specific areas (to whom they provide local calls as well as long-distance and international calls through interconnection agreements with other operators).
• National operators are operators authorised to offer telecommunications services without any geographical restriction. They may provide all types of telephony services (local, long-distance and international calls) to users located throughout the national territory.
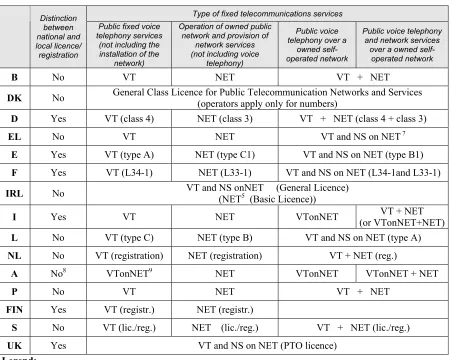
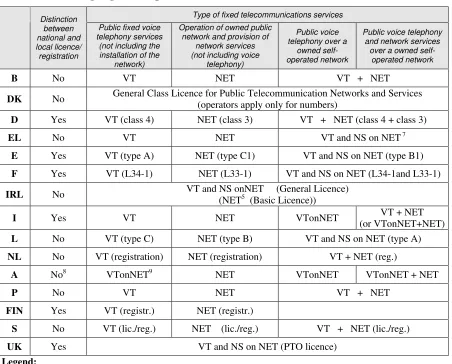
1.1.LICENSING REGIMES IN THE MEMBER STATES
A variety of different national licensing regimes can be identified across Member States: telecommunications operators2 may have individual licences/authorisations or be subject to registration/notification procedures, or may effectively operate in the market without being subject to any individual licence or declaration procedure. Furthermore, depending on the national licensing regime, in order to provide a particular service, the operators may have to hold (and pay for) a number of different licences or may have to pay for a licence with a wider scope than they require (i.e. nation-wide), even if they do not make full use of it.
Table 1 shows the licensing regimes in the 15 Member States for the four main categories of fixed services. The first column indicates whether the national licence regime provides for geographical restriction on the licence (local or national). The rest of the table shows the type of licence (or licences) required for four types of telecommunications service (see above for the definitions): public fixed voice telephony (not including the installation of the network); operation of a public network and provision of network services (not including voice telephony); public voice telephony on a owned self-operated network (not including the provision of network services); public voice telephony and network services on a owned self-operated network.
In the Netherlands and Finland the licence regimes provide for a registration/notification system. In Sweden both individual licence and registration systems are applied3. The Danish licensing regime system does not even require a notification.
In Greece public voice telephony can be provided by way of both an individual licence and a general authorisation, but in the latter case operators are not allowed to use numbers4.
The rest of the countries apply a system of individual licences. In the United Kingdom and Ireland a single fixed telecommunications licence exists, whatever the types of public service provided (voice telephony and/or public network)5. In Austria a single licence for voice telephony services exists, whether or not the operators self-operate a owned or a leased network. Belgium, Germany, Portugal and Sweden provide only two types of fixed licences (voice telephony services and public network), while the other countries also provide a single licence which combines several categories of more limited individual licences (i.e. public voice telephony on a owned self-operated network; public voice telephony and network services on an own self-operated network)6.
2 In the following, “operators” means both network operators and service providers; “authorised operators” means operators that have been granted an individual licence/authorisation or are subject to a declaration/notification procedure.
Table 1. Licensing regime for public fixed services
Type of fixed telecommunications services Distinction
between national and local licence/ registration
Public fixed voice telephony services
(not including the installation of the
network)
Operation of owned public network and provision of
network services (not including voice
telephony)
Public voice telephony over a
owned self-operated network
Public voice telephony and network services
over a owned self-operated network
B No VT NET VT + NET
DK No General Class Licence for Public Telecommunication Networks and Services (operators apply only for numbers)
D Yes VT (class 4) NET (class 3) VT + NET (class 4 + class 3)
EL No VT NET VT and NS on NET 7
E Yes VT (type A) NET (type C1) VT and NS on NET (type B1)
F Yes VT (L34-1) NET (L33-1) VT and NS on NET (L34-1and L33-1)
IRL No VT and NS onNET (General Licence) (NET5 (Basic Licence))
I Yes VT NET VTonNET (or VTonNET+NET) VT + NET
L No VT (type C) NET (type B) VT and NS on NET (type A)
NL No VT (registration) NET (registration) VT + NET (reg.)
A No8 VTonNET9 NET VTonNET VTonNET + NET
P No VT NET VT + NET
FIN Yes VT (registr.) NET (registr.)
S No VT (lic./reg.) NET (lic./reg.) VT + NET (lic./reg.)
UK Yes VT and NS on NET (PTO licence)
Legend:
VT (Voice Telephony): individual licence/registration for providing public fixed voice telephony (not including the installation of the network)
NET (Network): individual licence/registration/notification for operation of a public network and for the provision of network services (not including voice telephony services)
VTonNET (Voice Telephony on Network): individual licence/registration/notification for providing public voice telephony on a owned self-operated network (not including network services)
VTandNSonNET (Voice Telephony and Network Services on Network): individual licence/registration/ notification for provision of public voice telephony and network services on a owned self-operated network
VT + NET; VTonNET + NET; VTandNSonNET + NET: both licences needed for provision of the services
7 The Greek licensing regime provides for a list of 6 types of individual licence, among which those for public fixed networks and for public voice telephony. Moreover, at the request of the applicant, the NRA can issue a single licence which combines several categories of individual licence.
8 The legal framework for the licensing regime in Austria does not distinguish between local and national coverage of licences, although operators can apply for a licence restricted in scope as to the network and/or the services provided.
1.2.NUMBER OF FIXED TELECOMMUNICATIONS OPERATORS
This section shows the number of operators authorised to provide public fixed network services and public fixed voice telephony, as well as the number of operators effectively active in the market. The figures include a great variety of operators: fixed network operators, service providers, cable modem access operators and operators with wireless local loop, mobile and satellite operators (for the fixed part of their networks and services).
Depending on the national licensing scheme, for some countries data for both local and national operators are given (see table 1). This does not mean that in the other countries all operators are national, but only that the licensing scheme does not require a licence limited as to its scope (in consequence all the operators have to pay for a national licence even if they are only local operators).
In the following charts, “national operator” means an operator that has been granted either a national licence/authorisation or a non-geographically limited licence under a licensing scheme which does not specify the geographic coverage.
The figure reflect the number of operators, rather than the number of licences. This is particularly true for the cable TV operators that operate their telecommunication licence through local licences granted to their local franchisees; in this case they have been considered as one single operator. The number of local operators is not strictly comparable between Member States, since it varies considerably between countries depending on the division of the national territory into local areas. Figures for Denmark may be incomplete due to the fact that there is neither a licensing requirement nor a central register of operators and their activities (operators only apply for numbers).
In Spain, the big increase from last year in the number of operators (46 local and 61 national in 2001) reflects the fact that many cable TV operators have transformed their provisional cable modem access concession into a B1 licence for provision of telecommunication services (voice telephony and network services) over a own network.
In Finland, 38 of the 48 regional operators are local incumbents and belong to the Finnet Group. Data for Sweden include both licensed and notified operators.
PUBLIC VOICE TELEPHONY SERVICES Chart 1
Number of EU operators authorised to offer Total EU: 1231
34
25
39
49
62
24
72
45 46
15
65 65
28
139
116
227*
68
36
32
21
85
0 20 40 60 80 100 120 140 160 180
B DK D EL E F IRL I L NL A P FIN S UK
Local operators National operators
public voice telephony
public voice telephony pe * Figure not to scale
- Due to the registration system, the number of operators authorised to provide public voice telephony figures for Denmark has been estimated using the number of operators that have been allocated geographical numbers and/or access codes. The estimated overall number of operators has declined from 48 in 2001 to 36 in 2002 due to extensive merging and cornering in the Danish telecommunications market. Moreover, the total number of operators has diminished due to a couple of bankruptcies among smaller operators.
Chart 2
Number of operators authorised to offer r
million of inhabitants EU weighted average: 4
3,1
2,3 2,6
12,0
2,1
8,0
2,7
13,5
15,6
3,8
1,2
2,2
6,7
4,1
0 5 10 15 20
B DK D EL E F IRL I NL A P FIN S UK
The number of operators authorized to offer public fixed telecoms services indicates only the potential for competition in the market rather than the current level of competition. For this reason, where possible, an estimate is given of the number of operators actually active on the market. These figures do not show to what extent the operators are offering services. Many new entrants initially provide only services to business users in the main cities, even if they have a national license allowing them to offer all types of service throughout the country.
Figures in the following three charts should be read on a service by service bases (local, long-distance and international call markets) and not as country totals, since the same operator is usually authorized to offer more than one type of service.
Chart 3
Operators actually offering
52
19
7
43
11 8 10
20
9 9
15
33
4
0 10 20 30 40 50 60
D EL E F IRL L NL A FIN
Local operators National operators local calls
- Because of its small size, no distinction is made in Luxembourg between local and long-distance voice telephony services.
Chart 4
Operators actually offering
Total EU: local op.:124; national op.: 476
58
26
10
30
22 26
38
15 14
24
75
9
32
38
10
39
14
13
107
0 10 20 30 40 50 60 70 80 90 100 110
B DK D EL E F IRL I L NL A P FIN S UK
Local operators National operators
long-distance calls
international calls - Figure for Denmark should be considered as minimum.
- The figures for B, DK, I, P and S do not distinguish between the type of call provided (local, long-distance, international); the figure for the United Kingdom does not distinguish between local and national operators.
Chart 5
Operators actually offering
Total EU: local op.:125; national op.: 478
59
25
11
30
22 26
38
15 14
26
75
9
30
39
10
39
107
13 15
0 10 20 30 40 50 60 70 80 90 100 110
B DK D EL E F IRL I L NL A P FIN S UK
Local operators National operators
- Figure for Denmark should be considered as minimum.
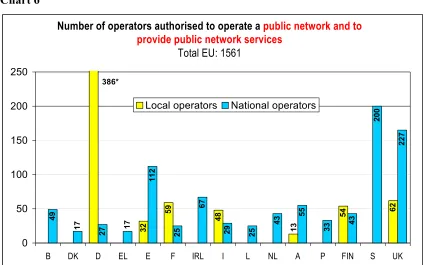
PUBLIC NETWORK
The following charts show the number of network operators with a public network licence and/or authorised to offer network services (conveyance of calls, messages and signals over a telecommunications network, including any necessary switching).
The distinction between local and national public network operators concerns the geographical scope of the network, while the provision of network services could be subject to a different geographical limitation. In the following, “local operators” means operators whose network does not cover the whole national territory (whatever the geographical scope of the service).
[image:15.595.85.509.365.630.2]It should be noted that a licence to operate a local/regional public network does not necessarily imply the existence of local network access to customers (“the last mile”. See local loop access section for more details).
Figure for Spain does not include 75 local cable modem access operators, that have transformed their provisional cable modem access concession into a definitive public network licence.
Data for Ireland include both basic and general licences.
In the United Kingdom, the local operators refer to 62 local cable franchise operators, owned by 2 companies.
Chart 6
Number of operators authorised to operate a
Total EU: 1561
32
59
48 54
62
112
25
67
25
43 55
33
200
13
386*
17
227
27
17
49 43
29
0 50 100 150 200 250
B DK D EL E F IRL I L NL A P FIN S UK
Local operators National operators
public network and to provide public network services
Chart 7
Number of operators authorised to operate a er million
of inhabitants EU weighted average: 4.2
4,8
3,6
17,5
8,4
3,2
18,7
22,5
3,8
1,4
1,6 1,3
5,0
3,2 2,7
0 5 10 15 20 25
B DK D EL E F IRL I NL A P FIN S UK
public network p
local network services
This indicator is not significant for Luxembourg, because of its peculiar characteristic in terms of percentage of population in relation to non-physical inhabitants.
Chart 8
Operators actually offering
15
9
5
20
12
5 7 5 5 7
10
5 4
66
25
181
43
2
3
0 10 20 30 40 50 60 70
B D EL E F IRL I L NL A P FIN S UK
Local operators National operators
- Value for Germany not to scale.
Chart 9
Operators actually offering
Total EU: 59 local op.; 226 national op.
17
10
7
22
14
11
6 7
11
21
7
14
12
3
26
25
1
24
16
31
0 5 10 15 20 25 30 35
B DK D EL E F IRL I L NL A P FIN S UK
Local operators National operators
trunk connections
international connections Chart 10
Operators actually offering
Total EU: 44 local op.; 193 national op.
3
24
11
5
18
14
9
5
8 8
17
13
4 3
9
25
1 1
24
35
0 5 10 15 20 25 30 35
B DK D EL E F IRL I L NL A P FIN S UK
1.3. INCUMBENTS MARKET SHARE ON FIXED TELEPHONY MARKET
This section shows the incumbent’s market share for telephony call market on the basis of retail revenues and outgoing traffic per minute. Unfortunately not all Member States collect both types of data, and differentiation between the various markets (local, long-distance, international) is not always available.
Figures have been provided by the national regulatory authorities and give the situation as for December 2001.
Chart 11
Estimates of incumbent operators' market share,
99,4% 98,0% 100,0%
88,3% 89,8% 92,0% 86,6%
83,0%
69%
65,7%
83,4%
68,0%
99,6%
82,0%
74,3%
65,0% 64,0%
76,0%
66% 69,0%
53,3%
68,0%
61,0%
97,5%
82,8%
67,6%
74,0% 74,9%
62,0%
50%
43,0% 45,5%
0% 25% 50% 75% 100%
B D EL E F IRL I NL A S UK
Local calls Long-distance calls Internat.calls retail revenues
- Local call market include both phone calls and calls to internet.
- In Belgium, market share for local calls includes local calls to internet only; market share for long-distance calls refers to "national phone calls", including both local phone calls and long-distance calls.
- Data for Sweden for local calls market share is not available separately. Market share for long-distance calls refers to the total national calls", including local phone calls, calls to internet and long-distance calls.
Chart 12
Estimates of incumbent operators' market share,
99,6%
96,0% 100,0%
77,2%
85,4% 88,0% 88,6% 83,0%
70%
92,5%
76,0%
84,7%
64,4% 63,0%
99,1%
84,2%
61,6% 59,0%
88,6%
76,0%
50%
89,9%
32,0%
48,3%
51,5% 52,7%
48,0%
96,9%
81,5%
63,2% 66,0%
72,0%
62,0%
40%
70,5%
54,0%
30,0%
0% 25% 50% 75% 100%
B DK D EL E F IRL L NL A P FIN UK
Local calls Long-distance calls International calls outgoing minutes
- Local call market include both phone calls and calls to internet.
- In Belgium, market share for local calls includes local calls to internet only; market share for long-distance calls refers to "national phone calls", including both local phone calls and long-distance calls.
- Market share for long-distance calls for Denmark and Portugal refer to the overall national calls", including local and long-distance phone calls, calls to internet and call to mobile.
- Because of its small size, no distinction is made in Luxembourg between the local and the long-distance call markets.
- Local calls market share for Finland refers to the combined share of the incumbents (Sonera, Elisa and Finnet). Market share for long-distance and international refers to Sonera only and do not include market share of Kakoverkko Ysi Oy and Finnet International Ab, that have been designated as SMP
Chart 13
Estimates of incumbent operators' market share for
99%
83%
72%
90%
87%
72%
58%
100%
66%
74%
80% 80%
87%
80%
93%
80%
0% 25% 50% 75% 100%
B E F IRL L NL A FIN UK
Retail revenues Outgoing minute local calls to the internet
calls to mobile networks Chart 14
Estimates of incumbent operators' market share for
78%
74%
99%
79% 78% 83%
76% 75%
50%
56% 60%
78%
65%
99%
80%
77%
82%
75%
50%
93%
64%
0% 25% 50% 75% 100%
B D EL E F IRL I NL A FIN S UK
1.4. SHARE OF PUBLIC OWNERSHIP IN INCUMBENT OPERATORS
In order to provide a complete overview of the players in the EU telecommunications market, the following chart shows the degree of public ownership of the incumbent operators on the fixed market. Spain, Italy, Portugal and the Netherlands have a golden share in the incumbent operators, that gives the State special rights on strategic decisions.
Chart 15
Share of public ownership in incumbent operators
43,1%
33,8%
54%
0,4%
100%
34,7%
47,2% 53,1%
70,6%
0 1 share 3,46% 0
50%+1 share
6,5%
0% 20% 40% 60% 80% 100%
Belgacom
TeleDenmark
Deutsche Telekom
OTE
Telefonica France Tel.
Eircom
Tel.
It
alia
P&T Luxemb.
KPN
Tel.
Aust
ria
Portugal Tel.
Sonera Telia
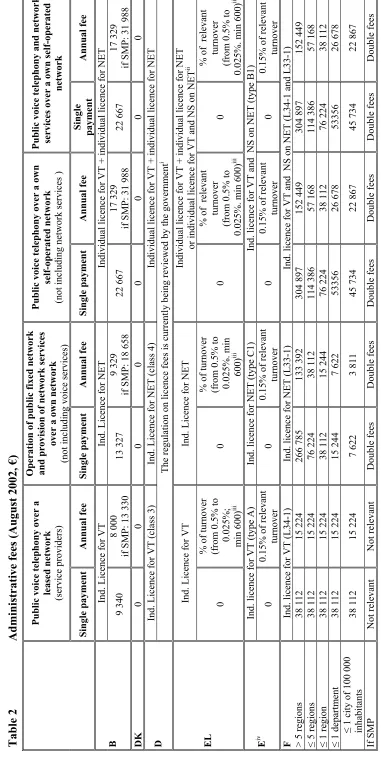
1.5. ADMINISTRATIVE AND NUMBERING FEES FOR THE PROVISION OF PUBLIC VOICE TELEPHONY AND PUBLIC NETWORK SERVICES
This section provides data on Member States’ administrative and numbering fees for public voice telephony and public network services licences. The data have been provided by the national regulatory authorities and give the position as at August 2002.
Administrative fees (table 2) are fees charged to cover the costs of examining an application for a licence, granting the relevant authorisation and verifying compliance with the terms and conditions set once the service or network is operational.
The categorisation of administrative fees is closely linked to the general licensing framework applicable in the individual countries. The categories of administrative fees will depend on whether market entry is subject to an individual licence or a notification under a general authorisation scheme (see table 1 for more details).
Numbering fees (table 3) are fees applied by many Member States which reflect the relative scarcity of numbering resources.
Table 3 sets out for each Member State the different kinds of fees charged for the following categories of numbers needed by each operator to provide public voice telephony services:
• standard telephone numbers (ITU-T Recommendation E.164) (for subscribers directly connected to the operator),
• carrier selection codes (to select the operator)
• signalling point codes10 (for interconnection with other networks at national (NSPC) and international (ISPC) level).
Ireland, Austria, Sweden, Portugal and the United Kingdom do not charge for such numbers, although often the right to use numbers is implicitly included in the licensing fees.
ES FOR FI
XED VOICE TELEPHONY
Administrative fees (August 2002, €)
Public vo ice telepho ny ov er a le ased netw or k (ser vi ce pr ovi de rs) Opera tio n of public fi xed n etw ork and pr ovi si on of netw ork s ervi ces over a ow n ne tw ork (n ot in cl udi ng voi ce ser vi ces) Public voice telephon y over a own self-oper ated network (n ot in cl udi ng net w or k se rv ices ) Public voice telephon y an d network services over a own self-ope rate d network Single p ayme n t Ann u al fee Single p ayme n t A n nu al f ee S ingl e pa yme n t Ann u al f ee
Single payment
Annual fee Ind. Licence for VT Ind. Licen ce f or N ET In divi dual lice nce fo r VT + indi
vidual licence for
NET 9 34 0 8 00 0 if SMP: 13 330 13 327 9 32 9 if SMP: 18 658 22 667 17 329 if SMP: 31 988 22 667 17 329 if SMP: 31 988 0 0 0 0 0 0 0 0 In d. Licence f or V T (class 3) In d. Licence f or N ET (cla ss 4) In di vi dual li ce nce fo r VT + indi vi du al li cen ce f or NET
The regulation on
licence fees is curre nt ly be ing re vi ewe d by th e g ov er nm ent i Ind. Licence for VT Ind. Licence for NET In di vi dual li ce nce fo r VT + indi vi du al li cen ce f or NET
or individual licence
fo r VT a nd N S on NE T ii 0 % of turn ov er (f rom 0. 5% to 0 .02 5%; m in 60 0) iii 0 % of turn ov er (f rom 0. 5% to 0 .02 5%. m in 600) iii 0 % o f rel eva nt tu rn ov er (f rom 0. 5% to 0 .02 5%. m in 60 0) iii 0 % o f rel eva nt tu rn ov er (f rom 0. 5% to 0 .02 5%. m in 60 0) iii Ind. licence for VT (type A) In d. licence fo r NET (ty pe C1 ) In d. li cence for VT and
NS on NET (type
B
1)
0
0.
15
% of rel
ev ant tu rn ov er 0 0. 15
% of rel
ev ant tu rn ov er 0 0. 15
% of rel
ev ant tu rn ov er 0 0. 15
% of rel
ev ant tu rn ov er In d. licence fo r VT (L 34 -1 ) In d. licence fo r NET (L 33 -1 ) In d. licence fo r VT an d N S o n NET (L 34 -1 and L 33 -1 ) 38 1 12 15 2 24 26 6 7 85 13 3 3 92 30 4 8 97 15 2 4 49 30 4 8 97 15 2 4 49 38 1 12 15 2 24 76 2 24 38 1 12 11 4 386 57 1 68 11 4 386 57 1 68 38 112 15 224 38 112 15 244 76 224 38 112 76 224 38 112 38 1 12 15 2 24 15 2 44 7 62 2 53 356 26 6 78 53 356 26 6 78 00 0 38 1 12 15 2 24 7 62 2 3 81 1 45 7 34 22 8 67 45 7 34 22 8 67 No t relev an t No t relev an t Doub le fees Doub le fees D oub le f ees D oub le f ees D oub le f ees D oub le f ees
Telecommunications Regulatory P
ack
age - VIII Imp
lementation Rep
ort – Anne
x I – C
orrigendum M
arc
h 2003 - 2
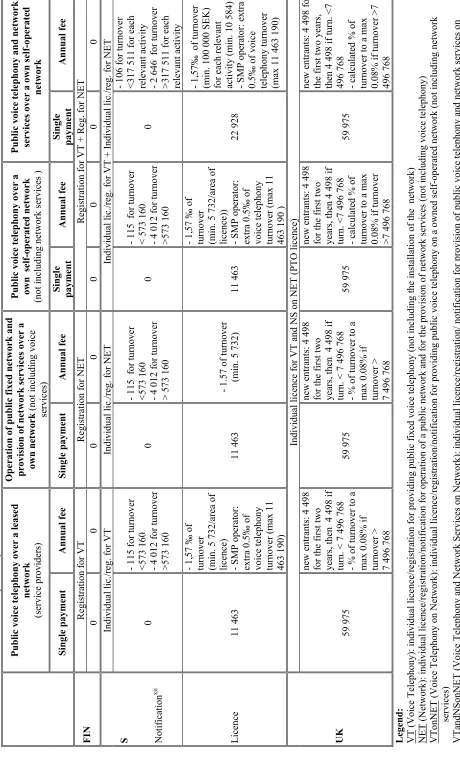
[image:23.595.75.456.38.796.2]Table 2
Administra
tive fees (co
n t’d) Public vo ice telepho ny ov er a lea sed network (ser vi ce pr ovi de rs) Opera tio n of public fi xed n etw ork and pr ovi si on of netw ork s ervi ces over a ow n ne tw ork (n ot in cl udi ng voi ce ser vi ces) Public vo ice telepho ny ov er a
own sel
f-oper ate d ne twork (n ot in cl udi ng net w or k se rv ices ) Public voice telephon y an d network services over a own self-ope rate d network Single p ayme n t Ann u al fee Single p ayme n t Ann u al fee
Single payment
A n nu al f ee S in gle pay m en t A n nu al f ee Indivi dual lice nce for VT a
nd NS on
NET (Gene ral licenc e) v IRL 12 500 1 01 5 o r 0. 2% of tu rn ov er> 635 00 0 12 500 (3 175 if b asic licence) vi 1 01 5 o r 0. 2% of tu rn ov er> 635 00 0 12 500 1 01 5 o r 0. 2% o f tur nover > 63 5 0 00 12 500 1 01 5 o r 0. 2% o f tur nover >6 35 00 0 Ind. licence for VT Ind. licence for NET Ind. licence for VT onNE T Ind. lic. f or VT
+ ind. lic.
fo r NET O r In d. lic. VTon N E
T + i
nd. lic. NET
I
vii Wh
ole c ou ntry 54 598 65 519 65 519 10 9 19 8 60 058 65 519 12 0 1 17 viii (1 25 57 7) ix 17 4 7 16 ≤ 10 m il lio n in h. 21 840 27 300 21 840 54 598 27 300 27 300 43 679 viii (4 9 13 9 ) ix 81 893 ≤ 2 00 00 0 inh . 10 919 10 919 10 919 27 300 16 379 10 919 21 840 viii (2 7 30 0) ix 38 219 Ind licence for VT (type C) Ind. licence for NET (t ype B) Ind. licence for VT and N
S on N
E T ( typ e A) L 62 0 37 1 84 pl us % of turn ov er (m in . 0. 15% max . 0.30 %) 6 19 7 12 3 94 pl us % of turn ov er (m in . 0. 10% max . 0.25 %) 7 43 6 49 5 78 pl us % of turn ov er (m in . 0. 20% max . 0.35 %) 7 43 6 49 5 78 pl us % of turn ov er (m in . 0. 20% max . 0.35 %) Registration f or V T Registration f or N ET Registration f or V T + Re g. f or N ET NL 36 3 1 98 5 if SM P: 1 93 3 20 5 36 3 4 59 0 36 3 4 59 0
if SMP: 2 17
3 7 75 36 3 4 59 0 if SM P: 2 17 3 77 5 Ind. Licence for VTonNET xi In d. Licence f or N ET In d. Licence for VTonNET
Ind. lic. VT
onNET +
ind. lic. NET
A x 0 0 5 08 7 0. 14 % of tu rn ov er 5 08 7 0. 14 % of tu rn ov er 10 1 74 0. 14 % of t ur no ver In di vi dual li ce nce fo r VT In d. Li cence f or N ET In di vi dual li ce nce fo r VT + indi vi du al li cen ce f or NET P 9 97 6 9 97 6 9 97 6 9 97 6 19 9 52 19 9 52 19 9 52 19 9 52
Telecommunications Regulatory P
ack
age - VIII Imp
lementation Rep
ort – Anne
x I – C
orrigendum M
arc
h 2003 - 2
t’d) Public vo ice telepho ny ov er a lea sed network (ser vi ce pr ovi de rs) Opera ti on of publ ic fi xed n etw ork an d prov isio
n of netwo
rk servic es over a own ne twork (n ot in cl udi ng voi ce services ) Public vo ice telepho ny ov er a
own sel
f-oper ate d ne twork (n ot in cl udi ng net w or k se rv ices ) Public voice telephon y an d network services over a own self-ope rate d network Single p ayme n t Ann u al fee Single p ayme n t Ann u al fee
Single payment
Annual fee
Single payment
Annual fee Registration f or V T Registration f or N ET Registration f or V T + Re g. f or N ET 0 0 0 0 0 0 0 0 In di vi dual li c./ reg . f or VT In di vi dual li c./ reg . f or NET In di vi dual li c./ reg . f or VT + Indi vi du al li c./ re g. fo r NET 0 - 11 5 fo r tu rn ov er <5 73 16 0
- 4 01
2 fo r tu rn ove r >5 73 16 0 0 - 1 15 fo r tu rnov er <5 73 16 0
- 4 01
2 fo r tu rn ove r > 57 3 160 0 - 1 15 fo r tu rnov er < 57 3 160
- 4 01
2 fo r tu rn ove r >5 73 16 0 0 - 10 6 fo r tu rn ov er <3 17 51 1 fo r each relev an t activ ity
- 2 64
6 fo r tu rn ov er >3 17 51 1 fo r each relev an t activ ity 11 463 - 1, 57 ‰ of tu rn ov er (m in . 5 73 2/ are a o f
licence) - SMP operator: extra 0.5‰
of vo ice telep hony turnover (m ax 11 46 3 1 90 ) 11 463 - 1. 57 o f t ur no ver (m in . 5 73 2) 11 463 - 1, 57 ‰ of tu rn ov er (m in . 5 73 2/ are a o f
licence)) - SMP operator: extra 0.5‰
of vo ice telep hony turnover (m ax 11 46 3 1 90 ) 22 928 - 1, 57 ‰ of tu rn ov er (m in . 10 0 0 00 SEK ) fo r eac h releva nt activ ity ( m in . 10 5 84)
- SMP operator: extra 0.5‰ o
f voi ce te le pho ny tu rn ove r (m ax 1 1 463 19 0) In divi dual lice nce fo r VT a nd NS o n NET (P TO licence ) 59 975 ne w en tr an ts: 4 49 8 fo r the fir st tw o year s, th en 4 49 8 if tu rn
. < 7 496
76
8
- %
of turnover to a
m ax 0. 08 % i f tu rn ov er > 7 49 6 7 68 59 975 ne w en tr an ts: 4 49 8 fo r the fir st tw o year s, th en 4 49 8 if tu rn
. < 7 496
76
8
- %
of turnover to a
m ax 0. 08 % i f tu rn ov er > 7 49 6 7 68 59 975 ne w en tr an ts: 4 49 8 fo r the fir st tw o year s, th en 4 49 8 if tu rn . <7 49 6 76 8
- calculated %
of tu rn ov er to a max 0. 08 % i f t ur no ver >7 49 6 7 68 59 975 ne w en tr an ts: 4 49 8 fo r th
e first two
years, th en 4 49 8 if tu rn . <7 49 6 7 68
- calculated %
of tu rn ov er to a max 0. 08 % i f t ur no ver >7 49 6 7 68 hon y): ind iv id ua l licen ce/reg istratio n fo r prov id in g pub lic fix ed vo ice telep hon y (no t inclu di ng th e i nstallatio n of th e net w or k) in di vi du al li cence/ re gi st rat ion/ not if icat io n fo r ope rat io n of a publ ic net w or k a nd f or t he p ro vi si on of n et w or k ser vi ce s ( not in cl ud in g voi ce t el eph on y) ce Tel eph on y on Net w or k): indi vi du al li cen ce/ regi st rat io n/ not if icat io n fo r p ro vi di ng p ub lic voi ce t el ep hony o n a ow ne d sel f-ope rat ed net w or k ( not in cl ud in g net w or k ( V oi ce Tel eph on y an d Ne tw or k Ser vi ces o n Net w or k): indi vi du al li cen ce/ regi st rat io n/ n ot if icat ion fo r pr ovi si on o f pu bl ic v oi ce te le ph ony a nd ne tw or k ser vi ces on f-operat ed net w or k NE T + NE T ; V T an dN So nN ET + NET : bot h licences
needed for pr
ovi si on o f t he ser vi ces y Package - VII I Im plementation
Report – An
nex I
– Corrige
ndum
[image:25.595.55.515.42.802.2]
i In i
ts ju dgem ent of 19 Se pt em ber 20 01 , t he Hi gh est A dm ini st rat iv e C our t (t he B undes verwal tu ng sge ri cht , B V er w G ) ann ul le d t he re
gulation on licence fees
on
the b
asis th
at it do
es not reflect the pri nciple that licence fees sh ou ld on ly cov er ad m in istrativ e co sts. T he regulation
on licence fees i
s curre ntly bei ng re vi ewe d b y t he go ve rnm ent . Pe ndi ng t he pre vi ous p roce edi ng s i n nat io nal cou rt s, o pe rat or s ha ve be en cha rge d l
icence fees an
d have been gra nt ed s uspe nsi on of t he pay m
ent at their request. Sin
ce the judgem
ent of the
BVerwG, licence fees are
no t ch arg ed an d licen
ces are issu
ed u nd er th e prov ision th at licen
ce fees will
be fix ed on th e b asis o f t he fo rt hcom ing re gu la tion.
ii The Gree
k l icensi ng re gi m e pr ov id es f or a lis
t of 6 t
ypes of i
ndi vi dual l icence, am ong whi ch t hose f or p ub lic fi xed net w or ks a nd for pu bl ic voi ce t el epho ny . M ore ove r, at t he requ est of th e ap plican t, th
e NRA can
issu
e a sing
le licen ce whic h c om bines seve ral categories of indivi dual licence.
iii Th
e
fees are determin
ed b ased on an in terv al fun ctio
n with resp
ect of th
e tu
rn
ov
er of the relev
an
t activities, with
a m in im um of 6 00 Eur o: 0. 5% of tu rn ov er f or t he fi rst 30 0 m ill io n eur o, 0. 2% f or t urn ov er bet w een 3 00 an d 6 00 m ill ion eu ro , 0 .1 5% fo r t ur nove r bet w ee n 6 00 a nd 9 00 m il lion eur o, 0.1 % f or t urn ove r bet w een 90 0 an d 1 2 00 M eur
o, 0
.0 5% for tu rn ov er be tw een 1 2 00 and 1 5 00 m ill io n euro, 0 .0 25 % fo r tu rn ov er ov er 1 5 00 m illio n eu ro .
iv Accordi
ng to t
he Ge
neral Tel
ecom
m
unications
Act, the e
xact am
ount of the annual fees
(pe
rcenta
ge va
lue) will be fixed eve
ry ye
ar by Parliam
ent,
taking int
o account the nee
d to cove r t he a dm ini st rat iv e c ost s o f t he li censi ng m anagem ent and co nt ro ls sy st em
. The a
nnu al fees ca nn ot be hi gh er th an 2‰ . F or 2 001 th e v al
ue set is 0
.15
%.
v In Ireland a
se parate licence for Public Netwo rk (b asic licen
ce) is also prov
id
ed
.
vi Hol
de
r o
f a g
eneral l icence are pe rm it te
d to o
perat
e a p
ub lic net w or k and pr ov id e v oi ce t el epho ny and net w or k ser vi ces. A basi
c licence is suffi
cient to ope
rat
e a public network
an d pro vi de n etw or k serv ices.
vii C
urre
nt
fees are obt
ai ned a dj ust in g o ri gi nal val ues pr ov ided by M ini st eri al Decree 05 .0 2. 19 98 o n t he basi
s of i
nfl at io n fo rese en in th e Doc ume nt o per l a pro gr am m az ione eco nomica e fin an zi ar ia on a
year by year ba
sis.
viii Co
rresp ond ing to th e co m bin atio
n of licen
ces fo r pr ov isi on of vo ice telep hon y and fo r pr ov ision o f pu blic ne two rk ser vices.
ix Co
rr esp ond ing to th e co m bin atio n of
licences for
p ro vi si on of vo ice telep hon y on a self -o pe ra ted n et w or k an d fo r pr ov ision o f pu blic n etwork serv ices.
x Fo
r al l t ypes o f ope rat or, a n a nn ual fee (de pendi ng o n t ur nove r an d m ark et share ) i s pay abl e t o con tribu
te to th
e ov erall co st s of th e regulator. T
he annual perce
nt age varies bet w een 0. 1% and 0 .2 % of turnov
er (in 19
99 it was 0. 12 %, i n 2000 it wa s 0. 1% ). Th e va lu e fo r t he year 2001 will b e co mm un icated in th e seco nd h alf of 2 002 .
xi An i
ndi vi du al l icence i s req ui re d f or t he p ro vi si on o f pu bl ic voi ce t el eph on y o ver a sel f-ope rat ed fi xed t el ecom m uni cat io n net w or k. T he net w or k c oul d ei th er bel on g t o t he ope rat ors, o r c oul d be t ot al ly leased f ro m th ird -pa rt y net w or k o perat or .
xii A licence is
re
qui
red i
f an operator’s activit
y is consi
dere d “s igni fi cant ” r egar di ng t he ar ea of di st ri but io n, th e nu m ber of use rs a nd sim ilar factors. Thes e
operators typically have a
market sha
re
of
10-15%
(never less t
han 5%
).
Telecommunications Regulatory P
ack
age - VIII Imp
lementation Rep
ort – Anne
x I – C
orrigendum M
arc
h 2003 - 2
Numbering fees
(€
)
S(r)/A(r)
= one-off/annual fee in case of
allocation of a number that had been reserved before)
B D K 11 D EL E FIN F I L NL per blo ck of
10 000 numbers S: 400 A: 134 per number (8-digit numbers) A:
0.2571
per blo
ck of
1 000 10-dig
it
numbers S: 500.00 per blo
ck of
1 000 11-dig
it
numbers S: 50.00 per number: S: 0.03 A: 0.025 res
ervat
ion
:
A:
0.0125
per number A: 0.03 per number A: 0.34 per number A:
0.02
reservation A: 0.01 per number A: 0.0109296 reservation A: 0.0054648
per number p
art
of a b
lock
of
10 000 numbers S:
0.12 A: 0.12 per number in amount < a block: S 61 97 + n*0 .2 4 A: 61 97 + *0 .2 4 per blo ck of 100 0
numbers. res
ervat ion S: 13.60 61 A: 1.60
allocation S: 13.60 A: 9.75
4 digits S:1 333 A: 13 327 4 digits A: 2 570.97
5 digits A: 257.10
4 digits
S:
500.00
4digit: S: 15 000 A: 15 000 5digit: S: 1 500 A: 1 500
per number A: 0.03 x
a facto
r
indicating the number of
9-digit numbers occu
pied in th e numbering plan In tern ation al A
: 3 dig
its 90 000 A: 4 digits 18 000 A:
5 digits 3 600
Long distanc e A: 3 digits 45 000 A: 4 digits 9 000 A:
5 digits 1 800
res ervat ion A: 4 digits 20 000 A: 1 digit 200 000 attr ibution A: 4 digits 40 000 A: 1
digit 400
000 res ervat ion A: 4 digits 54 598 A: 5 digits 27 300
26 976 allocation
A: 4 digits 109 198 A: 5 digits 54 598 S: 1 239 A: 1 239 res ervat ion S
450 A: 112.5 allocation S: 450 A: 225
S: 400 A: 13 327 A: 25 709.71 S: 375 A: 1680 S: 991 A: 495 res ervat ion S: 450 A: 112.5
allocation S: 450 A:
225 S: 400 A: 0 S: 187.50 A: 0.7 S: 991 A: 495 per blo ck of 8 numbers res ervat ion S: 450 A: 112.5
allocation S: 450 A:
225
bering fees
in DK a
re
due
to a c
hange i n t he e xcha nge ra
te to E
uro.
y Package
- VII
I Im
plementation
Report – An
nex I
– Corrige
ndum
2 CONSUMER’S CHOICE OF FIXED OPERATORS
This section analyses the fixed voice telephony market from the point of view of the consumers. The following indicators have been considered: the percentage of subscribers with choice of operators and the percentage of subscribers actually using a provider other than the incumbent. The facilities used by the operators to provide public voice telephony services have also been included. The data presented below has been provided by the national regulatory authorities and, unless otherwise indicated, reports the position at August 2002. Figures for countries not included in the charts are not available.
Figures are not comparable with those published in the 7th Implementation Report, since they are now based on the percentage of subscribers rather than population.
2.1.PERCENTAGE OF SUBSCRIBERS WITH CHOICE OF OPERATORS FOR FIXED CALLS
The following charts show the percentage of subscribers with choice of operators for local, long-distance and international calls and for direct access. The choice could be between only 2 operators, between 3 to 5 operators or more than five operators.
Chart 16
Percentage of subscribers with choice of operators for
0% 10% 20% 30% 40% 50% 60% 70% 80% 90% 100%
2 operators 8% 35%
3-5 operators 20% 100% 100% 7,5%
More than 5 op. 95% 5% 100% 100% 100% 0% 0% 100% 95% 100% 0% 100% 100%
DK D E F IRL I L NL A P FIN S UK
local calls
- Data for Belgium and Greece are not available. - Figure for Denmark should be considered as minimum. - Figure for France refer to end of March 2002.
Chart 17
Percentage of subscribers with choice of operators for
0% 10% 20% 30% 40% 50% 60% 70% 80% 90% 100%
2 operators (21) 100%
3-5 operators (22) 40% 2,2% 100%
More than 5 op. (23) 10% 95% 97,8% 100% 100% 100% 100% 0% 100% 95% 100% 100% 100% 100%
B DK D E F IRL I L NL A P FIN S UK
- long-distance and international calls
direct access
- Figure for Denmark should be considered as minimum. - Figure for Greece is not available.
- Figure for France refer to end of March 2002
Chart 18
Percentage of subscribers with choice of alternative operators for
0% 10% 20% 30% 40% 50% 60% 70% 80% 90% 100%
2 operators 40% 18% 1% 50% 18% 35%
3-5 operators 5% 15% 1% 0% 0% 7,5%
More than 5 op. 0% 95% 0% 100% 1% 0% 0% 0%
B DK D E F I L FIN
- Figure for Denmark, should be read as minimum.
2.2.PERCENTAGE OF SUBSCRIBERS ACTUALLY USING AN ALTERNATIVE PROVIDER OTHER THAN THE INCUMBENT
Unlike the previous indicators, that show the theoretic possibility of choice for the consumers, the following charts show the percentage of subscribers actually using an alternative provider for voice services.
Chart 19
Percentage of subscribers actually using an alternative provider for
25%
40%
6% 5%
29%
8,9%
17,5%
0,3%
2,1%
0% 10% 20% 30% 40%
DK D EL E F I L FIN UK
local calls
long- distance and international calls
- Figure for Spain and France refer to subscribers using pre-selection and/or direct access only, and they should be considered as minimum
- Figure for Denmark should be considered as minimum. Chart 20
Percentage of subscribers actually using an alternative provider for
12,3%
25%
21% 22,5%
50%
14% 19,4%
65%
27% 29%
2,4%
0% 10% 20% 30% 40% 50% 60% 70%
B DK EL E F I L P FIN S UK
- Figure for Denmark should be considered as minimum.
Chart 21
Percentage of subscribers actually using an alternative provider for
13%
0,02%
5,9%
0,08%
5%
0,01%
17,7%
2,1%
0,5%
0,4%
0% 5% 10% 15% 20%
DK D EL E F I L FIN S UK
direct access
- Figure for Sweden should be considered as maximum.
2.3.FACILITIES USED BY NEW ENTRANTS TO PROVIDE VOICE TELEPHONY
This section provides information on the facilities used by new operators to offer voice telephony, particularly to residential users.
The following charts show the estimated number of alternative operators using carrier selection, carrier pre-selection or direct access to provide voice telephony services to residential users.
These figures are estimates provided by the national regulatory authorities and refer to July 2002. The charts should be read separately and not summed up as country totals, since most operators use more than one means of providing call services.
As indicated in the section on numbering, at the reference date used for these charts, carrier selection and pre-selection was not yet available for local calls in Germany, but legislation has been introduced recently. Furthermore, carrier pre-selection is not yet available in Greece, due to the deferment granted until 1 January 2003. In the United Kingdom, carrier pre-selection for local calls is only available via “autodiallers’.
Because of its small size, no distinction is made in Luxembourg between local and long-distance calls.
Chart 22
Alternative operators using or providing
fixed voice telephony to residential users
20
6
29
45
25
4
4
29
4
99
0
20
1
60
32
14
22
8 15
29
0 10 20 30 40 50 60 70 80 90 100
B DK D EL E F IRL I L NL A FIN S UK
Local calls Long-dist./ Internat. Calls
carrier selection f
carrier pre-selection - Figure for Denmark should be considered as minimum.
- Data for France refer to May 2002. - Figure for Ireland refers to August 2001.
- The United Kingdom estimate refer to residential and business users.
Chart 23
Alternative operators using for providing
fixed voice telephony to residential users
20
0
9
11
25
50
20 19
16
32
8
0 4
19
32
20
50
25
16
3
19
4
29
11
35
19
0 10 20 30 40 50 60
B DK D E F IRL I L NL A FIN S UK
Local calls Long-dist./ Internat. Calls
- Figure for Denmark should be considered as minimum.
- In Germany, carrier pre-selection for local calls is not available yet. - In Greece, the carrier pre-selection for all types of calls is not available yet. - Data for France refer to May 2002.
Chart 24
Alternative operators using r providing fixed voice
telephony to residential users (total EU: 164)
17
53
27
9
30
3
17
0 1 2
1
2
1
1
0 10 20 30 40 50 60
B DK D EL E F IRL I L NL A FIN S UK
direct access fo
- Figure for Denmark should be considered as minimum. - Data for France refer to May 2002.
- Figure for Italy refers to the number of operators that signed a ULL contract with the incumbent, but not all of them are so far operational.
3 PUBLIC NETWORK INTERCONNECTION AND INTERCONNECTION CHARGES
3.1.FIXED-TO-FIXED INTERCONNECTION CHARGES
The following charts show the per-minute interconnection charges for call termination on the incumbent’s fixed network, based on the first three-minute call at peak rate.
The charts show the absolute value of the interconnection charges (in €-cents) as of 1 August 2002, in comparison to the value as at August 2001.
The figures may have been approved by the NRA or simply agreed between operators, where the legal framework does not require NRA approval.
Interconnection charges for Spain refers to a standard single transit, but a different charge is applied in Barcelona and Madrid (1,05 eurocents/minute)
In the case of France, in order to maintain consistency across Member States, the per minute charge indicated does not include the per minute charge related to the cost of the 2 Mbit/s port, which, however, according to ART, provides a better picture of the cost borne by the interconnecting party. By taking this additional charge into account, per minute charges would be €-cent 0.62, €-cent 1.26 and €-cent 1.76 respectively at local, single transit and double transit interconnection levels.
Charges for Netherlands apply from 1 Sept. 2002. Figures for Austria are valid until 30.06.2002.
In Finland there are about 50 SMP operators who apply different interconnection charges. The charts refer to charges applied by the two major operators Elisa (FIN) and Sonera (FIN2).
Charge for Germany for single transit level is not comparable to last year, since the Regio50 and Regio200 zone rates have been unified in a unique single transit charge.
Chart 25
Interconnection charges for call termination on fixed network
EU average: 0,77 €-cents
0,84
0,44
0,65 0,71
0,76
0,54
0,64 0,65
1,16
0,74
0,91
0,82
0,96
1,43
0,66
0,49
0,0 0,5 1,0 1,5
B DK D EL E F IRL I L NL A P FIN FIN(2) S UK
€-cents per minute
2001 2002 EU aver.
Local level -
Single transit -
- In Luxembourg there is no distinction between local and long-distance domestic calls.
Chart 26
Interconnection charges for call termination on fixed network
EU average: 1,09 €-cents
1,20
0,82
1,07
1,16 1,16
1,07
0,98 1,05
1,16
0,98
1,39
1,20 1,18
1,43
0,89
0,72
0,0 0,5 1,0 1,5
B DK D EL E F IRL I L NL A P FIN FIN(2) S UK
€-cents per minute
2001 2002 EU aver.
Chart 27
Interconnection charges for call termination on fixed network
EU average: 1,74 €-cents
1,42
1,22
1,86 1,91
2,22
1,41 1,33
1,65
1,50
1,28
2,25
1,76
2,64
3,04
1,01
1,37
0,0 0,5 1,0 1,5 2,0 2,5 3,0 3,5
B DK D EL E F IRL I L NL A P FIN FIN(2) S UK
€-cents per minute
2001 2002 EU aver.
Double transit -
- Data for the United Kingdom refers to a 100-200km connection length. For length less than 100 the interconnection charges at double level is 1,11184; and for more than 200km is 1,7832
3.2.LEASED LINE INTERCONNECTION CHARGES
This section shows the monthly rental and the one-off charges for short-distance leased lines (local ends, excluding VAT) up to 2 and 5 km provided by the incumbent operator to other interconnected operators. An estimate of the total average monthly rental cost (based on the total cost for the first year) is also presented.
Deviations for the monthly rental from the “recommended price ceiling” set in Commission Recommendation 1999/3863 of 24 November 1999 are also shown. The recommended price ceilings are:
• € 80/month for a 64 Kbit/s leased line part circuit up to 5 km • € 350/month for a 2 Mbit/s leased line part circuit up to 5 km; • € 1 800/month for a 34 Mbit/s leased line part circuit up to 2 km; • € 2 600/month for a 34 Mbit/s leased line part circuit up to 5 km.
These figures have been provided by the national regulatory authorities through the questionnaire for the 8th Implementation Report and the replies to the ONP COM02-18 Document. Figures
64 Kbit/s part circuit
Chart 28
Monthly rental for leased line IC of a art circuit
EU average 2 km: 85€ 5km: 108€
118
59
80
93
169
59
100
120 124
58
144
58
200
172
80
119
176
101 100
65
120
160
58
155
60
50
42
11
50
11
0 25 50 75 100 125 150 175 200 225
B DK D EL E F IRL I L NL A P FIN S UK
€-month
2km 5km Recommended price ceiling 5km 64 Kbit/s p
64 Kbit/s p - Figure for Greece refer to August 2001.
- Figure for Denmark in force since October 2002.
Chart 29
One-off charge for leased line IC of a art circuit
1.239
1.470
880
540 620
1.753
465
360
300
433
180
638 690
371
1.085
0 250 500 750 1.000 1.250 1.500 1.750 2.000
B DK D EL E F IRL I L NL A P FIN S UK
€
one-off charge
EU average one-off charge
Chart 30
Average monthly total cost for leased line IC of a rt circuit
222
182
153
138
221
205
139 150 149
94
26
197
116
303
295
153 164
228
247
139
96
150
185
94
26
208
117
73
140 140
0 50 100 150 200 250 300 350
B DK D EL E F IRL I L NL A P FIN S UK
€-month
Average monthly total cost 2 km Average monthly total cost 5 km
64 Kbit/s pa
2Mbit/s p - Monthly rental for Greece refers to August 2001.
- Figure for Denmark in force since October 2002.
2 Mbit/s part circuit
Chart 31
Monthly rental for leased line IC of a art circuit
EU average 2 km: 295€ 5km: 389€
291
169
360
576
488
175
350 330
320 311
158
222
310
525
371 350
700
550
685
350
430
330 350 311
158
291
349
286
82 82 0
100 200 300 400 500 600 700 800
B DK D EL E F IRL I L NL A P FIN S UK
€-month
2km 5 km Recommended price ceiling 5km
Chart 32
One-off charge for leased line IC of a art circuit
2.479
1.650
2.348
639
1.229
3.504
568 500
1.500
748
1.200
38
558
1.487
847
0 500 1.000 1.500 2.000 2.500 3.000 3.500
B DK D EL E F IRL I L NL A P FIN S UK
€
one-off charge
EU average one-off charge 2Mbit/s p
2Mbit/s par Chart 33
Average monthly total cost for leased line IC of a t circuit
497
306
556
629
590
467
397
372
445
373
258
225
356
732
509 546
754
652
977
397
554
372
475
373
258 294
395
152
410
152
0 250 500 750 1.000
B DK D EL E F IRL I L NL A P FIN S UK
€-month
2 km 5 km
34 Mbit/s part circuit
Chart 34
Monthly rental for leased line IC of a art circuit
EU average 2 km: 1 617€ 5km: 2 310€
900 950
1.800
2.435
2.671
1.421
1.800
2.200
1.650
2.332
606
1.538
1.917
2.350 2.357 2.325
2.600
3.275
2.671
4.337
2.600
1.536
2.200
1.875
2.332
606
1.731
2.326
1.360
881
0 500 1.000 1.500 2.000 2.500 3.000 3.500 4.000 4.500
B DK D EL E F IRL I L NL A P FIN S UK
€-month
2km 5km
Recommended price ceiling 2km Recommended price ceiling 5km
34 Mbit/s p
34 Mbit/s p - Figure for Denmark in force since October 2002.
- Figure for Greece refers to 2001 Chart 35
One-off charge for leased line IC of a art circuit
2.479
5.000
8.804
2.705
2.226
6.471
2.775
4.292
2.614
998
1.500
480
1.085
23.152*
3.000
0 2.500 5.000 7.500 10.000 12.500 15.000 17.500
B DK D EL E F IRL I L NL A P FIN S UK
€
one-off charge EU average one-off charge
* Value not to scale
Chart 36
Average monthly total cost for leased line IC of a art circuit
1.107
1.367
2.534 2.660
2.857
1.960 1.890
2.240
1.775
2.415
837
1.895
2.135
2.557 2.742
3.334 3.500
2.857
2.690
1.786
2.240
2.000
2.415
837
2.089
2.543
1.610
2.810
4.876
4.286
0 500 1.000 1.500 2.000 2.500 3.000 3.500 4.000 4.500 5.000
B DK D EL E F IRL I L NL A P FIN S UK
€-month
2 km 5 km 34 Mbit/s p
- Figure for Denmark in force since October 2002.
Chart 37
Average EU deviation from price ceiling for leased lines interconnection
82%
50%
23% 24%
35%
11%
-10% -11%
-20% 0% 20% 40% 60% 80% 100%
2001 2002
64 Kb 5 Km 2 Mb 5 Km 34 Mb 2 Km 34 Mb 5 Km
3.3.FIXED-TO-MOBILE INTERCONNECTION CHARGES