Working Paper Research
by Giorgia Barboni
June 2017
No 322
Editor
Jan Smets, Governor of the National Bank of Belgium
Statement of purpose:
The purpose of these working papers is to promote the circulation of research results (Research Series) and analytical studies (Documents Series) made within the National Bank of Belgium or presented by external economists in seminars, conferences and conventions organised by the Bank. The aim is therefore to provide a platform for discussion. The opinions expressed are strictly those of the authors and do not necessarily reflect the views of the National Bank of Belgium.
Orders
For orders and information on subscriptions and reductions: National Bank of Belgium, Documentation - Publications service, boulevard de Berlaimont 14, 1000 Brussels Tel +32 2 221 20 33 - Fax +32 2 21 30 42
The Working Papers are available on the website of the Bank: http://www.nbb.be
© National Bank of Belgium, Brussels All rights reserved.
Abstract
This paper finds that foreign banks can act as a buffer against negative credit supply shocks, in contexts where the domestic credit market is heavily hit by a country-specific adverse shock. A new dataset is constructed, which combines Belgian Credit Register data with firms and banks’ balance sheets. After 2008, Belgian firms borrowing from domestic banks experienced a stronger credit contraction (minus 1.8 percentage points) than firms borrowing from foreign banks. Also, foreign banks “cherry-picked” new relationships with more profitable firms to a higher extent during the crisis, and turned down existing relationships more frequently than domestic banks. Results from this paper suggest that foreign banks can mitigate negative financial shocks in countries where domestic financial intermediaries unexpectedly experienced the consequences of the financial crisis to a higher extent.
JEL Classifications: G21, G32, F34
Keywords: Foreign banks, Financial Crisis, Credit Supply
Authors:
Giorgia Barboni, Trinity College Dublin – e-mail: giorgia.barboni@gmail.com.
This work was carried out while the author was an intern at the National Bank of Belgium.
Acknowledgements
The author would like to thank for the hospitality and the support provided. The author is especially grateful to Adrien Matray. She also would like to thank, without implicating, Martin Brown, Alessio D’Ignazio, Olivier De Jonghe, Catherine Fuss, Emilia Garcia-Appendini, Paolo Martellini, Klaas Mulier, Tobias Nigbur, Steven Ongena, Alberto F. Pozzolo, Paul Reding, Enrico Sette, Tania Treibich, Christophe Van Nieuwenhuyze, Raf Wouters, and seminar participants at the National Bank of Belgium, University of St. Gallen, Bank of Italy and the Macro Working Group at the Trinity College Dublin for encouragement and detailed discussion. She also would like to thank Neeltje van Horen for sharing data on the foreign ownership of Belgian banks.
TABLE OF CONTENTS
1. Introduction ... 1
2. Context ... 4
3. Literature review ... 6
4. Banking environment and data sources ... 8
4.1. Banking environment ... 8
4.2. Data sources and descriptive statistics ... 10
5. Identification strategy ... 12
6. Results ... 12
6.1. Did foreign banks adopt a predatory behaviour? ... 14
6.1.1. Extensive margin of credit ... 14
6.1.2. Large versus small domestic banks ... 16
7. Conclusions ... 17
References ... 19
Appendix ... 22
Tables... 23
1. Introduction
Foreign banks have been identified as a major source of diffusion of crises (see Giannetti and Laeven, 2012 for a review), through at least two different mechanisms. First, they can transmit shocks from their home country to their cross-border affiliates (e.g. Peek and Rosengreen, 2000). Second, they tend to be intrinsically more risky because they rely more on the wholesale funding market (De Haas and Van Lelyveld, 2013).
During the 2008-2009 financial crisis, in particular, foreign banks contributed to exacerbate the consequences of the financial turmoil in host countries. As a result, firms borrowing from branches or subsidiaries of foreign banks experienced a sharp credit tightening (e.g. Cetorelli and Goldberg, 2011; Ongena et al., 2013, Popov and Udell, 2012). Despite the extensive evidence of foreign banks acting as shock-propagators, theory suggests that they can also offer a buffer against negative credit supply shocks in the host country (Levine, 1996). Yet, very limited evidence exists for this positive role. Belgium, however, offers an interesting exception.
At the beginning of October 2008, the Belgian domestic credit market saw its key players heavily damaged by the financial turmoil spreading after Lehman Brothers’ default. The crisis hit particularly hard Belgian domestic banks because of the failure of corporate governance arrangements (Van der Elst, 2010). The high liquidity risks faced by Belgian banks were not only caused by newly originated financial debt, but also by distorted incentive packages to banks’ executives, along with weak strategies and oversights in risk management systems.
The Belgian case raises important questions on how credit markets react when the main banks in the domestic scene are hit by a country-specific shock. How do foreign banks behave when domestic credit markets face a country-specific shock? Do they still act as shock propagators or, instead, help mitigate the consequences of the crisis in the country? Moreover, what lending strategies do they adopt in the wake of the financial crisis?
The main result of the paper is that in Belgium foreign banks lent more, and more selectively, than their domestic counterparts. This because they were more insulated from the specific shock affecting the hosting market. Indeed, the loan growth by foreign banks in Belgium after 2008 has increased by 1.8 percentage points more than the loan growth by domestic banks. 1 This result is robust for both
authorised and drawn credit, and after studying branches and subsidiaries of foreign banks separately.
The data used in this paper allow one to test two main competing hypotheses regarding the role of foreign banks during the financial crisis when hosting countries are affected by a country-specific shock. First, higher growth rates of the loans disbursed by foreign banks might simply reflect a substitution effect in the credit lines held by Belgian firms. Since domestic banks reduced their lending, firms then resorted to other sources of credit, among which foreign credit. Second, foreign banks may have played a more active role in financing Belgian firms during the crisis, by taking advantage of the temporary breakdown of Belgian banks to increase their market share in Belgium and targeting specific firm segments in their lending strategies.
It is also shown that foreign banks actively exploited the collapse of Belgian banks using three main tests. First, the extensive margin of lending is explored, which shows that, during the crisis, foreign banks were more likely to terminate an existing relationship, but also to start new ones. This effect is more pronounced for foreign banks that relied on wholesale funding to a higher extent. A possible explanation is that foreign banks acted more aggressively in a country with weak domestic financial sector, as a means to compensate for potential losses they encountered elsewhere.
Second, using firms’ balance sheet variables, foreign banks are found to be more likely to start new relationships with more profitable (higher growth rate of sales) firms during the financial crisis.
Third, a test is run with firms that from 2005 to 2010 only borrowed from domestic banks. This allows to explore differences in lending rates between large domestic and small domestic banks. Compared to large domestic banks, small ones have less “functionally-distant” organizational structure, which exposed them to a lower extent to the country-specific shock (Van der Elst, 2010). Results show that during the crisis, small domestic banks have lent even less than large domestic
1 In conducting the analysis, only resident banks are considered. Domestic banks are classified as those originating in Belgium;
banks. This finding suggests that the effect detected not only is caused by the squeezing in lending from (large) domestic banks, but also by the predatory behaviour of foreign banks. If this was not the case, then small domestic banks lending should also be observed to a higher extent during the financial crisis.
Taken together, the results of this paper suggest that foreign banks, during the crisis, have adopted a “cherry-picking” strategy. They interrupted existing lending relationships more frequently but, at the same time, they were also more likely than domestic banks to start new relationships, especially with healthier firms. One potential explanation for this finding is that foreign banks rely more than domestic banks on hard information (e.g. Mian, 2006, Detragiache et al., 2008), which becomes far more important during periods of high-risk aversion. As a consequence, hard information borrowers, which are characterised by better performance indicators than soft information borrowers (who mostly rely on their reputation), have been captured by foreign banks to a higher extent. At the same time, international banks, which may have been hit by the crisis to a larger extent in other foreign markets because of their higher reliance on wholesale funding, adopted a more aggressive lending strategy in countries where domestic banks created a “vacuum” in the credit supply.
This paper contributes to the literature on the role of foreign banks during the financial crisis, along at least three dimensions. First, although multinational banks may have cut credit growth in many countries (e.g. Cetorelli and Goldberg, 2011; 2012), there are still cases in which they increased their lending, possibly to counteract their overall bad performance. Second, using firm-bank data, the paper shows that foreign banks after the crisis not only continued lending, but also they did so in a more selective fashion. This would contribute to explain businesses’ performance during financial crisis, by suggesting what type of funding they would resort to when their main lenders go bankrupted. On a more general level, this paper suggests that foreign banks act as shock absorbers when they operate in host markets that are affected by country-specific shocks. Similar results have been indeed found for the Tequila crisis in Argentina and Mexico in early 1990s (Goldberg et al., 2000), or in Italy during the 2011 sovereign debt crisis (Bofondi et al., 2013).
main identification strategy is illustrated, which explores differences in lending between foreign and domestic financial intermediaries during the financial crisis. Results are commented in section 6. Section 7 concludes.
2. Context
In September 2008, the main Belgian domestic credit institutions (Dexia, Fortis, and then KBC) unexpectedly experienced a strong reduction in profitability and liquidity. The financial crisis revealed the problems accumulated by corporate governance deficiencies, by further reducing domestic banks’ returns and increasing liquidity risks (National Bank of Belgium, 2009). Not surprisingly, the measures adopted by the Belgian government to rescue these banks included specific recommendations to banks’ boards, in terms of professional trustworthiness and remuneration packages.
A few weeks after Lehman Brothers’ default, Fortis was acquired by the French bank BNP Paribas. Soon after Fortis, the financial crisis swamped another key Belgian domestic bank, KBC, and Ethias, one of Belgium’s main insurance companies. Dexia, on the contrary, although managed to survive thanks to a liquidity injection from the Belgian Government, was ultimately dismantled in 2011.
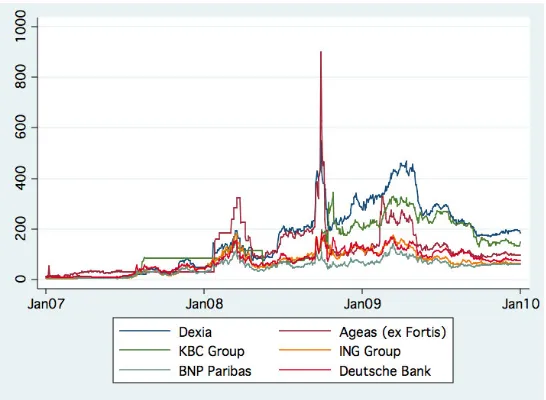
Figure 1: Total return index of the main Belgian banks and of foreign banks from neighbouring countries. Source: Datastream, Thomson Reuters.
Similarly, data on CDS spreads (Figure 2) show that, after the outburst of the financial crisis, the CDS spread of Dexia and Fortis registered a huge hike. On September 26, 2008, ten days after Lehman Brothers filed for bankruptcy, the value of the CDS spread for Fortis and Dexia were, respectively, 28.5 and 9.4 times higher than the value registered in January of the same year (compared to an increase of 2.8 for Deutsche Bank, 3.8 for BNP Paribas and 1.3 for ING).
Figure 2: CDS spreads of the main Belgian banks and of foreign banks from neighbouring countries. Source: Datastream, Thomson Reuters.
[image:9.595.162.435.495.695.2]Belgian domestic banks also heavily affected their financial strength in terms of regulatory capital requirements. It is thus reasonable to think that the lack of capital translated into a restriction in the credit supply, especially for domestic financial intermediaries.
Belgium offers a relevant setting to observe differences in the performance between domestic and foreign banks, for at least two reasons. First, domestic banks suffered more than foreign banks the consequences of the country-specific shock (as shown in Figure 1 and 2). Second, the Belgian credit market is characterised by a remarkable presence of foreign banks. Compared to the average presence of foreign banks in European countries, the share of foreign financial intermediaries active in this country is slightly higher (47% in 2009 as reported by Claessens and Van Horen, 2013, vis-à-vis 39% in Europe). It is also worth noticing that one fourth of the financial intermediaries operating in Belgium are branches of banks that originate either in France, Germany and the Netherlands (Table 1). This implies that a large fraction of banks in Belgium are owned by banks that were not affected by the country-specific shock under study.
3. Literature Review
This research primarily relates to the stream of literature that studies the behaviour of foreign banks in host countries, particularly after the outburst of financial crises. The central research question of this literature asks whether international banks act as shock propagators or shock absorbers in domestic markets, especially during financial downturns.
The same type of data are also used by Kalemli-Ozcan et al. (2013) to study the correlation of business cycles: their results reveal that cross-border banking is associated with less synchronized output cycles. By analysing the role of foreign subsidiaries and branches in emerging European countries through survey data on SMEs, Popov and Udell (2012) find that firms borrowing from foreign banks experienced a higher credit contraction than those borrowing from domestic banks. Similarly, De Haas and Van Lelyveld (2014), who employ a large database of multinational banks containing information on their subsidiaries, find that banks that depended more on wholesale market funding were more likely to cut credit than their domestic counterparts. This is because domestic banks rely on more stable funding sources than foreign banks. Finally, De Haas and Van Horen (2013) study how banks reduced cross-border credit after the collapse of Lehman Brother. Interestingly, they find that international banks showed a higher propensity, during the financial crisis, to continue lending in countries where they already had a lending history or had previously established connections with domestic banks.
Yet, foreign banks can also act as buffer against negative shocks. It was the case, for instance, of foreign-owned banks operating in Mexico and Argentina after the Tequila crisis. As Goldberg et al. (2000) document, foreign banks displayed higher rates of credit growth than domestic banks after 1994 in these countries. Their results show that when the domestic credit market is damaged by a country-specific shock, healthy foreign banks act as a source of growth and stability for local businesses. Interestingly, a similar dynamic was in place in Italy during the recent sovereign debt crisis. Spreading in 2011, this crisis hit specifically Italian banks. In analysing the consequences of this country-specific shock, Bofondi et al. (2013) find that domestic banks have tightened credit to a higher extent than foreign banks.
transmission in the United States through Japanese cross-border banking, and find a substantial decline in lending by Japanese banks operating in the US market. Similarly, Puri et al. (2011), study the consequences of the US financial crisis in the German banking sector using a very detailed dataset of loan applications and loans granted in German savings banks. The authors find a substantial contraction in the supply of retail lending in Germany following the US crisis. Along the same line, Schnabl (2012) studies the 1998 Russian default and finds that after the shock international banks reduce bank-to-bank lending to Peruvian banks, which in turn contract lending to Peruvian firms.
Taken together, these studies suggest that foreign banks act as shock-propagators during banking crises. However, this is the case when the financial shock is transmitted across international credit markets, and affects both home and hosting countries. During these types of financial crises, foreign banks are heavily undermined because of their higher reliance on international wholesale funding. As a consequence, they contract their lending supply to a higher extent than domestic banks. Conversely, foreign banks appear to have an important, positive role when domestic credit markets are hit by a country-specific shock. In those cases, they are capable to absorb the shocks and to promote business growth. Results from country-specific financial crises both in emerging and developed countries indeed confirm the prediction that foreign banks are able to reduce the negative externalities resulting from weak domestic banks.
4. Banking Environment and Data Sources 4.1 Banking Environment
Belgium represents the ideal setting to study differences in the credit supply between domestic and foreign banks, for at least two reasons. First, as much as 47% of the banks operating in the country are foreign (slightly higher than the average of 39 per cent for European countries). Second, a remarkable share of foreign banks operating in Belgium originates from neighbouring countries.2 It
follows that Belgian firms borrow a large share of credit from foreign banks. Indeed, more than 20% of credit borrowed at firm level comes from a bank lending relationship with foreign banks (Table 4
2 Almost 30% of financial intermediaries operating in Belgium are branches of banks whose home country is adjacent to Belgium.
in the Appendix).
To classify banks as being foreign or domestic, the definition generally used in the literature is adopted, which classifies as foreign either banks whose country of origin is other than Belgium or Belgian banks with 50 percent or more of their shares owned by foreigners. Information on banks’ country of origin is initially taken from the Belgian Credit Register and then matched with foreign ownership data from Bankscope and from Claessens and Van Horen (2014)’s dataset.3 The initial
sample consists of 96 banks operating in Belgium.
Table 1 shows the distribution of banks across their country of origin. More than half of these banks originate in Belgium, while France, Germany, Great Britain and the Netherlands are the foreign countries the most represented. Among the 53 Belgian banks, a further distinction is made between domestic banks and subsidiaries of foreign banks, by relying on ownership information from Claessens and Van Horen (2014). The final sample consists of 43 domestic banks (originating in Belgium and owned by a majority of Belgian investors) and 53 foreign banks, of which 43 are branches of foreign banks (originating outside Belgium) and 10 are subsidiaries of foreign banks (originating in Belgium but owned for at least 50 per cent by foreign investors). This classification is reported in Table 2, which also summarizes the shares of total credit lent by each category of banks to Belgian firms. Interestingly, 13.15 per cent of the total credit comes from subsidiaries of foreign banks, while only 8.67 per cent from branches of foreign banks. This suggests the important role of these financial intermediaries in the Belgian credit market. Another important aspect to be acknowledged is that Fortis is classified as domestic for the entire panel. This decision moves from at least three reasons. First, the change in the ownership of Fortis took place only in 2009; second, including Fortis in our dataset as a foreign-owned bank, even only after 2009, would be conceptually wrong and may ultimately bias the estimates of this paper.4 Indeed, this bank was affected by the
financial crisis to the same extent, if not even more, as the other domestic banks. Last, it must be noticed that all the other foreign-owned banks included in the sample result from the large wave of mergers and acquisitions which took place in Belgium between 1997 and 2003, in very different contexts and for very different reasons than the acquisition of Fortis from BNP Paribas in 2009.
3 To see potential implications of the adopted definition of “foreign banks”, a detailed discussion is present in Claessens and Van
Horen (2014), from p.7.
4 For robustness, the following regressions have also been performed: i) without Fortis ii) with the switch of Fortis from domestic to
4.2 Data Sources and Descriptive Statistics
This paper relies on a rich dataset that results from the merging of five different data sources: (1) The Belgian Credit Register, where all authorized and used volumes of credit granted by banks operating in Belgium to Belgian firms are reported. Bank-firm relations are reported in the Credit Register only once the exposure of the bank is greater than €25,000. Data on loans are used, from 2005 to 2010; (2) Firm Balance Sheets: these data come from firms’ annual balance sheet filings, during the period 2005-2010; (3) Bank Balance Sheets: these data come from banks’ annual balance sheet filings, as per the Supervisory Report Scheme, during the period 2005-2010; (4) Bureau van Dijk Bankscope, that records world-wide bank balance sheet data; (5) The dataset created by Claessens and Van Horen (2014), to derive banks’ ownership.
By linking these five datasets, a panel is constructed where the unit of observation is the lending relationship between firm i and bank j in year t, where t = 2005, 2006,..,2010. Knowing whether bank j is foreign or domestic, it is then possible to study the evolution of the firm-bank relationship across time and relate it to the ownership of the financing bank. Moreover, thanks to balance sheet data of both firms and banks, it is possible to control for both firms’ and banks’ characteristics. The final dataset, which comprises multiple borrowing firms only, consists of 80 banks and 22,358 firms.
Table 4 and Table 5 present descriptive statistics for the entire universe of firms and for multiple-borrowing firms, respectively. Compared to the full sample, firms in the used sample are older, larger, more profitable and more likely to borrow from foreign banks. The median annual loan growth rate of credit is -0.073, compared to -0.086 for the full sample.
Table 6 shows descriptive statistics of banks’ balance sheet variables. Mean difference tests are used to compare these values both between foreign and domestic banks and before and after the crisis. Panel A of Table 6 shows that domestic and foreign banks included in the sample do not significantly differ in many financial and regulatory aspects, and these similarities remain stable after the crisis. Results from Panel A also reveal that domestic banks are on average larger than foreign banks, both before and during the crisis. During the crisis, domestic banks have higher overall liquidity than foreign banks.5 This latter result could be driven by the fact that, as part of the
restructuring plan undertaken to face domestic banks’ financial crisis, the Belgian Government and
5 Liquidity is defined as cash plus net position in the interbank market plus short-term securities portfolio plus government bonds
the National Bank of Belgium agreed on a massive capital injection to help domestic banks overcome the financial turmoil.6 Panel B of Table 6 displays t-tests within banks’ segments, again
before and during the crisis. Compared to the pre-crisis period, during the financial crisis foreign financial intermediaries have increased their average financial strength: the tier 1 ratio has become significantly higher after 2008, while both the reliance on wholesale funding and interbank ratio increased (although not significantly). Conversely, none of these differences are significant for domestic banks: in particular, while the reliance on wholesale funding increase by 11% for foreign banks, a drop of about 8.5% of the same variable is observed for domestic banks, suggesting that the financial crisis heavily hit the latter.
Finally, differences before and during the crisis of foreign and domestic loan growth are studied. To this end, a fundamental assumption that needs to be verified to correctly estimate differences in lending between domestic and foreign banks is that, in absence of this shock, the growth rate of credit lent by domestic and foreign financial intermediaries would have followed the same trend. A first validation of this assumption is obtained by looking at Figure 3, which compares the mean and median rates of loan growth at firm-bank level between domestic and foreign banks, averaged by year, respectively. While before the crisis those rates had similar trends, starting from 2008 we observe foreign credit growing to a much higher extent than domestic credit.7
Moreover, Figure 4 shows the mean loan growth rates at bank level, again averaged by year. In particular, banks are classified based on the average quality of their portfolio of firms (measured in terms of sales growth). Figure 5 on the left shows the growth rate of total credit for banks whose average quality of financed firms is below the median, while Figure 5 on the right plots the growth rate of total credit for banks whose borrowers have a high operational revenues growth. The figure clearly shows that, before the crisis, these rates followed similar patterns, but they differ significantly during the crisis: foreign banks’ loan growth is higher than domestic banks’ loan growth for better performing firms, while the opposite holds for poorly performing businesses.
6 National Bank of Belgium (2009), Financial Stability Review.
7 As also stressed by Bofondi et al. (2013), it must be noticed that bank fixed effects are also included in the regressions. This suggests
5. Identification Strategy
In order to identify differences in lending conditions during the financial crisis between foreign and domestic banks, it is estimated the amount of credit firm i receives from bank j in period τ, where τ
is equal to either the pre-crisis or the crisis period (years between 2005 and 2007, and years between 2008 and 2010, respectively). This is shown in Equation (1):
∆log(credit)!"# =�!+�!�������!+�! �������!∗������! +�!"+�!"! (1) where the dependent variable, ∆log(credit)!"#, is the difference in the log of credit lent by bank j to firm i in period τ . The dummy �������! equals 1 if bank j is classified as foreign, and zero if the
bank is domestic. The main variable of interest, the interaction term �������!∗������! is computed as the interaction between the dummy �������! and the dummy ������!, the latter being equal to 1 in year 2008, 2009 or 2010, and zero in year 2005, 2006, 2007.8
Using Khwaja and Mian (2008)’s approach, firm-period fixed effects, �!", are also included in the main equation. The use of firm-time fixed effects allows one to test whether the same firm i borrowing from both domestic and foreign banks experienced a higher or lower growth rate of credit from the bank segment that was more heavily affected by the financial crisis.
6. Results
Results from equation (1) are reported in Table 7. Standard errors are double clustered at the bank and at the firm level. The dependent variable in columns (1) to (3) is the ∆ log of drawn credit, while the same analysis is replicated in columns (4) to (6) with authorised credit. Column (1) and (4) report estimates for the baseline model without fixed effects, while firm and time fixed effects, and firm*time fixed effects are added in Column (2) and (5), and Column (3) and (6), respectively, along with bank fixed effects. Column (1) of Table 7 shows that, before the crisis, credit drawn from foreign banks grew by one percentage point less than domestic banks, as the coefficient of foreign bank reveals. However, looking at the crisis effect, the coefficient of foreign bank*crisis shows that
8 In order to correct for inconsistency of standard errors (Bertrand et al., 2004), averages by period are taken (before and after the
foreign banks expanded credit supply by 1.8 percentage points more than domestic banks.
The same regression with both bank and firm-period fixed effects is then estimated; the use of fixed effects absorbs both the foreign bank and the crisis dummies, which therefore do not appear in Table 7, as shown in Column (2) and (3) for drawn credit and (5) and (6) for authorised credit. The coefficient of foreign bank*crisis remains positive and significant. In particular, its magnitude increases, especially in the estimates of authorised credit.
Two robustness checks are performed. The first uses the entire sample of firms (214,897) that contains both multiple-borrowing firms and firms engaged in single bank lending relationships. Table 8 reports results for both the regressions on drawn and authorised credit. The coefficient of foreign bank*crisis is positive and significant. In terms of magnitude, the coefficient of the growth rate of drawn credit for the entire sample appears even higher than for multiple-borrowing firms (5 percentage points, compared to 1.8).
Second, foreign banks are disaggregated into branches and subsidiaries. This allows for a subsample analysis where bank branches and subsidiaries are considered separately. These estimates are reported in Table 9. Columns (2) and (4) display results for subsidiaries of foreign banks. The dependent variable is the growth rate of drawn credit (column 2) and authorised credit (column 4). Similarly, columns (3) and (6) show results for branches of foreign banks. Columns (1) and (3), instead, report findings for subsidiaries and branches considered together. The coefficients of the interaction term foreign bank*crisis remain positive and significant for both subsidiaries and branches, when we look at drawn credit (the first three columns of table 9). In terms of magnitude, the effect appears larger for branches than for subsidiaries. Similar results hold for authorised credit (column (4), (5) and (6)). In this case, however, the higher credit growth detected from foreign banks seems only driven by subsidiaries of foreign banks.
lending, firms then resorted to other sources of credit, among which foreign credit. At the other end, foreign banks may have played a more active role in financing Belgian firms during the crisis. Indeed, they might have exploited the temporary breakdown of Belgian banks to increase their market share in Belgium and targeting specific firm segments in their lending strategies.
In what follows, two tests are conducted to assess which of the above-mentioned hypotheses is predominant. The extensive margin of credit is first computed. Results from the extensive margin are used to study whether foreign banks did change their lending behaviour during the financial crisis. Secondly, a subsample analysis is conducted with domestic banks only. This allows one to observe whether compared to larger domestic banks, smaller domestic banks display differences in lending. If no differences at the extensive margin of credit were detected, the hypothesis of a more “active” lending behaviour from foreign banks would be discarded. Similarly, if a higher growth rate of credit from smaller vis-à-vis larger domestic banks is identified, it would imply that it is not foreign banks to act as shock-absorbers during the financial crisis, but any bank segment other than larger domestic banks, which were the most hit from the country-specific shock.
6.1 Did foreign banks adopt a predatory behaviour? 6.1.1 Extensive Margin of Credit
To study whether foreign banks took advantage of the negative credit supply shock, the paper analyses foreign banks’ propensity to terminate credit relationships and to start new ones, as compared to domestic banks. If the prevailing hypothesis is that foreign banks acted more aggressively during the crisis than domestic banks, foreign banks are expected to end existing relationships more frequently than domestic banks. At the same time, foreign banks should also be more likely to start new links. If, on the contrary, what is observed is purely the effect of a shrinking in the domestic credit supply, then no change should be detected on foreign banks’ lending strategies.
variable, p(terminate), is a dummy that takes the value of 1 if a firm-bank relationship that existed at time t − 1 is then terminated at t.9 The main variable of interest is, again, foreign bank*crisis: its
coefficient is both positive and significant, also after adding firm*time FEs. Results from columns (1) and (2) of Table 10 thus reveal that, compared to domestic banks, after 2008 foreign banks were more likely to cut credit relationships already in place. Columns (3) and (4) of Table 10 show the results for the second equation, where the probability of starting a new bank-firm relationship is estimated. The dependent variable, p(newrel), is a dummy that takes the value of 1 if a credit relationship that didn’t exist at time t − 1, is created at time t, averaging the probability for both the pre-crisis and the crisis period. The coefficient of foreign bank*crisis is positive and significant, implying that foreign banks in the financial crisis were also more likely to start a new credit relationship, compared to domestic banks. Moreover, the likelihood of foreign banks to start new relationships is larger than the likelihood of terminating existing ones. Taken together, these results suggest that during the crisis, foreign banks have changed their behaviour as compared to the pre-crisis period. In particular, they were more resolute in cutting relationships already in place, but also more likely to create new relationships. This evidence suggests that foreign banks adopted a “cherry-picking” behaviour during the crisis, as they became more selective towards their pool of financed firms.
A further step is made in the analysis of the extensive margin of credit, to try to identify if foreign banks were more likely to terminate “bad” relationships and, at the same time, to start new “good” links. A subsample analysis is then run, based on borrowers’ quality. Looking at firms’ sales growth, firms with low and high sales growth are analysed separately. Results are shown in table 11: while no differential impact of firms’ quality is detected on the probability to terminate existing relationships, the magnitude of the coefficient of foreign bank*crisis in column (4) is larger than in column (3), suggesting that foreign banks during the crisis have opened new relationships to a higher extent with better performing firms.
Another set of regressions is then used to study which type of foreign banks, in terms of reliance on the wholesale funding market, were more likely to lend at the extensive margin. Results are displayed in Table 12. Column (1) and (2) show the extensive margin of credit for banks whose level of wholesale funding is below the median; conversely, Columns (3) and (4) report results for banks
9 Like in the initial model, this outcome is averaged for both the pre-crisis and the crisis period, in order to obtain consistent standard
with a level of wholesale funding above the median. The coefficient of foreign bank*crisis appears significant only when banks with high levels of wholesale are considered: only foreign banks relying on the wholesale funding market to a higher extent have been more likely to terminate existing relationships and to start new ones.
Taken together, results from Table 10, 11 and 12 confirm the hypothesis of foreign banks playing an active role in funding Belgian businesses during the financial crisis. After 2008, banks originating from outside the Belgian borders have strengthened their position in a country where the domestic credit supply was temporarily weakened. This holds in particular for foreign banks relying to a higher extent to wholesale funding. A possible explanation is that multinational banks acted more aggressively in a country with weak domestic financial sector, as a means to compensate for potential losses they encountered elsewhere because of their higher reliance on wholesale funding.
6.1.2 Large versus small domestic banks
In order to corroborate the hypothesis that foreign banks engaged in a more aggressive lending behaviour in Belgium after the outbreak of the financial crisis in 2008, it is also necessary to prove that the effect detected is precisely driven by a predatory behaviour of foreign banks, and not only by a squeezing in domestic lending from (large) domestic banks. Compared to large domestic banks, small domestic banks (lower assets) have less “functionally-distant” organizational structures, which exposed them less to the country-specific shock (Van der Elst, 2010). Therefore, if the results of this paper only depend upon the distress experienced by big domestic banks, also small domestic banks should be expected to lend to a higher extent during the financial crisis. Conversely, if no significant difference in lending within domestic banks were detected, this would confirm that the results of the paper are driven by foreign banks’ expansive credit supply.
To test this idea, large and small domestic banks are classified based on their size. A dummy “small domestic” for small domestic banks is then selected.10 A sample of 9,714 firms that were only
financed by domestic banks is then obtained. These firms, before the crisis, had established at least
10 The three largest domestic banks are classified as “large”; therefore the dummy “small domestic” takes the value of one if the
bank’s size is lower than the identified threshold.
one link with both a large domestic and a small domestic bank. The following regression is then estimated, which allows studying whether firms borrowing from small domestic banks have experienced a higher credit growth during the crisis:
∆log(credit)!"#=�!+�!����� ��������!+�! ����� ��������!∗������! +�!"+�!"# (2)
The main coefficient of interest is ����� ��������!∗������!, that is the interaction term between the small domestic banks dummy and the crisis period. Results from equation (2) are displayed in Table 13. During the crisis, the loan growth rate for firms borrowing from smaller domestic banks was lower than for firms borrowing from larger domestic banks, although the coefficient of
����� ��������!∗������! is only statistically significant for drawn credit. Results from Table 13
confirm the hypothesis that foreign banks adopted a predatory behaviour in Belgium after the outbreak of the financial crisis in 2008, for two reasons. First, no increase in lending from small domestic banks during the crisis is detected (on the contrary, the sign of ����� ��������!∗������!
is always negative and similar in magnitude between drawn and authorised credit). Second, and most importantly, the only bank segment that increased its lending during the financial crisis was foreign banks.
7. Conclusions
and subsidiaries’ credit provision separately. Taken together, the findings of this paper show that foreign banks in Belgium, which were not affected by the country-specific shock hitting Belgian credit market, lent more than domestic banks during the crisis years. The used data allow one to test two main competing hypotheses regarding the role of foreign banks during the financial crisis when hosting countries are affected by a country-specific shock. First, higher growth rates of the loans disbursed by foreign banks might simply reflect a substitution effect in the credit lines held by Belgian firms. Since domestic banks reduced their lending, firms then resorted to other sources of credit, among which foreign credit. Second, foreign banks may have played a more active role in financing Belgian firms during the crisis, by exploiting the temporary breakdown of Belgian banks to increase their market share in Belgium and targeting specific firm segments in their lending strategies.
To study which hypothesis is dominant, banks’ propensity to either terminate or establish new relationships during the financial crisis is first analysed. Second, only firms that before the crisis borrowed from Belgian domestic banks are selected. This allows one to observe whether significantly different lending strategies could be detected not only between domestic and foreign banks, but also within domestic banks. Results from this test show that there were no differences in credit supply within domestic banks. Thus, the hypothesis of an expansive lending strategies adopted by foreign banks operating in Belgium is confirmed.
All in all, this paper shows that foreign banks acted as a buffer against the negative shock hitting the Belgian credit market. These results thus validate previous studies that document that international banks can play a positive role in the wake of country-specific financial crises (Goldberg et al., 2000; Bofondi et al., 2013).
References
Albertazzi, U., and M. Bottero (2012), “The Procyclicality of Foreign Bank Lending: Evidence from the Global Financial Crisis”, Bank of Italy, Economic Working Papers, N. 926.
Bertrand, M., Duflo, E., and S. Mullainathan (2004), “How much should we trust differences-in-differences estimates?. Quarterly Journal of Economics, 119(1), 249-275.
Bofondi, M., Carpinelli L., and E. Sette (2013), “Credit Supply During a Sovereign Debt Crisis”, Bank of Italy Temi di Discussione (Working Paper), No. 909.
Bonaccorsi di Patti, E., and E. Sette (2012), “Bank balance sheets and the transmis- sion of financial shocks to borrowers: evidence from the 2007-2008 crisis”, Bank of Italy Temi di Discussione (Working Paper), No. 848
Cetorelli, N., and L.S. Goldberg (2011), “Global banks and international shock transmission: Evidence from the crisis”, IMF Economic Review, 59(1), 41-76.
Cetorelli, N., and L.S. Goldberg (2012). Banking globalization and monetary transmission. The Journal of Finance, 67(5), 1811-1843.
Claessens, S., and N. van Horen (2014), “Foreign Banks: Trends, Impact and Fi- nancial Stability”, Journal of Money, Credit and Banking, 46(1), 295-326.
De Haas, R., and I. Van Lelyveld (2011), “Multinational banks and the global financial crisis: weathering the perfect storm?”, Journal of Money, Credit and Banking, 46(1), 333-364.
Financial Crisis”, Review of Financial Studies, 26(1), 244-285
Degryse, H., Masschelein, N., and J. Mitchell (2011), “Staying, dropping, or switch- ing: the impacts of bank mergers on small firms”, Review of Financial Studies, 24(4), 1102-1140.
Detragiache, E., Tressel, T., and P. Gupta (2008). “Foreign banks in poor countries: theory and evidence.” The Journal of Finance, 63(5), 2123-2160.
Giannetti, M., and L. Laeven (2012). The flight home effect: Evidence from the syndicated loan market during financial crises. Journal of Financial Economics, 104(1), 23-43.
Giannetti, M., and S. Ongena (2009). “Financial integration and firm performance: Evidence from foreign bank entry in emerging markets” Review of Finance, 13(2), 181-223.
Goldberg, L., Dages, B. G., and Kinney, D. (2000). Foreign and domestic bank participation in emerging markets: lessons from Mexico and Argentina (No. w7714). National bureau of economic research.
Gormley, T. A., and D.A. Matsa, (2014). “Common errors: How to (and not to) control for unobserved heterogeneity”. Review of Financial Studies, 27(2), 617- 661.
Kalemli-Ozcan, S., Papaioannou, E., and J.L. Peydro (2013). “Financial regulation, financial globalization, and the synchronization of economic activity”. Journal of Finance, 68(3), 1179-1228.
Khwaja, A.I. and, A. Mian (2008), “Tracing the Impact of Bank Liquidity Shocks: Evidence from an Emergin Market”. American Economic Review, 98(4), 1413- 1442.
Levine, R. (1996). Foreign banks, financial development, and economic growth. International financial markets: Harmonization versus competition, 7, 224-254.
Mian, A. (2006). Distance constraints: The limits of foreign lending in poor economies. The Journal of Finance, 61(3), 1465-1505.
National Bank of Belgium (2009), Financial Stability Overview
Peek, J., and E.S. Rosengren (1997), “The international transmission of financial shocks: The case of Japan”, American Economic Review, 87(4), 495-505.
Peek, J., and E.S. Rosengren (2000). Collateral damage: Effects of the Japanese bank crisis on real activity in the United States. American Economic Review, 30-45.
Popov, A., and G.F. Udell (2012), “Cross-border banking, credit access and the financial crisis”, Journal of International Economics, 87, pp. 147-161.
Puri, M., Rocholl, J., and S. Steffen (2011), “Global retail lending in the aftermath of the US financial crisis: Distinguishing between supply and demand effects”. Journal of Financial Economics, 100(3), 556-578.
Schnabl, P. (2012), “The international transmission of bank liquidity shocks: Evi- dence from an emerging market”, The Journal of Finance, 67(3), 897-932.
Appendix
Figure 3: Mean and median loan growth rate at bank level (drawn credit). Source: NBB, Credit Register
[image:26.595.156.441.494.698.2]Table 1: Home Country of Banks included in the sample
Country n. banks freq.
Belgium 53 55.21%
France 10 10.42%
Germany 6 6.25%
Great Britain 6 6.25%
India 3 3.13%
Japan 2 2.08%
Luxembourg 3 3.13%
Netherlands 8 8.33%
Pakistan 1 1.04%
Spain 2 2.08%
United States 2 2.08%
[image:27.595.88.511.420.519.2]total 96 100%
Table 2: Foreign and domestic banks included in the sample
Bank type n. banks freq. share credit over total credit
domestic banks 43 44.79% 78.18%
subsidiaries of foreign banks 10 10.42% 13.15% branches of foreign banks 43 44.79% 8.67%
total 96 100% 100%
Table 3: Balance sheet variables of banks, definition
Variable Definition Source
T1 ratio core equity capital over total risk-weighted assets (RWA),
expressed as a % of RWA BankScope Wholesale Non-customers liabilities as a share of total bank
liabilities BankScope Interbank Interbank Lending to Interbank Borrowing BankScope Size Bank Total book value of assets,
expressed in log - assets expressed in thousands of euros Schema A Liquidity (Cash+net position in the interbank market+short term
[image:27.595.75.519.553.726.2]Table 4: Descriptive statistics of firms, full sample
Variable Definition mean median sd
loan growth annual growth rate of drawn credit,
firm-bank levl -0.045 -0.086 0.438 size firm Total book value of assets,
expressed in log - assets expressed in thousands of euros
13.484 13.266 1.486
sales growth Annual growth rate of sales 0.024 0.030 0.483 age Age of the firms in years 19.36 17 11.79 leverage Book value of debt over assets 0.727 0.740 0.283 p(foreign) =1 if bank j is foreign 0.231 0 0.422 share foreign share of credit borrowed from foreign
banks over total credit
0.204 0 0.376
onebanklink =1 if firm has one bank lending
relationship 0.666 1 0.471
Number of firms 214,897
Table 5: Descriptive statistics of firms, multiple-borrowing firms
Variable Definition mean median sd
loan growth annual growth rate of drawn credit,
firm-bank levl -0.036 -0.073 0.767 size firm Total book value of assets,
expressed in log - assets expressed in thousands of euros
14.698 14.429 1.697
sales growth Annual growth rate of sales 0.027 0.036 0.418 age Age of the firms in years 25.38 23 14.18 leverage Book value of debt over ssets 0.719 0.739 0.228 p(foreign) =1 if bank j is foreign 0.423 0 0.494 share foreign share of credit borrowed from foreign
[image:28.595.63.528.415.609.2]Table 6: Mean difference tests between banks in the sample
Panel A
crisis = 0 Domestic Banks sd Foreign Banks sd t-test
tier 11.55 3.49 9.25 1.83 not significant
wholesale 63.32 34.36 57.43 35.54 not significant
interbank 153.85 220.45 101.79 55.42 not significant
log(assets) 14.40 1.83 13.35 2.19 ***
liquidity 0.055 0.099 0.034 0.076 not significant
deposits 0.90 0.119 0.86 0.183 not significant
bad loans 0.034 0.135 0.018 0.029 not significant
crisis = 1 Domestic Banks sd Foreign Banks sd t-test
tier 12.57 2.39 13.87 4.37 not significant
wholesale 57.91 45.88 63.53 43.56 not significant
interbank 154.22 229.84 133.93 137.40 not significant
log(assets) 14.78 1.98 13.52 2.20 ***
liquidity 0.051 0.084 0.010 0.032 ***
deposits 0.85 0.153 0.84 0.140 not significant
bad loans 0.021 0.040 0.025 0.041 not significant
Panel B
Foreign = 0 Pre-Crisis sd Crisis sd t-test
tier 11.55 3.49 12.57 2.39 not significant
wholesale 63.32 34.36 57.91 45.88 not significant
interbank 153.85 220.45 154.22 229.84 not significant
log(assets) 14.40 1.83 14.78 1.98 not significant
liquidity 0.055 0.099 0.051 0.084 not significant
deposits 0.90 0.119 0.85 0.153 **
bad loans 0.034 0.135 0.021 0.040 not significant
Foreign = 1 Pre-Crisis sd Crisis sd t-test
tier 9.25 1.83 13.87 4.37 **
wholesale 57.43 33.55 63.53 43.56 not significant
interbank 101.79 55.42 133.93 137.40 not significant
log(assets) 13.35 2.19 13.52 2.20 not significant
liquidity 0.034 0.076 0.010 0.032 *
deposits 0.86 0.183 0.84 0.140 not significant
bad loans 0.018 0.029 0.025 0.041 not significant
Ta bl e 7: Ba se lin e m od el – mu lti pl e bo rr ow in g fir ms Th is t ab le r ep or ts O L S es tim at es o f th e de te rm in an ts o f c re di t g ro w th u si ng a s d ep en de nt v ar ia bl e b ot h us ed cr edi t (C ol um ns ( 1) , (2) a nd ( 3) ) an d au th or is ed c re di t (C ol um ns (4 ), (5 ) an d (6 )). T he v ar ia bl es a re o bta in ed b y co mp ut in g th e lo g di ff er en ce of d ra w n an d au th or is ed cr ed it, r es pect iv el y. Th e sa m pl e co ns is ts o f fir m s th at , b ef or e th e cr is is , w er e bo rr ow in g fr om a t le as t a do m es tic a nd a f or ei gn b an k. T he 1s t an d 99 th p er ce nt ile f or b ot h au th or is ed c re di t an d fir m ’s le ve rage h av e al so b ee n re m ove
d. draw
[image:30.595.167.500.144.708.2]NATIONAL BANK OF BELGIUM - WORKING PAPERS SERIES
The Working Papers are available on the website of the Bank: http://www.nbb.be.
276. “How do exporters react to changes in cost competitiveness?, by S. Decramer, C. Fuss and J. Konings, Research series, January 2015.
277. “Optimal monetary policy response to endogenous oil price fluctuations”, by A. Stevens, Research series, January 2015.
278. “Comparing fiscal multipliers across models and countries in Europe”, by J. Kilponen, M. Pisani, S. Schmidt, V. Corbo, T. Hledik, J. Hollmayr, S. Hurtado, P. Júlio, D. Kulikov, M. Lemoine, M. Lozej, H. Lundvall, J. R. Maria, B. Micallef, D. Papageorgiou, J. Rysanek, D. Sideris, C. Thomas and G. de Walque, Research series, March 2015.
279. “Assessing European competitiveness: The new CompNet micro-based database”, by P. Lopez-Garcia, F. di Mauro and the CompNet Task Force, Research series, April 2015.
280. “FloGARCH: Realizing long memory and asymmetries in returns volatility”, by H. Vander Elst, Research series, April 2015.
281. “Does education raise productivity and wages equally?The moderating roles of age, gender and industry”,
by F. Rycx, Y. Saks and I. Tojerow, Research series, April 2015.
282. “Assessing European firms’ exports and productivity distributions: The CompNet trade module”, by
A. Berthou, E. Dhyne, M. Bugamelli, A.-M. Cazacu, C.-V. Demian, P. Harasztosi, T. Lalinsky, J. Merikül, F. Oropallo and A. C. Soares, Research series, May 2015.
283. “Economic importance of the Belgian ports: Flemish maritime ports, Liège port complex and the port of Brussels - Report 2013”, by F. Van Nieuwenhove, Document series, June 2015.
284. “Crisis-proof services: Why trade in services did not suffer during the 2008-2009 collapse”, by A. Ariu, Research series, July 2015.
285. “The labour market position of second-generation immigrants in Belgium”, by V. Corluy, J. Haemels, I. Marx and G. Verbist, Research series, September 2015.
286. “The implications of household size and children for life-cycle saving”, by B. Capéau and B. De Rock, Research series, September 2015.
287. “Monetary policy effects on bank risk taking”, by A. Abbate and D. Thaler, Research series, September 2015.
288. “The Belgian production network 2002-2012”, by E. Dhyne, G. Magerman and S. Rubínová, Research series, October 2015.
289. “Portfolio choice and investor preferences: A semi-parametric approach based on risk horizon”, by G. Hübner and T. Lejeune, Research series, October 2015.
290. “Predicting Belgium’s GDP using targeted bridge models”, by Ch. Piette, Research series, January 2016. 291. “Did export promotion help firms weather the crisis?”, by J. Van Biesebroeck, J. Konings and C. Volpe
Martincus, Research series, January 2016.
292. “On the role of public policies and wage formation for business investment in R&D: A long-run panel analysis”, by T. Buyse, F. Heylen and R. Schoonackers, Research series, January 2016.
293. “Unraveling firms: Demand, productivity and markups heterogeneity”, by E. Forlani, R. Martin, G. Mion and M. Muûls, Research series, February 2016.
294. “Unemployment risk and over-indebtedness: A micro-econometric perspective”, by Ph. Du Caju, F. Rycx and I. Tojerow, Researchseries, February 2016.
295. “International shocks and domestic prices: How large are strategic complementarities?”, by A. Amiti, O. Itskhoki and J. Konings, Research series, March 2016.
296. “The supplier network of exporters: Connecting the dots”, by E. Dhyne and S. Rubínová, Research series, May 2016.
297. “Does one size fit all at all times? The role of country specificities and state dependencies in predicting banking crises” by S. Ferrari and M. Pirovano, Research series, May 2016.
298. “Competition and product mix adjustment of multi-product exporters: Evidence from Belgium”, by K. Breemersch, Research series, June 2016.
299. “Flemish maritime ports, Liège port complex and the port of Brussels – Report 2014”, by G. Van Gastel, Document series, June 2016.
300. “Misalignment of productivity and wages across regions? Evidence from Belgian matched panel data”, by F. Rycx, Y. Saks and I. Tojerow, Research series, July 2016.
303. “Bank capital (requirements) and credit supply: Evidence from pillar 2 decisions”, by O. De Jonghe, H. Dewachter and S. Ongena, Researchseries, October 2016.
304. “Monetary and macroprudential policy games in a monetary union”, by R. Dennis and P. Ilbas, Research series, October 2016.
305. “Forward guidance, quantitative easing, or both?, by F. De Graeve and K. Theodoridis, Research series, October 2016.
306. “The impact of sectoral macroprudential capital requirements on mortgage loan pricing: Evidence from the Belgian risk weight add-on”, by S. Ferrari, M. Pirovano and P. Rovira Kaltwasser, Research series, October 2016.
307. “Assessing the role of interbank network structure in business and financial cycle analysis”, by J-Y Gnabo and N.K. Scholtes, Research series, October 2016.
308. “The trade-off between monetary policy and bank stability”, by M. Lamers, F. Mergaerts, E. Meuleman and R. Vander Vennet, Research series, October 2016.
309. “The response of euro area sovereign spreads to the ECB unconventional monetary policies”, by H. Dewachter, L. Iania and J-C. Wijnandts, Research series, October 2016.
310. “The interdependence of monetary and macroprudential policy under the zero lower bound”, by V. Lewis and S. Villa, Research series, October 2016.
311. “The impact of exporting on SME capital structure and debt maturity choices”, by E. Maes, N. Dewaelheynes, C. Fuss and C. Van Hulle, Research series, October 2016.
312. “Heterogeneous firms and the micro origins of aggregate fluctuations”, by G. Magerman, K. De Bruyne, E. Dhyne and J. Van Hove, Research series, October 2016.
313. “A dynamic factor model for forecasting house prices in Belgium”, by M. Emiris, Research series, November 2016.
314. “La Belgique et l’Europe dans la tourmente monétaire des années 1970 – Entretiens avec Jacques van Ypersele”, by I. Maes and S. Péters, Research series, December 2016.
315. “Creating associations to substitute banks’ direct credit. Evidence from Belgium”, by M. Bedayo, Research series, December 2016.
316. “The impact of export promotion on export market entry”, by A. Schminke and J. Van Biesebroeck, Research series, December 2016.
317. “An estimated two-country EA-US model with limited exchange rate pass-through”, by G. de Walque, Ph. Jeanfils, T. Lejeune, Y. Rychalovska and R. Wouters, Research series, March 2017.
318. Using bank loans as collateral in Europe: The role of liquidity and funding purposes”, by F. Koulischer and P. Van Roy, Research series, April 2017.
319. “The impact of service and goods offshoring on employment: Firm-level evidence”, by C. Ornaghi, I. Van Beveren and S. Vanormelingen, Research series, May 2017.
320. “On the estimation of panel fiscal reaction functions: Heterogeneity or fiscal fatigue?”, by G. Everaert and S. Jansen, Research series, June 2017.
321. “Economic importance of the Belgian ports: Flemish maritime ports, Liège port complex and the port of Brussels - Report 2015”, by C. Mathys, Document series, June 2017.
© Illustrations : National Bank of Belgium
Layout : Analysis and Research Group
Editor Jan Smets
Governor of the National Bank of Belgium National Bank of Belgium
Limited liability company
RLP Brussels – Company’s number : 0203.201.340