J O U R N A L O F M A T E R I A L S S C I E N C E3 9(2 0 0 4 ) 181 – 191
A Raman microprobe study of electrical treeing
in polyethylene
A. S. VAUGHAN∗, S. J. DODD
Department of Electronics and Computer Science, University of Southampton, Highfield, Southampton SO17 1BJ, UK
E-mail: [email protected]
S. J. SUTTON
The National Grid Company plc, Network Engineering, Kelvin Avenue, Leatherhead, KT22 7ST, UK
The chemical nature of electrical tree growth in a blend of high and low density
polyethylene has been studied by confocal Raman microprobe spectroscopy. The observed spectra, which are easily perturbed by the Raman probe beam, can be described in terms of three components, the relative intensities of which vary from place-to-place on the sample. Throughout the body of the tree, the usual Raman bands of polyethylene are seen, but superimposed upon a pronounced fluorescent background. This suggests a degree of material degradation throughout the structure, even where there is no visible evidence of electrical discharge damage or ageing. The individual channels that make up the fractal structure of the tree can then be divided into two distinct categories. Within the core of the tree, their Raman spectra are made up of two elements; fluorescence, plus theGandD bands of sp2hybridized carbon. Here, the tree channels are best thought of as hollow tubules surrounded by a carbonaceous shell. At the tips, the channels are characterized simply by the Raman bands of polyethylene superimposed upon a reduced fluorescent background, irrespective of their size. That is, in this region, the tree channels are simply hollow tubules within the dielectric. The transition between these two structures occurs relatively abruptly. These observations are related to the treeing process. C 2004 Kluwer Academic Publishers
1. Introduction
Electrical treeing constitutes a dielectric breakdown mechanism that is of considerable practical importance in connection with the use of polymeric materials in high voltage applications [1]. In this process, a mi-crovoid is initially formed within the insulation at a region of high electric stress (inception), which then de-velops through partial discharge activity to give a fractal structure composed of fine erosion channels of the order of microns in diameter (growth). Once these tree chan-nels form a continuous pathway between the electrodes, a large and destructive current flows (breakdown).
However, electrical treeing is not just of technolog-ical importance, the fundamentals have also attracted considerable attention. It is known that many parame-ters (electrical, material and environmental) influence the partial discharge activity and, hence, the growth of electrical trees (for example, see [2–15]). In particu-lar, development is affected by material factors, such as chemical composition [2] and morphology [3], and environmental factors, such as temperature [4, 5], me-chanical stress and absorbed moisture [6, 7]. The
de-∗Author to whom all correspondence should be addressed.
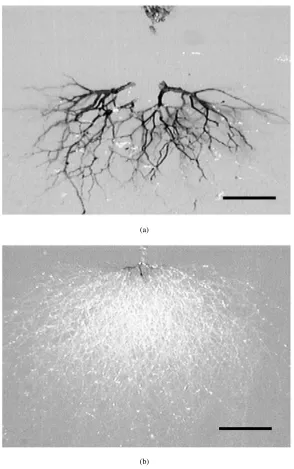
gree to which such factors influence tree growth is dependent on the form of the structure that develops [3, 8–11] and, based upon measurements of discharge activity, two distinct classes can be defined. For conve-nience, these can be termed conducting trees and non-conducting trees although, quantitatively, the difference in electrical conductivity between the two forms is un-likely to be large. Nevertheless, in so-called conduct-ing trees, electrical activity is confined to the growth tips, which requires that the constituent channels are of sufficient conductivity that the local electric fields are unable to support discharge activity. Conversely, in non-conducting trees, electrical activity occurs throughout the tree. Microscopic examination of electrical trees [8] also reveals that conducting trees appear black (see Fig. 1a) and non-conducting trees appear white under reflected light (see Fig. 1b), prompting suggestions [8] that conducting structures may form by the condensa-tion of some carbon-rich compounds that result from decomposition of the polymer. However, we are not aware of any previous report in which the chemical analysis of electrical trees has been attempted.
(a)
[image:2.612.164.458.46.515.2](b)
Figure 1 Optical images showing the complete extent (2 mm pin/plane spacing) of: (a) a black, so-called conducting tree structure and (b) a white, non-conducting tree. In each image, the scale bar=200µm.
In this paper we describe a study of the chemical nature of electrical treeing and breakdown in polyethy-lene. The objectives of this work were:
(i) To explore the extent to which confocal Raman microprobe spectroscopy constitutes a practical tool for the study of breakdown structures.
(ii) To identify the chemical composition of electri-cal trees and to explore spatial variations within the structure.
(iii) To relate the observed composition to the mecha-nism of formation.
2. Experimental
2.1. Sample preparation
The work described in this paper concerns a lene blend containing 20% of the high density polyethy-lene (HDPE) Rigidex 160-25 (BP) and 80% of the branched low density polyethylene (LDPE) LD100BW.
Injection moulded blocks of polymer were melted in a vacuum oven and tungsten needle electrodes (pin tip radius 3µm) were slowly inserted to give a pin to earth plane separation of 2 mm. Finally, the blend was crys-tallized by isothermal crystallization to completion in a silicone oil bath at 115◦C followed by quenching (in accordance with our previous practice, this material is referred to as BPK 115/20M) while the LDPE was di-rectly quenched (termed BPK Q/0) [16].
2.2. Production of electrical trees
the partial discharge activity within the structure and the backlit skeletal structure of the tree using a Peltier cooled CCD camera (Wright Instruments Ltd).
2.3. Specimen characterization
In principal, confocal Raman microprobe spectroscopy can be used to acquire subsurface chemical informa-tion. However, the true optical sectioning capability of the approach has become a highly controversial topic (see, for example, [17–25]) and, consequently, a de-structive sample preparation procedure was employed here, in which each electrical tree structure was cut open prior to analysis. To minimize surface damage, internal surfaces were prepared using an RMC MT-7 ultramicrotome equipped with a CR-21 cryo-system set at−90◦C.
The confocal Raman microprobe used in this study was a Renishaw RM1000 system, including a Renishaw NIR 780TF semiconductor diode laser (wavelength 780 nm) with a maximum output power of 25 mW. This was routinely calibrated using a Renishaw neon light source (for absolute wavelength calibration of the spectrom-eter) and a silicon standard (to determine the absolute wavelength of the diode laser). Data manipulation and analysis were performed using a combination, of the GRAMS/32 and SigmaPlot 2000 software packages.
3. Results
3.1. Raman spectroscopy and breakdown structure
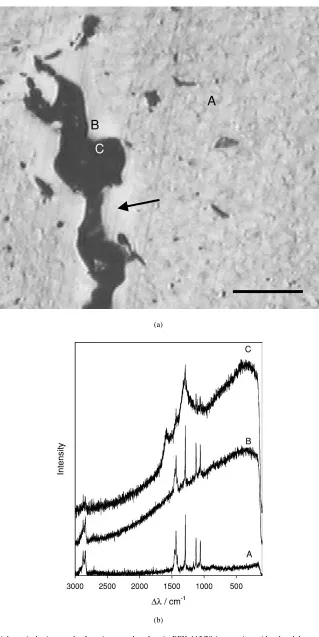
The following will demonstrate that Raman microprobe spectroscopy is far from a benign process as far as elec-trically aged specimens are concerned and, as a result, compromises are necessary if representative data are to be obtained. Before beginning any detailed spec-troscopic analysis of any trees, it was essential to ex-plore the nature of the laser/solid interactions and to develop an experimental protocol that would take into account three conflicting requirements. In order of im-portance, these were: minimum sample perturbation by the probe beam; an acceptable signal to noise ratio in the final spectrum; a reasonable data acquisition time. To do this, various spectra were obtained from the sam-ple of BPK 115/20 that is shown in Fig. 2a. In the case of this specimen, tree growth was allowed to progress to failure at 20◦C and an applied voltage of 15 kV. Consequently, a substantial fault current was drawn at the instant breakdown occurred, which resulted in lo-cal heating and melting of the polymer in the vicinity of the failure path, as evinced by the destruction of the spherulitic morphology that, initially, characterized this material [26]. The heat-affected zone, which appears as a low-contrast halo around the dark breakdown chan-nel, is arrowed in this micrograph.
Fig. 2b contains three Raman spectra, A, B and C, which were obtained, respectively, from the points marked A, B and C in Fig. 2a; to improve clarity, these spectra have been offset from one another by equal amounts along the ordinate. Trace A is a Raman spec-trum obtained from a point on the microtomed surface
that was well removed from the envelope of the tree and, although this contains appreciable noise, all the main Raman bands of polyethylene can, nevertheless, still be identified [27]. An increase in sampling time of at least an order of magnitude was required to pro-duce a significant reduction in the observed noise level, which is entirely incompatible with many of the find-ings detailed below. Comparing this with the Raman spectrum obtained from a point within the heat affected zone that lies immediately adjacent to the failure path (point B in Fig. 2b) reveals a number of similarities; the peaks corresponding to the Raman active vibrational modes of polyethylene are all still present but, now, they are superimposed upon a pronounced background signal, which rises progressively to a maximum at about 300 cm−1. Fluorescence such as this is commonly en-countered in Raman spectroscopy, particularly in the case of impure or aged specimens [28–30]. Whilst it cannot be used to provide chemical information, its presence does provide a crude indication of degrada-tion. Both the above spectra were obtained using the fol-lowing experimental conditions: 25% maximum laser power; 10 so-called continuous extended scans were in-tegrated to give each spectrum; for each scan, all points on the spectrum were integrated over 10 s.
The final trace shown in Fig. 2b was obtained from point C within the main breakdown channel. However, the application of the above experimental conditions to this region of the sample resulted in visible dam-age to the specimen and, consequently, the laser power had to be reduced from 25 to 10%. To compensate for this, 25 rather than 10 spectra were then integrated to obtain the data shown. Although this did not produce any visible evidence of changes in the sample, repeating the experiment at the same point on the specimen did not result in an identical spectrum. The initial and repeat spectra are compared in Fig. 3, together with trace A from Fig. 2b, which is included to provide some points of reference. In displaying these spectra, no offsets have been applied. In comparing the initial and repeat scans, a number of significant differences emerge. First, the magnitude of the background signal is dramatically re-duced in the repeat scan and, second, the broad peaks centred at∼1380 and∼1585 cm−1, which dominate the initial data set, appear rather less significant. Fi-nally, all of the main polyethylene peaks that fall in the 1000–1500 cm−1 region of the spectrum can also be seen in the repeat scan obtained from the breakdown channel wall. This polyethylene character is, we be-lieve, an artefact associated with prolonged exposure of the sample to the Raman probe beam.
(a)
[image:4.612.150.469.45.682.2](b)
Figure 2 (a) Reflected light optical micrograph of a microtomed surface in BPK 115/20 intersecting with a breakdown channel; the breakdown event has resulted in local melting of the polymer (scale bar=100µm). (b) Raman spectra acquired from the points marked A, B and C in the micrograph.
contribution of the polyethylene is reduced to, at most, a sharp peak, maximum 1293 cm−1 (γ
t CH2 band of polyethylene—1296 cm−1[27]), and a broad band within the range 1400–1480 cm−1 (δ CH
2 bands of polyethylene—1416–1473 cm−1 [27]). This trend of decreasing polyethylene character with decreasing
Figure 3 Effect of repeated scanning on the Raman spectrum of the breakdown channel wall, showing that polyethylene peaks become much more visible after prolonged exposure to the near infra-red laser of the confocal Raman microprobe. The polyethylene spectrum is included for comparison.
Figure 4 Comparison of Raman scattering in the vicinity of 1400 cm−1 from the breakdown channel wall and a graphitic reference. In both, the GandDbands of carbon can be seen.
the near infra-red (NIR) Raman laser, which results in changes in its structure.
In addition to the Raman spectrum of the discharge channel wall, Fig. 4 also includes a spectrum obtained from a graphitic sample, for comparison. The Raman behaviour of the various forms of carbon has been
stud-ied extensively (see, for example, [31–34]). In the case of systems which contain considerable amounts of sp2 bonding, the observed spectrum is generally dominated by two bands, the so-calledGandDbands, which are, respectively, located at about 1560 and 1360 cm−1[35]. TheGband is associated with the in-plane stretching mode of graphite withE2gsymmetry [36, 37] whilst the
Dband has been related to disordered sp2carbon [18, 37]. However, the exact characteristics of both these bands (position and width) are influenced by the ex-citing wavelength [35] and the local order within the specimen [18, 36–38]. Prawer et al.[38] argued that the peak position of theGband depends on the sp2/sp3 bonding ratio while Heinmanet al.[37] have suggested that internal stresses will also have an effect. Never-theless, from the peaks present in both of the spectra shown Fig. 4, it is evident that the breakdown chan-nel wall is carbonaceous in nature. In addition, the background signal may also provide a further clue to its precise nature, in that broadband Raman scattering around 1500 cm−1 has been associated with hydro-genated polymeric forms of amorphous carbon [36], particularly when the sample is excited with a long wavelength laser, as here [35].
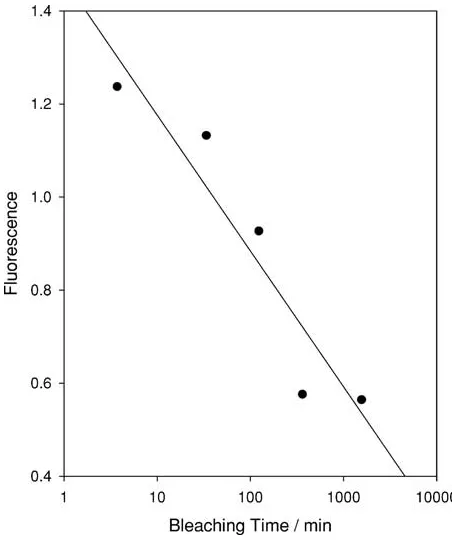
The issue of perturbation of the Raman spectrum by the incident laser was also investigated in connection with the pronounced fluorescent background that char-acterizes spectrum B in Fig. 2b. Where identification of the chemical composition of an artefact is required, the fluorescent background constitutes an inconvenience that can often be dramatically reduced by the simple expedient of exposure to the exciting laser. That is, the sample is photo-bleached [27, 29]. Fig. 5 shows the effect of laser exposure time on the magnitude of the
Figure 5 Effect of exposure of the polyethylene matrix to the near infra-red laser of the confocal Raman microprobe. Here, the extent of the fluorescence is represented by the magnitude of the background at 1296 cm−1, normalized to the height of theγ
[image:5.612.311.537.480.750.2]fluorescent background obtained from a point within the heat affected zone adjacent to that used to ac-quire spectrum B in Fig. 2b. In this, the fluorescence is represented by the magnitude of the background at 1296 cm−1, normalized to the height of theγtCH2band of polyethylene. Although this plot suggests that fluo-rescence decreases approximately exponentially with time, which is not unreasonable over relatively short time scales, our reason for including it is simply to demonstrate, once again, that the process of interrogat-ing the specimen can modify the form of the data that is finally obtained.
To summarize, the above preliminary measurements have led to the following
conclusions:-(i) The spectra obtained from the above treed sample can be understood in terms of three distinct elements: the conventional Raman spectrum of polyethylene, flu-orescence and broad features that are best associated with the presence of disordered carbon.
(ii) Exposure of the sample to the laser beam can result in significant perturbations to the acquired data. This can manifest itself simply as photo-bleaching or, alter-natively, through the introduction of spurious peaks.
(iii) Provided it does not prevent spectral interpreta-tion, we suggest that some noise within the spectra is preferable to the introduction of such artefacts.
3.2. Raman analysis of an electrical tree The chemical nature of a conducting electrical tree in BPK Q/0 was investigated in detail using the specimen shown in Fig. 1a, which was grown at 30◦C at an applied voltage of 13.5 kV. To explore the chemical nature of the fine channels that make up this structure, a series of Raman spectra were first acquired, sequentially, along a line perpendicular to the axis of a channel. This process has been repeated many times, and on different trees, but only one set of typical results is shown here.
Fig. 6a shows an optical micrograph of a single chan-nel; the superimposed line indicates the axis from which the Raman data in Fig. 6b were obtained. Consider first the tree channel core itself. Here, there is little evidence of the Raman signature of polyethylene, the only ob-vious remnant is located at∼2800 cm−1since, in this region of the spectrum, the background signal is rela-tively low. Also, in the range 1000–1500 cm−1, where the majority of the characteristic polyethylene peaks are located, there is some evidence of broad, flat features superimposed upon the rising background signal. Thus, from this spectrum and that obtained from the channel edge, it is evident that the fine tubules that make up this electrical tree have much in common with the large breakdown channel discussed above. Both can be ana-lyzed in terms of polyethylene, broad carbon peaks in the range 1300–1500 cm−1 and fluorescence. Whilst degradation within the channel itself is unsurprising, as evinced by the presence of both fluorescence and disordered carbon, fig. 6b also demonstrates that, even well away from a channel (up to 25µm in this figure), the acquired Raman spectra are very different from the idealized polyethylene case shown in Fig. 2. Although
the same discrete peaks are present, they are now su-perimposed upon a significant fluorescent background. Whilst this may be interpreted as providing evidence for chemical changes within the material immediately surrounding the tree channel (i.e., the introduction of fluorescent centres), an alternative explanation is that, despite its confocal design, the spectrometer may be sampling some degraded sub-surface features, which are not visible in Fig. 6a. From Figs 2b and 6b, tree channels are highly fluorescent structures.
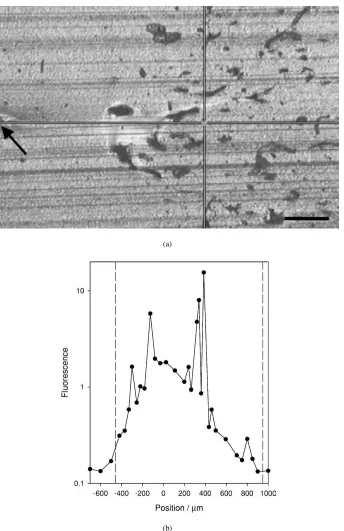
To explore further the origin and extent of fluores-cence within the body of the tree, spectra were acquired at intervals along a line perpendicular to the axis of the tree and 600µm away from the needle, as shown in Fig. 7a. In all cases, data were acquired from a point on the surface where no evidence of electrical damage could be seen, either within the surface itself or on de-focusing in an attempt to image sub-surface features. The magnitude of the fluorescence, evaluated using the same criterion used to produce Fig. 5, is plotted as a function of position in Fig. 7b, where zero corresponds to the axis of the needle electrode. Beyond the limits of the tree, as defined by visible tubules within the micro-tomed surface, there is negligible fluorescence. Mov-ing across the tree, the level of background emissions increases significantly. Whilst this is generally progres-sive, there are specific locations where the fluorescence increases locally by as much as an order of magnitude. Since the surface appeared equivalent at all these points, we suggest that this a consequence of the instrument, locally, sampling sub-surface channels; these are the only features we have detected in our treeing experi-ments that give rise to such strong fluorescence. If the origin of the fluorescent anomalies in Fig. 7b is indeed subsurface tree channels, as proposed, then in materi-als such as this polyethylene blend, the optical section-ing capability of confocal Raman spectroscopy appears very limited. This point is currently being investigated in detail [39], since it has important implication for the general utility of the technique. Nevertheless, these anomalies aside, it is implausible, we would suggest, to argue that all of the chosen points in Fig. 7b serendip-itously happen to sample invisible subsurface features in such a progressive way as to give the smooth curve that lies beneath the fluorescent anomalies in this plot. Therefore, this figure also demonstrates that fluores-cence is indeed a genuine feature of all the material within the treed region, implying that material degra-dation is not confined to the branches and channels that make up an electrical tree but, rather, occurs to some extent throughout the complete body of the structure.
(a)
[image:7.612.128.484.54.638.2](b)
Figure 6 (a) High magnification reflected light optical micrograph of a single tree channel within the microtomed surface; at this magnification, the centre of the tree channel is out of focus (∼3µm below the microtomed surface), whilst the edges show some evidence of a shell structure,∼1µm in thickness (scale bar=10µm). (b) Raman spectra acquired at various distances away from the centre of the channel along the line shown in the micrograph.
Dbands of sp2carbon, superimposed upon a strong flu-orescent background. The spectrum at 650µm is based upon the same two elements but unusually, here, it is the two carbon bands that dominate. The reason for this is, most likely, the precise morphology of the tree channel used to obtain these data. This spectrum was acquired from the branch point shown in Fig. 8b; that
(a)
[image:8.612.141.485.46.577.2](b)
Figure 7 (a) Low magnification reflected light optical micrograph of the electrical tree (scale bar=100µm). (b) Plot showing the extent of the fluorescence as a function of position along the vertical line shown in the micrograph; zero corresponds to the point of intersection of the crosshairs. Here, the extent of the fluorescence is represented by the magnitude of the background at 1296 cm−1, normalized to the height of theγtCH2band of
polyethylene and the dashed vertical lines represent the visible limits of the tree within the microtomed surface.
The final three spectra shown in Fig. 8a were ac-quired at increasing distances from the electrode. The spectrum indicated 1190µm was obtained from an ex-tremely fine tubule at the very periphery of the structure, whereas the almost identical spectrum marked 1130µm was obtained from an extensive channel. This implies that it is not the size of the structure but, rather, its loca-tion within the tree (i.e., the lifetime of the channel) that determines channel chemistry. Moving closer towards the electrode (810µm) the fluorescence increases but, again, the channel spectrum is indicative of degraded polyethylene not carbon.
4. Discussion
(a)
[image:9.612.137.477.47.605.2](b)
Figure 8 (a) Raman spectra acquired from channels located at different points on the surface; the distances from the position of the needle tip within the microtomed surface is shown in each case. (b) High magnification optical micrograph showing the branch point used to acquire the spectrum at 650µm (scale bar=10µm).
structures and, therefore, distance measurements made within a non-specific microtomed surface are, in ab-solute terms, meaningless. Nevertheless, the assertion that the character of the channels within this structure changes, apparently abruptly, as the periphery of the object is approached is consistent with physical obser-vations. First, electrical activity in trees such as this is confined to the growth tips [41]; this requires (i) that channels within the core are of sufficient electrical conductivity to prevent local discharge activity and (ii) that the tips are electrically insulating, thereby
allow-ing discharges to take place within them [8, 10, 11]. Second, in polyethylene, non-conducting trees are of-ten a precursor to conducting trees [10], implying that a critical time is required to establish the conditions under which graphitic carbon shells are able to form within, initially, hollow tubules. No doubt, this will de-pend upon both the imposed electrical conditions and the material.
remains unclear. The degradation of polyethylene has been studied under many different conditions. In the bulk, thermal degradation is dominated by chain scis-sion reactions such that volatile by-products result [42]; local heating and ablation with a high power infra-red laser also produces no decomposition residue [43]. Surface damage through electrical discharge ac-tivity has been studied in many polymers and compos-ites in connection with potential applications in out-door insulators and, although many systems degrade to produce conducting carbonaceous tracks, polyethylene does not [44]. Also, in a related polyolefin, quenching was found to lead to the subsequent growth of con-ducting trees whilst isothermal crystallization was fol-lowed by the development of non-conducting structures [3]. In epoxies, conducting trees have been observed at temperatures below the glass transition (Tg), whilst non-conducting trees form above Tg [8]. The mech-anism by which graphitic residue forms within elec-trical trees cannot, therefore, simply be related to the bulk decomposition chemistry of the insulation mate-rial; other factors must also play a part. Although this is a critical issue in both understanding the nature of electrical trees and, practically, in devising technolog-ical means of detecting their presence, in the absence of specific evidence, further speculation here is of little value.
5. Conclusions
Electrical treeing is a technologically important phe-nomenon and one that has attracted much fundamen-tal study. However, to our knowledge, this constitutes the first chemical analysis of such structures. Although confocal Raman microprobe spectroscopy would ap-pear to be an ideal approach to chemical analysis on the micron scale, our results indicate that the technique can be invasive and, more significantly, they also raise questions over the spatial resolution that can really be obtained with the approach. Nevertheless, we can in-terpret all the experimental Raman spectra we have ob-tained in terms of three distinct elements: polyethylene; fluorescence due to partial degradation of the polymer; amorphous carbon within well-established tree chan-nels. The proportion of these basic elements varies from place to place, with even the polymer between tree channels showing signs of degradation. The chan-nels at the core of the tree all show evidence of sp2 hybridized carbon, often, together with the signature of degraded polyethylene. Whether this latter compo-nent is a genuine reflection of the typical chemistry of conducting tree channels or is merely an instrumental artefact resulting from a large sampling volume is, how-ever, unclear. Where the geometry of the tree channel gave good access to its core, strong carbon G andD
bands were observed. Conversely, carbon was not de-tected at the tips of the tree, suggesting that conducting electrical trees consist of a graphitic core, surrounded by a region in which the channels are hollow and non-conducting; the transition appears to be relatively abrupt.
Acknowledgements
The authors wish to thank National Grid Transco for supporting the work described and for giving permis-sion to publish the results, and to acknowledge the con-tribution made by Mr J. R¨unge in acquiring some pre-liminary results. This paper is dedicated to the memory of Professor Tony Davies.
References
1. L. A. D I S S A D OandJ. C. F O T H E R G I L L, “Electrical Degra-dation and Breakdown in Polymers,” edited by. G. C. Stevens (Peter Perigrinus, London, 1992).
2. J. H. M A S O N,IEE Proc.A.128(1981) 193.
3. J. V. C H A M P I O N, S. J. D O D D, Y. Z H A O, A. S. V A U G H A N,M.B R O W N,A.E.D A V I E S,S.J.S U T T O N andS. G. S W I N G L E R,IEEE Trans. Diel. Electr. Insul.8(2001) 284.
4. R. J. D E N S L E Y,ibid.14(1979) 148.
5. M. I E D A andN. N A W A T A, in “Ann. Rep. CEIDP” (IEEE, Piscataway, 1972) p. 143.
6. J. V. C H A M P I O NandS. J. D O D D,J. Phys. D: Appl. Phys.
32(1999) 305.
7. E. D A V I D, J. -L. P A R P A LandJ. P. C R I N E,IEEE Trans. on Diel. Electr. Insul.3(1996) 248.
8. J. V. C H A M P I O NandS. J. D O D D,J. Phys. D: Appl. Phys. 34(2001) 1235.
9. Idem., in “Space Charge in Solid Dielectrics,” edited by L. A. Dissado and J. C. Fothergill (The Dielectrics Society, Leicester, 1998) p. 273.
10. C. L A U R E N TandC. M A Y O U X,IEEE Trans. Electr. Insul.15
(1980) 33.
11. K. W U, Y. S U Z U O K I, T.M I Z U T A N IandH. X I E,J. Phys. D: Appl. Phys.33(2000) 1209.
12. F. N O T OandN. Y O S H I M U R A, “Ann. Rep. CEIDP” (IEEE, Piscataway, 1974) p. 207.
13. J. V. C H A M P I O NandS. J. D O D D,J. Phys. D: Appl. Phys. 29(1996) 862.
14. J. V. C H A M P I O N, S. J. D O D DandJ. M. A L I S O N,ibid. 29(1996) 2689.
15. J. V. C H A M P I O NandS. J. D O D D,ibid.28(1995) 398. 16. I. L. H O S I E R, A. S. V A U G H A NandS. G. S W I N G L E R,
J. Mater. Sci.32(1997) 4523.
17. R. T A B A K S B L A T, R. J. M E I E R andB. J. K I P,Appl. Spectroscopy46(1992) 60.
18. G. T U R R E L LandP. D H A M E L I N C O U R T, in “Modern Tech-niques in Raman Spectroscopy,” edited by J. J. Laserna (Wiley, London, 1996) p. 116.
19. N. J. E V E R A L L,Appl. Spectroscopy54(2000) 773. 20. Idem.,ibid.54(2000) 1515.
21. S. M I C H I E L S E N, J. Appl. Polym. Sci. 81 (2001) 1662.
22. H. R E I N E C K E, S. J. S P E L L S, J. S A C R I S T A N, J. Y A R W O O D and C. M I J A N G O S, Appl. Spectroscopy 55
(2001) 1660.
23. K. J. B A L D W I NandD. N. B A T C H E L D E R,ibid.55(2001) 517.
24. L. B A I A, K. G I G A N T, U. P O S S E T, G. S C H O T T N E R, W. K I E F E RandJ. P O P P,ibid.56(2002) 536.
25. M. V A N D E N B R I N K, M. P E P E R S and A. M. V A N H E R K,J. Raman Spectroscopy33(2002) 264.
26. Y. Z H A O, A. S. V A U G H A N, J. V. C H A M P I O N, S. J. D O D D andS. J. S U T T O N, in Proceedings of the 8th International Conference on Dielectric Materials, Measurements and Applications, Edinburgh, September 2000 (IEE, London, 2000) p. 314.
27. D. I. B O W E RandW. F.M A D D A M S, “The Vibrational Spec-troscopy of Polymers” (Cambridge University Press, Cambridge, 1989).
30. P. W. S A Y E R S, T. J. L E W I S, J. P. L L E W E L L Y N and C. L. G R I F F I T H S, in Proceedings of the 8th International Con-ference on Dielectric Materials, Measurements and Applications, Edinburgh, September 2000 (IEE, London, 2000) p. 403. 31. L. B U R G I O, D. A. C I O M A R T A N andR. H. C L A R K,
J. Raman Spectroscopy28(1997) 79.
32. P. H E N D R A, C. J O N E SandG. W A R N E S, “Fourier Trans-form Raman Spectroscopy” (Ellis Horwood, Chichester, 1991). 33. J. B. W A N G, C. Y. Z H A N G, X. L. Z H O N GandG. W.
Y A N G,Chem. Phys. Letts.361(2002) 86.
34. J. -M. C O S T A N T I N I,F. C O U V R E U R,J. -P.S A L V E T A T andS. B O U F F A R D,Nucl. Instr. Meth. Phys. Res.B194(2002) 132.
35. A. C. F E R R A R I,Diam. Relat. Mater.11(2002) 1053. 36. Y. U M E H A R A, S. M U R A I, Y. K O I D E and
M. M U R A K A M I,ibid.11(2002) 1429.
37. A. H E I M A N, E. L A K I N, E. Z O L O T O Y A B K O and A. H O F F M A N,ibid.11(2002) 601.
38. S. P R A W E R, K. W. N U G E N T, Y. L I F S H I T Z, G. D. L E M P E R T, E. G R O S S M A N, J. K U L I K, I. A V I G A Land R. K A L I S H,ibid.5(1996) 433.
39. A. M. M A C D O N A L D, A. S. V A U G H A NandP. W Y E T H, Appl. Spectroscopy(2003) in press.
40. N. S A V V I D E S,J. Appl. Phys.59(1986) 4133. 41. Y. Z H A O, PhD Thesis, The University of Reading, 1999. 42. A. S C H W A R ZandG. C R A M E R, in “Polyethylene,” edited by
A. Renfrew and P. Morgan (Interscience, London, 1960) p. 231. 43. A.S.V A U G H A N, S. G.S W I N G L E R,M. L A N F E A R, H.
W E I N G A N D TandH. W H I T E, in “Ann. Rep. CEIDP” (IEEE, Piscataway, 1992) p. 501.
44. D. J. P A R RandR.M. S C A R I S B R I C K,Proc. IEE112(1965) 1625.
Received 16 January