AT
Austria
BE
Belgium
BE fr
Belgium –
French speaking
community
BE nl
Belgium –
Dutch speaking
community
BE de
Belgium –
German speaking
community
BG
Bulgaria
CY
Cyprus
CZ
Czech Republic
DE
Germany
DK
Denmark
EE
Estonia
EL
Greece
ES
Spain
EU
European
Union
FI
Finland
FR
France
HR
Croatia
HU
Hungary
IE
Ireland
IT
Italy
LT
Lithuania
LU
Luxembourg
LV
Latvia
MT
Malta
NL
Netherlands
PL
Poland
PT
Portugal
RO
Romania
SE
Sweden
SI
Slovenia
SK
Slovakia
UK
United
Kingdom
UK-ENG
England
UK-NIR
Northern
Ireland
UK-SCT
Scotland
UK-WLS
Wales
IS
Iceland
LI
Liechtenstein
NO
Norway
AL
Albania
ME
Montenegro
MK
The former
Yugoslav
Republic of
Macedonia
RS
Serbia
TR
Turkey
The Education and Training Monitor 2014
is accompanied by
28 individual country reports
and an
online visualisation tool
ec.europa.eu/education/monitor
AT SE FI NO EE LV LT PL DE NL BE LU FR ES UK IE HR EL IT CY CZ SKSI HU RO
BG TR PT MT DK MK LI RS ME AL
Education and Training
Monitor 2014
Education and Training
ISBN 978-92-79-39397-6 ISSN 2315-1064
The Education and Training Monitor 2014 consists of two separate Volumes, of which this is Volume I.
Volume I, featuring the cross-national analysis, is divided into three parts. Part 1: The case for education discusses the most prominent reasons why Member States should invest in their education and training systems. Part 2: Qualifications and competences covers the key outcomes of education and training systems. Part 3: Education policy levers for building growth presents the evidence on policy drivers that can transform education investments into stronger impact by focussing on specific areas to improve the efficiency and effectiveness of European education and training systems.
Volume II can be found on the website of the Education and Training Monitor. It consists of twenty-eight individual country reports that provide a more in-depth analysis of each Member State’s specific situation, taking into account contextual information that characterises each country.
The website also provides additional indicators that were used throughout the monitoring exercise in order to better understand of the contextual factors influencing progress over time and differences among countries. These additional indicators are part of the Joint Assessment Framework (JAF)i; a tool that enables a consistent and transparent monitoring for all the Member States.
Finally, the online Education and Training Monitor contains a visualisation tool for the twofold Europe 2020 headline target on education and training and the additional ET 2020 benchmarks. The tool allows users to intuitively compare Member States in terms of current performance and recent change, but also to have a closer look at the standard sub-groups used throughout the 2014 Monitor.
ec.europa.eu/education/monitor
i The quantitative component of this monitoring tool is explained in JRC-CRELL (2014), Monitoring the evolution of education and training
systems: A guide to the Joint Assessment Framework (https://crell.
jrc.ec.europa.eu/). The qualitative component is exemplified by various tables throughout the Monitor that capture country efforts to tackle a particular policy issue, based on evidence from Eurydice and Cedefop.
Ed uc at io n a nd T ra in in g M on ito r 2 01 4
More information on the European Union is available on the Internet (http://europa.eu). Cataloguing data can be found at the end of this publication.
Luxembourg: Publications Office of the European Union, 2014
ISBN 978-92-79-39397-6 ISSN 2315-1064
Cover image: © Shutterstock.com © European Union, 2014
Reproduction is authorised provided the source is acknowledged.
Printed in
Printed on elemental chlorine-free bleached paper (ecf)
Europe Direct is a service to help you find answers to your questions about the European Union.
Freephone number (*):
00 800 6 7 8 9 10 11
(*) Certain mobile telephone operators do not allow access to 00 800 numbers or these calls may be billed.
Luxembourg: Publications Office of the European Union
2014 — pp. 84 — 21 x 29.7cm
ISBN 978-92-79-39397-6 ISSN 2315-1064
CVTS Continuing Vocational Training Survey (Eurostat)
DG EAC Directorate-General for Education and Culture, European Commission
EACEA Education, Audiovisual and Culture Executive Agency, European Commission
ECEC Early Childhood Education and Care
ECTS European Credit Transfer and Accumulation System
ECVET European Credit System for Vocational Education and Training
EEA European Economic Area (EU, NO, IS, LI)
EENEE European Expert Network on Economics of Education
EQAR European Quality Assurance Register for Higher Education
EQAVET European Quality Assurance for Vocational Education and Training
EQF European Qualifications Framework for lifelong learning
ERDF European Regional Development Fund
ESF European Social Fund
ESG European Standards and Guidelines for Quality Assurance in Higher Education
ET 2020 Strategic framework for European cooperation in education and training
EUROPE 2020 The EU’s ten-year strategy for smart, sustainable and inclusive growth
EUROSTAT Statistical office of the European Union
EURYDICE Education Information Network in the European Community
GDP Gross Domestic Product
HEI Higher education institution
ICILS International Computer and Information Literacy Study (IEA)
ICT I nformation and Communication Technology
IEA International Association for the Evaluation of Educational Achievement
IPTS Institute for Prospective Technological Studies
ISCED International Standard Classification of Education
ISCO International Standard Classification of Occupations
JAF Joint Assessment Framework
JRC Joint Research Centre (European Commission)
LFS European Union Labour Force Survey (Eurostat)
MOOCs Massive Online Open Courses
NEET Not in employment, education or training
NESET Network of Experts on Social Aspects of Education and Training
NESSE Network of Experts in Social Sciences of Education and training
NUTS Nomenclature of Territorial Units for Statistics
OECD Organisation for Economic Co-operation and Development
OER Open Educational Resources
OJ Official Journal of the European Union
PIAAC Programme for the International Assessment of Adult Competencies (OECD)
PIRLS Progress in International Reading Literacy Survey (IEA)
PISA Programme for International Student Assessment (OECD)
PPS Purchasing Power Standards
QF EHEA Qualifications Framework for the European Higher Education Area
STEM Science, technology, engineering and mathematics
TALIS Teaching and Learning International Survey (OECD)
TIMSS Trends in International Mathematics and Science Study (IEA)
UOE Common data collection of United Nations Educational, Scientific and Cultural Organization (UNESCO) Institute for Statistics, OECD and Eurostat
VET Vocational education and training
YEI Youth Employment Initiative
Current Target
Headline target
1
Early leavers fromeducation and training
The share of the population aged 18-24 having attained ISCED level 0, 1, 2 or 3c short and not receiving any formal or non-formal education or training in the four weeks preceding the survey.
12.0% Below 10%
2
Tertiary educationattainment
The share of the population aged 30-34 years having successfully completed ISCED level 5 or 6.
36.9% At least 40%
Other targets
3
Early childhoodeducation and care
The share of the population aged 4 to the age when primary education starts who are participating in early education.
93.9% 95%
4
Low achievement inreading, maths and science
The share of 15-year-olds failing to reach Level 2 in reading, mathematics and science. Reading: 19.6% Maths: 22.2% Science: 17.7% 15%
5
Employment rate ofrecent graduates
The share of employed people aged 20-34 having successfully completed upper secondary or tertiary education 1 to 3 years before the reference year of the survey and who are no longer in education or training.
75.5% 82%
6
Adult participation in lifelong learningThe share of the population aged 25-64 who stated that they received formal or non-formal education or training in the four weeks preceding the survey.
10.5% 15%
Source: Eurostat (LFS 2013 for 1, 2, 5 and 6; UOE 2012 for 3) & OECD (PISA 2012 for 4).
2014_TRAI-14-ETmonitor2014-Cover_A4_avec-rabats_00.indd 2 3/11/14 21:35
Education and Training Monitor 2014
This publication is based on document SWD (2014) 337. The Education and Training Monitor 2014 was prepared by the Directorate-General of Education and Culture (DG EAC). DG EAC was assisted by the Eurydice unit from the Education and Culture Executive Agency (EACEA), Cedefop, the JRC’s Centre for Research on Education and Lifelong Learning (CRELL) and Eurostat. The Members of the Standing Group on Indicators and Benchmarks (SGIB) were consulted during the drafting phase.
Manuscript completed in October 2014
Additional contextual data can be found online (ec.europa.eu/education/monitor)
November 2014 | 3
Foreword
The purpose of education is to prepare individuals for life and to instil a sense of democratic citizenship; and to do so for all learners, regardless of socio-economic and cultural differences. Quality education and training fuel inclusive, sustainable growth as learning outcomes translate into the productivity and innovation of the working-age population.
The crisis has brought to light that sometimes education systems prepare children for a world that no longer exists; many schools are not attuned to the benefits of digital learning and the new pedagogies they enable; and too many learners do not have their qualifications recognised.
The case for education is not built on aspiration but on fact. This third edition of the Education and Training Monitor charts the evidence we have collected over the past year in a concise, digestible way, and offers policy messages for Member States. It demonstrates that we need to strengthen our investments in education while we must look beyond the number of people with qualifications, and that we have to boost the inclusiveness, quality and flexibility of our education and training systems. It highlights the importance of focusing on the quality and attractiveness of the teaching profession; including by enabling teachers and learners to benefit from effective use of innovative pedagogies and tools.
The Monitor represents an important analytical contribution to the implementation of the strategic framework for European cooperation in education and training (ET 2020); moreover, this year it gives strong inputs to its 2015 Joint Report and the development of future working priorities. How? By strengthening the evidence-base and by linking it more closely to the broader Europe 2020 strategy and the country-specific recommendations adopted by the Council as part of the 2014 European Semester.
Complete with its online visualisation tool and additional data, the Monitor is part and parcel of our ongoing effort to strengthen our analysis and knowledge management. It is part of a bigger picture, illustrating how we better align new studies to our operational agenda and streamline quantitative and qualitative information from external providers with our own evidence-based policy coordination. At the same time, it is the fruit of our ever-growing country analysis.
The Monitor is also a good example of cooperation between services, with contributions from the Eurydice unit of our Education and Culture Executive Agency (EACEA), Cedefop, the JRC's Centre for Research on Education and Lifelong Learning (CRELL) and Eurostat. It moreover profits from close cooperation with the OECD through the Teaching and Learning International Survey (TALIS), the Programme for International Student Assessment (PISA) and the Survey of Adult Skills (PIAAC).
November 2014 | 5
Contents
Volume I
Key findings and policy relevance
7
1. The case for education
12
1.1. Investing in education and training
13
1.2. Raising employment rates of young graduates
18
1.3. Tackling inequalities
23
2. Qualifications and competences: a key outcome of
education
29
2.1. Early leavers from education and training
30
2.2. Tertiary education attainment
35
2.3. Key basic competences
41
2.4. Key transversal competences
49
3. Education policy levers for building growth
55
3.1. Improving the inclusiveness of early childhood education and care
55
3.2. Attracting, retaining and motivating teachers for better education
60
3.3. Introducing new pedagogies and technologies in education and training
64
3.4. Boosting the quality and relevance of higher education
68
3.5. Strengthening the offer of high-quality vocational education and training 72
3.6. Facilitating lifelong learning after initial education
76
3.7. Enabling the validation of qualifications and competences
80
Annex: EEA and candidate countries
84
Volume II
Country reports
November 2014 | 7
Key findings and policy relevance
The third annual Education and Training Monitor assesses the evolution of education and training systems across Europe. It does so on the basis of targets set at the European level, as well as other indicators, studies and reports. The Monitor looks at (1) investment in education and the wider reasons for this investment; (2) the learning outcomes of education as measured by qualifications and competences; and (3) the policy levers that can help to improve learning outcomes for all and to strengthen returns to education investment.
The Education and Training Monitor 2014 is released on the eve of the Juncker Commission taking office, which has pledged an ambitious Jobs, Growth and Investment Package focused, in part, on education, research and innovation. The new Commission will pursue the modernisation of education systems through the European Semester of economic policy coordination, with a view to progressing towards the education targets set in the Europe 2020 strategy.
1.
The case for education
The economic and financial crisis has had a profound impact on society. Unemployment has reached unacceptably high levels in many parts of the EU, particularly among Europe’s youth. This is the number one concern set out in the Political Guidelines of President elect Juncker. Education cannot afford to contribute anything less than its full potential. There is a strong economic and social case for investing in education. Education contributes to productivity, competitiveness and innovation, while levelling the playing field and breaking cycles of disadvantage.
But education is facing its own structural challenges. Population ageing means that Member States will have to exploit fully the pool of talent amongst the school-age population. Productivity, competitiveness and innovation will have to grow, with relatively fewer people to rely on. Education in many Member States is, at the same time, out of touch, as systems are still struggling to meet 21st century expectations. These challenges pre-date the crisis, but are now aggravated by a consolidation of public finance.
The country-specific recommendations (CSRs) adopted by the Council as part of the 2014 European Semester reflect the importance of education and training for Europe. The Monitor confirms the messages delivered in the CSRs and brings forward the following evidence and lessons for policy:
1.1. Strong education performance cannot be expected without sufficient resources and reforms to ensure their effectiveness. Yet nineteen Member States cut their education expenditure in 2012. Six Member States decreased investments by more than 5% (EL, ES, CY, HU, PT, RO). Some of the countries that devote relatively few resources to education have decreased their investment further (BG, RO, SK). Since 2008, six countries saw a decrease in expenditure across all levels of education (BG, EL, IT, LV, PT, RO). Underinvestment in human capital risks undermining Europe's prospect for sustainable and inclusive growth. Reforms will be required to make sure that education and training systems work effectively and efficiently.
8 | November 2014
1.3. Education has to live up to its potential to level the playing field, to avoid proactively any form of discrimination and social exclusion, and to provide chances for all learners. Socio-economic and socio-cultural inequalities continue to impact negatively upon educational outcomes. Parental education attainment still determines to a large extent one's own education attainment and new evidence suggests that intergenerational education mobility is actually slowing down in the industrialised world. Ten countries received CSRs to focus on disadvantaged learners in particular (AT, BG, CZ, DE, DK, HU, LU, RO, SE and SK). Although tackling educational disadvantage is complex and requires wide-ranging, integrated strategies, Member States cannot afford to ignore these challenges.
2.
Qualifications and competences: a key outcome of education
2.1. Reducing the number of early school leavers will save Europe large public and social costs and protect the individual from a high risk of poverty and social exclusion. There are still more than five million early school leavers across Europe, facing an unemployment rate of 41%. As Europe gets closer to the Europe 2020 headline target, 12.0% in 2013, it becomes increasingly visible what a complex, multi-faceted problem early school leaving is. A slow but steady progress is hiding significant disparities between but also within countries. The risk of early school leaving is 33.3% higher amongst men; more than twice as high for the foreign-born; no less than 156.1% higher for those suffering physical difficulties; and more than three times as high in bottom-performing regions than in top-performing regions in BG, CZ, PL, ES, UK and BE.
2.2. In higher education, broadening access and reducing dropout rates amongst disadvantaged groups remains challenging. The rate of tertiary education attainment in Europe has steadily grown to 36.9%, yet high-qualified employment is forecasted to have increased a further 13% by 2020. Moreover, the persisting disparities between and within countries leave no room for complacency. The rate of tertiary education attainment is 26% higher amongst women; about 10% higher for native-born; 62.4% lower for individuals suffering physical difficulties; and in CZ, RO and SK, bottom-performing regions have attainment rates that are at least 60% lower than those found in top-performing regions. Only a handful of countries strive to widen participation and boost completion rates amongst disadvantaged groups.
2.3. Targeted policy action is needed to reduce low achievement in key basic competences across Europe. Amongst 15 year-olds, the EU is not making enough progress in order to reach the 2020 target of at most 15% low achievement in maths, even if negligible gender differences in maths and science hold potential for later STEM fields of study that can be exploited more fully. At the same time, the large and persisting reading disadvantage for boys across all Member States calls for specific policy initiatives. Across the EU's working-age population, the overall rate of low achievement in literacy and numeracy is 19.9% and 23.6% respectively, with significant discrepancies between countries in the skills-value of qualifications. Socio-economic status is still by far the most important determinant of an individual's key basic competences.
November 2014 | 9
3.
Education policy levers for building growth
The Education and Training Monitor 2014 identifies three main strands of policy levers that can help strengthen the impact of education and training systems across Europe.
Improving the quality and inclusiveness of pre-primary and compulsory education by reaching out to the most disadvantaged, giving more attention to the teaching profession and better exploiting the potential of innovative pedagogies and digital learning.
3.1. Policy action should better acknowledge the essential role of early childhood education and care (ECEC) in tackling inequalities and raising proficiency in basic competences. ECEC is an effective and an efficient investment in education, as reflected in CSRs to ten Member States (AT, BG, CZ, DE, IE, IT, PL, RO, SK and UK). Although older children in the age bracket are commonly in early education all across Europe, the need to focus on the younger ones remains – and cannot be met by informal, non-professional care only. Moreover, new evidence shows that while ECEC quality is a priority for many Member States, targeted support for disadvantaged families is still not prevalent.
3.2. Focussing on the teaching profession should be a priority for the next years.
Eleven Member States suffer a shortage of qualified teachers (AT, BE fr, DK, DE, IT, LU, NL, RO, SI, SK, SE), while the lack of qualified teachers for disadvantaged schools is of particular concern. The TALIS results also highlight the need for beginning teachers to have access to formal induction programmes, continuing professional development opportunities, and systematic appraisal mechanisms. A coherent policy framework on teaching should address the attractiveness of the teaching profession and the recruitment, allocation and retention of qualified teachers. Due attention is to be put into devising teacher education programmes that develop the skills needed for teaching to a diverse group of learners.
3.3. Combining innovative pedagogies with an effective use of digital tools and content will boost education in terms of quality, equity and efficiency.The most effective teaching methods place students at the centre of the learning process. Digital tools are often involved in such active teaching practices, yet only one out of three teachers in the EU reports frequent use of practices involving ICT. Close to 20% of lower secondary school teachers indicate that they have a high need for continuing professional development in the area of ICT skills for teaching and new technologies in the workplace. Meanwhile, MOOCs are becoming more prevalent, but Europe is still lagging behind. This is a policy priority, as MOOCs and Open Educational Resources have the potential of reaching a far larger and more diversified audience than traditional forms of learning, and at a lower cost.
Strengthening the quality and relevance of higher education and of VET, work-based learning and apprenticeships through e.g. better quality assurance, use of labour market projections, career guidance and graduate tracking surveys.
10 | November 2014
3.5. VET, work-based learning and apprenticeships play a key role in tackling youth unemployment and facilitating the transition to the labour market, by linking more closely the worlds of education and work.
This was the subject of no fewer
than twenty-two CSRs in 2014, eight of which explicitly referring to the Youth Guarantee (BG, ES, HR, IE, IT, PL, PT and SK). About half of upper secondary students across Europe follow vocational education and training (VET) programmes and around 27% of them are in combined school- and work-based learning programmes, including apprenticeships. Key challenges lie in raising the attractiveness of VET through improving its quality and relevance, particularly by feeding employability data back into VET programmes.Promoting, facilitating and incentivising continued learning after initial education and making sure that learning outcomes are transparent and easily recognised across different contexts.
3.6. Continued learning after initial education is crucial for raising productivity levels of the working-age population and tackling skill mismatches and bottlenecks on the labour market. It was the topic of eleven CSRs in 2014 (BG, EE, ES, FR, IE, LT, LU, PL, RO, SE, SK). However, those most in need of up-skilling are barely participating in continued learning at all. Non-formal learning for early school leavers is almost non-existent and adult participation in lifelong learning is negligible amongst the low-skilled or unemployed. The lack of lifelong learning creates a low skills trap for the seventy million adults without upper secondary education attainment that are most in need of up-skilling.
November 2014 | 11 Summary of the main indicators used in the Education and Training Monitor 2014
2010 Current *
EU average EU average performance Top performance Bottom
The case for education
Education investment
As a percentage of GDP 5.5 09 5.3 7.9 3.0
Year on year change at constant
prices 1.7 09 -1.1 6.2 -26.8
Employment rate of recent graduates
ISCED 3-4 72.1 69.5 90.8 29.7
ISCED 5-6 82.7 80.9 94.1 45.4
ISCED 3-6 77.4 75.5 92.2 40.0
Qualifications and competences: a key outcome of education
Share of adults with lower secondary education at most 27.3 24.8 6.6 60.2
Early leavers from education and training 13.9 12.0 3.9 23.6
Tertiary education attainment 33.6 36.9 52.6 22.4
Students' low achievement in basic competences
Reading 19.7 09 17.8 9.1 39.4
Maths 22.3 09 22.1 10.5 43.8
Science 17.8 09 16.6 5.0 38.0
Adults' low achievement in basic competences
Literacy : 19.9 10.6 27.7
Numeracy : 23.6 12.8 31.7
Digital competences
Share of adults with low ability to solve problems in a
technology-rich environment : 26.9 19.1 38.0
Entrepreneurship competences
Share of adults feeling capable to
start a business 45.8 42.3 52.0 29.0
Share of 15-year-olds with low
achievement in problem solving : 20.6 14.3 56.7
Foreign language competences
Share of ISCED 2 students learning 2 or more foreign
languages 60.6 64.8 100.0 6.0
Education policy levers for building growth
Early childhood education and care (ECEC) 92.1 09 93.9 100.0 71.7
Teaching profession
Perception of the profession being
valued : 18.5 58.6 4.0
Share of teachers in continued
professional development : 84.6 96.8 73.3
Share of teachers aged 50 and
over : : 14.8 61.9
New technologies
Use of ICT for projects or class
work : 33.6 73.9 18.2
Teachers' participation in ICT
training : 25.0 74.0 1.0
Share of ISCED 3 students in vocational education and
training (VET) 50.1 09 50.4 75.3 11.8
Lifelong learning
Early leavers from formal education currently in non-formal
learning 0.9 0.9 3.4 0.0
Adult participation in lifelong
learning 9.1 10.5 31.4 1.7
Sources: Eurostat (LFS, UOE); OECD (PISA, PIAAC, TALIS). Notes: * Current refers to the latest available data, which dates
12 | November 2014
1. The case for education
Education and training equip citizens with skills that fuel productivity and drive innovation, and play a crucial role in counteracting the negative effects of social disadvantage. However, as Part 1 of the Monitor will show, education is not used to its fullest potential. Public expenditure on education has been reduced in many countries through consolidation measures, the graduate employment rate is still too low and education and training systems could be used more effectively to counter inequalities. Now that the EU is slowly moving out of its worst economic and financial crisis1, there is a compelling case to be made for improving education to generate
smart, sustainable and inclusive growth.
The case for education can be made from many different perspectives. Personal fulfilment, civic participation and social cohesion are but a few of the wider impacts of education and training. A more socio-economic case for education is no less compelling – and illustrates how education and training have a vital role to play in stimulating economic development and in tackling unemployment, poverty and social exclusion. A recent report from the European Expert Network on Economics of Education (EENEE) summarises the theoretical and empirical evidence on how education affects economic prosperity both from an individual and a societal perspective2.
Across the EU, people with at most lower secondary education have a risk of poverty or social exclusion that is more than three times higher than the risk for those with higher education attainment3. Both
current wages4 and lifetime earnings5 increase with higher
qualifications and competences. This, in turn, echoes into macroeconomic development and societal prosperity, as the quality of human capital translates into stronger employment, productivity, innovation and competitiveness6.
It is clear that Europe cannot build growth without education. But it is not only the economic downturn since 2008 that puts pressure on Member States to prioritise education and training. Drastic demographic change is hitting European societies just when the first signs of economic recovery are emerging.
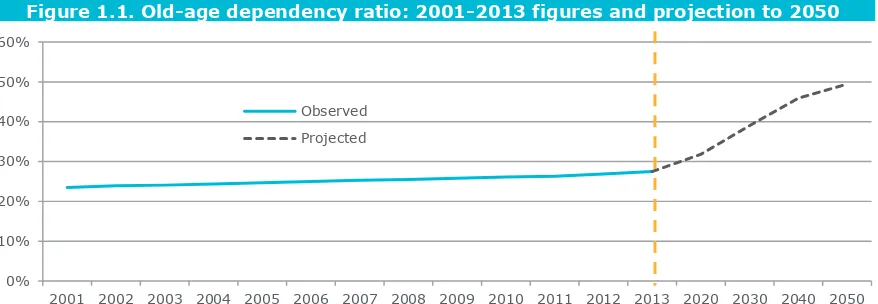
The share of young people in society will keep decreasing rapidly in the next couple of decades while the share of those aged 65 and over will increase significantly. The old-age dependency ratio7 has increased by 17% since
2001 and will have increased a further 80% by 2050, at which point the 2001 dependency-ratio will have doubled (Figure 1.1). This means that the productivity levels of the working-age population need to be strengthened considerably if social security systems are to be sustained. Europe cannot afford to have an untapped pool of talent -resulting from poorly performing systems of initial education and training and of lifelong learning.
1 See the overarching Communication Building Growth that accompanied the Commission's proposals
for country-specific recommendations as part of the 2014 European Semester (COM (2014) 400).
2 EENEE (2014), The economic case for education (http://www.eenee.de).
3 Looking at the Europe 2020 headline target on poverty and social inclusion for 18 to 64 year-olds
only, the 2012 risk is 25.1% overall; 41.6% for those without upper secondary education attainment and 12.8% for those with tertiary education attainment (Eurostat online data code:
ilc_peps04).
4 See Section 2.3 featuring findings from the Survey of Adult Skills (PIAAC). 5 See OECD (2014), Education at a Glance (http://www.oecd.org/edu/eag.htm).
6 From the vast literature on the public returns to education investment, the EENEE report singles
out a regression of real GDP growth over 1960-2009 on average educational achievement scores, revealing a strong association between the two. Similarly, tackling low student achievement could boost Member States' future GDP in unprecedented ways. See also EENEE (2010), The Cost of Low Educational Achievement in the European Union (http://www.eenee.de).
7 This indicator is defined as the number of persons aged 65 and over expressed as a percentage of
the number of persons aged between 15 and 64.
Education
contributes to
productivity,
innovation and
competitiveness
Europe
November 2014 | 13 Building growth through education and training therefore means that equity and inclusiveness will have to be improved, and this implies offering targeted support to the students showing weaker performance. No potential learner should be left behind. In the years to come, it will be all the more important for learners in initial education and training to maximise their full potential and for the working-age population to be facilitated in their up-skilling and re-skilling.
Figure 1.1. Old-age dependency ratio: 2001-2013 figures and projection to 2050
Eurostat (online data code: demo_pjanind and tsdde511). This indicator is defined as the number of persons aged 65 and over expressed as a percentage of the number of persons aged between 15 and 64.
Part 1 of the Education and Training Monitor sets the scene for subsequent discussions on learning outcomes and policy levers. Section 1.2 and 1.3 deal with some of the most prominent reasons why Member States should invest in their education and training systems from a socio-economic perspective. These are graduate employment (1.2) and equity and inclusiveness (1.3). But first it is necessary to have a closer look at the education investment itself.
1.1. Investing in education and training
Increasing education budgets does not automatically lead to improved education outcomes. The way the resources are used8 and the mechanisms for doing so9 matter. However, it is also
clear that strong performance cannot be expected if a minimum of resources is devoted to education and training.
To reap the benefits of education, Member States have both to secure the necessary resources to invest and make sure that education and training systems work effectively and efficiently. The latter often requires reforms, in line with the country-specific recommendations (CSRs)10,
focused on the policy levers that can help build growth or, in other words, transform investments into stronger outcomes and impact. This is the focus of Part 3 of the Monitor. The former requires an assessment of current expenditure on education, which is the focus of this section.
Investing in education and training plays a key role in the present economic and demographic context, as underinvestment in human capital risks undermining Europe's prospect for sustainable and inclusive growth. The need for consolidating public budgets must be combined with the stimulation of growth-enhancing policies, such as education and training, as the
8 For the contribution of various expenses to the level of education investment, see indicator B7 in
OECD (2014), Education at a Glance 2014 (http://www.oecd.org/edu/eag.htm).
9 For an overview of the different funding arrangements across Member States, see EACEA/Eurydice
(2014), Financing schools in Europe: Mechanisms, methods and criteria in public funding
(http://eacea.ec.europa.eu/education/eurydice).
10 The CSRs, referred to throughout the Education and Training Monitor, were adopted by the Council
on 8 July 2014 and can be found at: http://ec.europa.eu/europe2020/making-it-happen/country-specific-recommendations/index_en.htm.
0% 10% 20% 30% 40% 50% 60%
2001 2002 2003 2004 2005 2006 2007 2008 2009 2010 2011 2012 2013 2020 2030 2040 2050 Observed
14 | November 2014
Commission has highlighted in the Annual Growth Survey 201411 and the overarching
Communication accompanying the proposals for CSRs within the 2014 European Semester12.
[image:16.595.80.523.239.553.2]The Commission has called on Member States repeatedly to pursue structural reforms and protect investments in growth-friendly policies, such as education. In spite of these recommendations, many Member States have cut public spending for education in recent years. Within the 2014 European Semester, seven countries received CSRs to prioritise growth-enhancing expenditure in general (CZ, DK, FI, HR, PL, PT and SE) and three were asked specifically to pay attention to their education investment (DE, NL, IT).
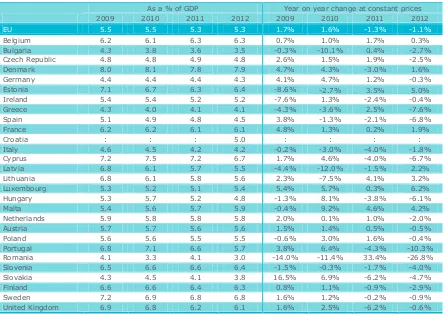
Table 1.1.1. General government expenditure on education
As a % of GDP Year on year change at constant prices
2009 2010 2011 2012 2009 2010 2011 2012
EU 5.5 5.5 5.3 5.3 1.7% 1.6% -1.3% -1.1%
Belgium 6.2 6.1 6.3 6.3 0.7% 1.0% 1.7% 0.3%
Bulgaria 4.3 3.8 3.6 3.5 -0.3% -10.1% 0.4% -2.7%
Czech Republic 4.8 4.8 4.9 4.8 2.6% 1.5% 1.9% -2.5%
Denmark 8.0 8.1 7.8 7.9 4.7% 4.3% -3.0% 1.6%
Germany 4.4 4.4 4.4 4.3 4.1% 4.7% 1.2% -0.3%
Estonia 7.1 6.7 6.3 6.4 -8.6% -2.7% 3.5% 5.0%
Ireland 5.4 5.4 5.2 5.2 -7.6% 1.3% -2.4% -0.4%
Greece 4.3 4.0 4.1 4.1 -4.3% -3.6% 2.5% -7.6%
Spain 5.1 4.9 4.8 4.5 3.8% -1.3% -2.1% -6.8%
France 6.2 6.2 6.1 6.1 4.8% 1.3% 0.2% 1.9%
Croatia : : : 5.0 : : : :
Italy 4.6 4.5 4.2 4.2 -0.2% -3.0% -4.0% -1.8%
Cyprus 7.2 7.5 7.2 6.7 1.7% 4.6% -4.0% -6.7%
Latvia 6.8 6.1 5.7 5.5 -4.4% -12.0% -1.5% 2.2%
Lithuania 6.8 6.1 5.8 5.6 2.3% -7.5% 4.1% 3.2%
Luxembourg 5.3 5.2 5.1 5.4 5.4% 5.7% 0.3% 6.2%
Hungary 5.3 5.7 5.2 4.8 -1.3% 8.1% -3.8% -6.1%
Malta 5.4 5.6 5.7 5.9 -0.4% 9.2% 4.6% 4.2%
Netherlands 5.9 5.8 5.8 5.8 2.0% 0.1% 1.0% -2.0%
Austria 5.7 5.7 5.6 5.6 1.5% 1.4% 0.5% -0.5%
Poland 5.6 5.6 5.5 5.5 -0.6% 3.0% 1.6% -0.4%
Portugal 6.8 7.1 6.6 5.7 3.8% 6.4% -4.3% -10.3%
Romania 4.1 3.3 4.1 3.0 -14.0% -11.4% 33.4% -26.8%
Slovenia 6.5 6.6 6.6 6.4 -1.5% -0.3% -1.7% -4.0%
Slovakia 4.3 4.5 4.1 3.8 16.5% 6.9% -6.2% -4.7%
Finland 6.6 6.6 6.4 6.3 0.8% 1.1% -0.9% -2.9%
Sweden 7.2 6.9 6.8 6.8 1.6% 1.2% -0.2% -0.9%
United Kingdom 6.9 6.8 6.2 6.1 1.6% 2.5% -6.2% -0.6%
Source: DG EAC calculations based on Eurostat's general government finance statistics (online data codes: gov_a_exp and
nama_gdp_p). Notes: EU refers to EU 27.
Current state of play
The level of spending on education and training varies significantly from country to country (Table 1.1.1). In twelve Member States it broadly fluctuates around the EU average of 5.3% of GDP13. But in BG, DE, EL, ES, IT, RO and SK it is 4.5% or less, whereas in nine Member States
(BE, DK, EE, FR, CY, SI, FI, SE, UK) it is 6% or more.
11 COM (2013) 800.
12 COM (2014) 400.
13 An alternative measure of investment is the education expenditure as a percentage of general
November 2014 | 15 When measured as the share of GDP devoted to education, 2012 government expenditure remained at the same level of the previous year; 5.3% of GDP, in a year when GDP itself shrunk by 0.4%. When measuring education expenditure at constant prices14, recent data reveal a
[image:17.595.82.511.189.564.2]decrease in 2011 and in 2012 in real terms, both at the EU average and in the majority of Member States. In 2012, government expenditure on education dropped by 1.1%. This was the second consecutive year of contraction, as expenditure fell already in 2011 by 1.3%15.
Figure 1.1.1. Change in expenditure by level of education (2008-2012)
Source: DG EAC calculations based on Eurostat's general government finance statistics (online data codes: gov_a_exp and
nama_gdp_p). Data not available for BE, ES, HR, SK. Secondary education also covers post-secondary non-tertiary.
Nineteen Members States recorded a cut in real terms in 2012; in six of them (EL, ES, CY, HU, PT, RO) by more than 5%. It was the third consecutive year of
14 The change over time of the expenditure as a share of GDP could be misleading, as it incorporates
the dynamics of GDP itself and of the costs of education (such as teacher wages, paper, computers, books and all the other goods and services needed as input by the education system). Current price data are deflated using the price index for final consumption of the general government. This index is also used in national accounts to evaluate at constant prices the general government aggregates (such as consumption, value added, general government share in GDP, etc.).
15 For preliminary evidence of 2013 budgets, see EACEA/Eurydice (2013), National Sheets on
Education Budgets in Europe (http://eacea.ec.europa.eu/education/eurydice). -40%
-30% -20% -10% 0% 10% 20% 30% 40% 50%
BG CZ DK DE EE IE EL FR IT CY LV LT LU HU MT NL AT PL PT RO SI FI SE UK
-40% -30% -20% -10% 0% 10% 20% 30% 40% 50%
BG CZ DK DE EE IE EL FR IT CY LV LT LU HU MT NL AT PL PT RO SI FI SE UK
-40% -30% -20% -10% 0% 10% 20% 30% 40% 50%
BG CZ DK DE EE IE EL FR IT CY LV LT LU HU MT NL AT PL PT RO SI FI SE UK
Pre-primary and primary education
Secondary education
Tertiary education
In 2012, nineteen Member States cut their
investment; by more than 5% in Greece, Spain,
Cyprus, Hungary, Portugal and Romania
16 | November 2014
decline in ES, IT and SI, and the second consecutive one in IE, CY, HU, PT, SK, FI, SE and UK. Some Member States combine an already relatively low level of public expenditure for education (of less than 4% of GDP) with a further decrease (RO, BG, SK).
Figure 1.1.1 shows the change at constant prices16 in general government expenditure on
education by level of education, over the same time span analysed year by year in Table 1.1.1 (i.e. between 2008 and 2012). This reveals investment decreases in real terms for primary and pre-primary education in thirteen Member States (BG, EE, IE, EL, IT, LV, LT, HU, NL, PT, RO, SI, UK); for secondary education in fifteen Member States (BG, CZ, DE, EE, IE, EL, IT, LV, LT, MT, PT, RO, SI, FI, SE); and for higher education in ten Member States (BG, CZ, EL, IT, CY, LV, AT, PT, RO, UK).
[image:18.595.79.519.328.638.2]This means that, with exception of DK, FR, LU and PL, all the Member States with available data saw a decrease in education expenditure for at least one level of education, while six Member States cut expenditure at all three levels (BG, EL, IT, LV, PT, RO)17.
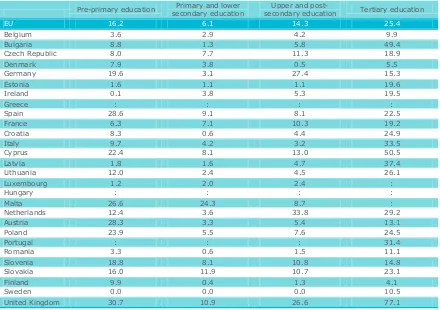
Table 1.1.2. Share of private expenditure on education institutions (2011)
Pre-primary education secondary education Primary and lower secondary education Upper and post- Tertiary education
EU 16.2 6.1 14.3 25.4
Belgium 3.6 2.9 4.2 9.9
Bulgaria 8.8 1.3 5.8 49.4
Czech Republic 8.0 7.7 11.3 18.9
Denmark 7.9 3.8 0.5 5.5
Germany 19.6 3.1 27.4 15.3
Estonia 1.6 1.1 1.1 19.6
Ireland 0.1 3.8 5.3 19.5
Greece : : : :
Spain 28.6 9.1 8.1 22.5
France 6.3 7.1 10.3 19.2
Croatia 8.3 0.6 4.4 24.9
Italy 9.7 4.2 3.2 33.5
Cyprus 22.4 8.1 13.0 50.5
Latvia 1.8 1.6 4.7 37.4
Lithuania 12.0 2.4 4.5 26.1
Luxembourg 1.2 2.0 2.4 :
Hungary : : : :
Malta 26.6 24.3 8.7 :
Netherlands 12.4 3.6 33.8 29.2
Austria 28.3 3.3 5.4 13.1
Poland 23.9 5.5 7.6 24.5
Portugal : : : 31.4
Romania 3.3 0.6 1.5 11.1
Slovenia 18.8 8.1 10.8 14.8
Slovakia 16.0 11.9 10.7 23.1
Finland 9.9 0.4 1.3 4.1
Sweden 0.0 0.0 0.0 10.5
United Kingdom 30.7 10.9 26.6 77.1
Source: Eurostat (UOE) based on a July 2014 extraction. Note: the Table depicts the private expenditure as a percentage of the total expenditure on education institutions. EU estimate based on available data.
16 Data are deflated using the same price index as in Table 1.1.1 (the price index for final
consumption of the general government).
17 For a more comprehensive analysis of expenditure by level of education, taking into account
demographic changes and the lagged effects of education investment, see: JRC-CRELL (2013),
Public financing of education in EU countries: A cross-country systematic analysis
(https://crell.jrc.ec.europa.eu/).
Between 2008 and 2012, six
Members states saw a
November 2014 | 17
Private spending on education and student support
Some of the funding of education lies with the private domain. On average, for all Member States with data available and all levels of education combined, 13.3% of spending on education institutions is from private sources. As can be seen in Table 1.1.2, private spending seems particularly rare in primary and lower secondary education18 and particularly prevalent in
tertiary education19. The UK is an outlier, with over 77% of
spending on higher education coming from private sources, but CY, BG and LV also show private expenditure on tertiary education that is more than ten percentage points higher than the EU average of 25.4%.
Figure 1.1.2 illustrates the Harmonised Indices of Consumer Prices (HICPs), which are designed for international comparisons of consumer price inflation. Using 2005 as an index reference period, it is clear that prices charged to households for education have increased significantly more than the overall price development observed across Europe. Moreover, whereas overall HICP inflation has been on a downward trend for several quarters and is expected to remain low for some time20, consumer prices of education keep increasing at a higher pace21.
Figure 1.1.2. Development of consumer price of education (EU28)
Source: Eurostat (online data code: prc_hicp_aind).
This development raises equity concerns, particularly when private fees are not met with student support in the form of grants and loans for those less able to pay22. The latest data23
18 As Section 1.3 will show, however, the data does not capture the widespread private tutoring in
compulsory education.
19 For the effects of this shift in higher education, see a 2014 study undertaken at the request of the
Commission titled Do changes in cost-sharing have an impact on the behaviour of students and higher education institutions? (http://ec.europa.eu/education/library/study/2014/cost-sharing/comparative-report_en.pdf).
20 European Commission (2014), European Economic Forecast: Spring 2014
(http://ec.europa.eu/economy_finance/eu/forecasts/index_en.htm).
21 The EU development is driven in particular by high increases in prices on education in the UK, LV,
BG and RO. Other countries, such as HR, NL and AT have had relatively stable prices over the period.
22 Evidence shows, however, that unless the magnitude of change is exceptionally large, rises in fees
seemingly have no detectable negative effect on aggregate demand and enrolment. See European Commission (2014), Do changes in cost-sharing have an impact on the behaviour of students and higher education institutions? (http://ec.europa.eu/education/library/study/2014/cost-sharing/comparative-report_en.pdf).
23 EACEA/Eurydice (2014), National student fee and support systems
(http://eacea.ec.europa.eu/education/eurydice/). 100
105 110 115 120 125 130 135 140 145
2005 2006 2007 2008 2009 2010 2011 2012 2013
Consumer price index - education Consumer price index - all items
18 | November 2014
show a wide variation in levels of fees and points to very different higher education funding policies being applied across Europe. A significant number of countries – including the Nordic countries, DE and AT – apply a no fee regime for all students from the EU or EEA. At the other end of the scale, the highest maximum fees are recorded in IE, LT, HU, SI and UK.
A large proportion of student support takes the form of grants. Two main forms of grants can be identified – those awarded on the basis of financial need, and those awarded for academic merit. The countries that provide students with the highest amounts of need-based grants are BE nl, DK, IE, ES, IT, AT, PT, FI and UK-WLS. Merit-based grants appear less often in the higher education systems, and a combination of both need and merit-based criteria for grants is present in some systems such as BE nl, EL and IT.
Key findings and policy relevance
Strong education performance cannot be expected without sufficient resources and reforms to ensure their effectiveness. Yet nineteen Member States cut their education expenditure in 2012. Six Member States decreased investments by more than 5% (EL, ES, CY, HU, PT, RO). Some of the countries that devote relatively few resources to education have decreased their investment further (BG, RO, SK). Since 2008, six countries saw a decrease in expenditure across all levels of education (BG, EL, IT, LV, PT, RO). Underinvestment in human capital risks undermining Europe's prospect for sustainable and inclusive growth. Reforms will be required to make sure that education and training systems work effectively and efficiently.
1.2. Raising employment rates of young graduates
A prime reason for investing in education and training is to ensure that all learners are equipped with the skills to participate in society and – crucially – on the labour market. Youth unemployment, however, has become one of the biggest challenges facing Europe today. About 5.5 million young people in the EU are unemployed24. The youth unemployment rate is more
than twice as high as the rate for adults25 and has dramatically increased, topping 50% in
countries such as EL, HR and ES. In total, more than 7.5 million people in the 15-24 age group are neither in employment, nor in education and training (NEETs) and their share in the total population is rising: in 2013, 13.0% of youth were NEETs, 2.2 percentage points more than five years earlier26.
The Council adopted a Recommendation on establishing a Youth Guarantee in April 201327,
which calls on Member States to ensure that all young people under 25 receive a good quality offer of employment, continued education, an apprenticeship or a traineeship28 within four
months of leaving formal education or becoming unemployed. The Youth Guarantee is a new approach to tackling the problem of young unemployment and of the smooth transition from education to work, which gives young people a real opportunity to increase their employability with a view to sustainable labour market integration, thus boosting overall youth employment rates.
24 Eurostat 2014 Q1 data for 15 to 24 year-olds (online data code: une_nb_q). 25 22% against 9%. Eurostat 2014 Q2 data (online data code: une_rt_q).
26 The highest NEET rates – close to or above 20% of the population in the age group between 15 and
24 – are recorded in BG, IT, ES, CY, HR and EL. Eurostat online data code: edat_lfse_20.
27 The Youth Employment Initiative (YEI) will support NEETs in regions hit particularly hard by youth
unemployment. A budget of €6 billion for the period 2014-2020 will be made available for EU countries for measures to support youth employment and the integration of young people in the labour market, including through the implementation of Youth Guarantee schemes in eligible regions. The YEI complements other projects undertaken at national level, including those with European Social Fund (ESF) support, to combat youth unemployment.
November 2014 | 19 Although education and training cannot compensate for the economic downturn, it can play a key role in the prevention of youth unemployment29. But for that purpose, the focus on
employability has to be strengthened within education institutions. The Council has set an ET 2020 benchmark on the employment rate of young recent graduates30 stating that, by 2020, at
least 82% of 20 to 34 year-olds, graduated within the preceding three years and now no longer in education or training, should be in employment. The target level is equal to the rate recorded in 2008, the year the financial crisis erupted.
Current state of play
In 2013, the employment rate of recent graduates (using the broad definition of the term graduates as used by the ET 2020 benchmark) did not improve in the EU. It stagnated at 75.5%, which is 0.5 percentage points less than in 2012, but 6.5 percentage points less than in 2008. This development reflects the sluggish economic situation, with EU GDP having grown by only 0.1% in 2013, and is the combined effect of significant swings in the worst performing countries, and a relatively stable situation for the best performers.
In fact, the ten Member States with the lowest graduate employment rate in 2013 (EL, IT, HR, ES, CY, RO, BG, PT, SK, IE) are also those that experienced a drop in the graduate employment rate since 2008 greater than 10 percentage points (Figure 1.2.1). It is worthwhile noting that these countries are amongst those more seriously hit by the crisis, and seven of them recorded a negative growth of GDP in 2013.
Figure 1.2.1. Employment rate of young recent graduates
Source: Eurostat (LFS), online data code: edat_lfse_24. Employment rate of graduates (ISCED 3-6) aged 20-34 who
graduated 1 to 3 years before the reference year and who are not currently enrolled in any further formal or non-formal education or training.
At the same time, the top ten performers (LU, FI, CZ, DK, UK, SE, NL, DE, AT, MT) behaved in more stable way. Their decline, compared to 2008, is much less pronounced – in FI, AT, SE and MT it is less than 4 percentage points; in DE and UK graduate employment even increased and in the other countries the drop has been between 4 and 9 percentage points. Moreover, six of these countries (MT, AT, DE, NL, SE, UK) are already above the European benchmark set for 2020 – though this does not guarantee that it will be the case in 2020, given the strong dependence of the indicator on the economic situation.
29 In addition, continued learning plays a key role in tackling existing unemployment, in particular
among low-skilled or low-qualified persons (see Section 3.6).
30 Although the term graduate is usually associated only with tertiary education, the benchmark also
covers upper secondary and post-secondary non-tertiary education. This means that throughout the Monitor, a broader definition of the term graduate is used.
0% 10% 20% 30% 40% 50% 60% 70% 80% 90% 100%
EL IT HR ES CY RO BG PT SK IE PL SI HU EU LT EE FR LV BE LU FI CZ DK UK SE NL DE AT MT
2013 2008
20 | November 2014
[image:22.595.79.518.216.545.2]In 2013, men continued to record a higher employment rate than women amongst recent graduates, and the gap between the two groups, at the EU level, is greater than 4 percentage points. The gender gap varies considerably from country to country: in four Member States (BE, BG, IE, LT) women record a higher employment rate than men. In four Member States (HR, CY, FI, SE), the gap is very small, i.e. less than one percentage point. In all the other countries there is a noticeable advantage for men, and in three Member States (CZ, EE, SI) the gap is greater than 10 percentage points (Table 1.2.1).
Table 1.2.1. Employment rates of recent graduates by sex and country of birth (%)
2008 2013
Total Total Men Women Native-born Foreign-born EU Non-EU Sub-total
EU 82.0 75.5 77.7 73.4 75.6 79.3 65.5 70.2
Belgium 83.9 79.1 79.0 79.1 79.8 80.6 67.5 74.1
Bulgaria 79.6 67.7 66.2 69.1 67.7 : : :
Czech Republic 87.9 80.4 87.5 73.1 80.4 (75.8) (84.9) (79.9)
Denmark 90.6 81.9 85.3 78.2 82.7 (82.1) 71.7 74.8
Germany 86.5 89.7 91.2 88.1 90.5 : : :
Estonia 82.3 76.8 82.5 69.7 76.4 (78.5) (100.0) 87.7
Ireland 85.7 73.0 72.9 73.1 73.2 72.8 70.3 72.0
Greece 68.3 40.0 42.7 37.9 40.8 : (22.3) (23.1)
Spain 82.1 59.9 60.4 59.4 60.4 (55.8) 53.9 54.2
France 83.3 76.9 78.7 75.0 76.9 95.1 69.5 76.6
Croatia 77.8 53.8 53.9 53.7 54.2 : (49.3) (49.0)
Italy 65.2 48.3 49.4 47.4 49.1 44.8 39.2 40.9
Cyprus 85.8 62.1 62.6 61.7 61.5 73.1 54.1 65.5
Latvia 83.1 78.2 82.6 74.6 78.1 : (75.3) 81.7
Lithuania 79.3 75.5 74.2 76.9 75.4 : : :
Luxembourg 86.9 79.1 79.7 78.4 79.8 77.3 80.9 78.3
Hungary 80.1 74.7 77.7 72.1 74.7 : : :
Malta 95.7 92.2 93.2 91.1 92.5 (81.5) 91.0 88.2
Netherlands 93.6 87.1 87.8 86.4 88.6 (83.3) 66.0 70.2
Austria 90.6 90.2 91.8 88.4 91.3 84.6 82.2 83.5
Poland 79.3 73.2 77.9 68.8 73.1 : : :
Portugal 82.8 67.8 69.2 66.6 68.0 : 63.2 65.3
Romania 84.8 66.8 69.0 64.9 66.8 : : :
Slovenia 83.4 73.8 79.3 68.1 74.6 : (56.3) (52.5)
Slovakia 81.4 70.3 73.1 68.0 70.1 : : :
Finland 82.3 79.8 80.0 79.5 79.6 (78.0) (93.4) 85.0
Sweden 85.7 84.9 85.2 84.5 85.4 80.0 81.3 81.0
United Kingdom 83.6 83.8 84.5 83.2 84.2 91.8 75.6 81.5
Source: Eurostat (LFS), online data code: edat_lfse_32. Employment rate of graduates (ISCED 3-6) aged 20-34 who
graduated 1 to 3 years before the reference year and who are not currently enrolled in any further formal or non-formal education or training. Notes: "()" = Data lack reliability due to small sample size; ":" = data either not available or not reliable due to very small sample size.
Graduate employment rates versus overall employment rates
Figure 1.2.2 compares the employment rate of graduates aged 20-34 with the overall employment rate of individuals aged 20-64 with comparable levels of education attainment. The latter here illustrates the rigidity of the labour market, which means that a negative difference between the two indicators points at a labour market rigidity that is disproportionately affecting new entrants31.
In MT, AT and DE the difference is close to 10 percentage points. These countries are also among those in which recent graduates can find a job more easily. On the other hand, IT, EL, CY, ES, HR, PT, BG and RO record a negative difference – in these countries, recent graduates
31 It also points at the need to raise the employability of graduates, through strengthening the quality
November 2014 | 21 have more difficulties in getting a job than 20 to 64 year-olds with comparable qualifications. This is in part the effect of the economic development, which has hit hard on young recent graduates32.
Figure 1.2.2. Graduate employment rate and overall employment rate (2013)
Source: Eurostat (LFS) based on an October 2014 extraction. The Figure shows the difference between the employment
rate of graduates (ISCED 3-6) aged 20-34 who graduated 1 to 3 years before the reference year and who are not currently enrolled in any further formal or non-formal education or training and the employment rate of individuals aged 20-64 with at least upper secondary education attainment (ISCED 3-6).
Graduate employment rates by level and field of education
As can be seen in Figure 1.2.3, the level of education attained still plays a key role for graduate employment. Young recent graduates with tertiary education record a higher level of employment in all the Member States, compared to their peers with upper secondary and post-secondary non tertiary education. This gap is in general bigger where the employment of young recent graduates is lower overall. On average across the EU, the employment rate of recent graduates from higher education is 80.9% whereas the employment rate of those with upper secondary education attainment is 69.5%.
Figure 1.2.3. Graduate employment rates by level of education (2013)
Source: Eurostat (LFS). Online data code: edat_lfse_24. Countries are ranked in ascending order by the total employment
rate of recent graduates (ISCED 3-6), i.e. the ET 2020 benchmark performance.
Broad skill demand and supply trends based on Cedefop data confirm that there are more low-educated workers in the EU than there are jobs requiring that level of qualifications33. However,
32 Comparable findings can be made when looking at labour turnover, measured by the overall share
of newly employed. See the additional contextual indicators at: ec.europa.eu/education/monitor.
33 Cedefop (2014), Skills mismatch: more than meets the eye
(http://www.cedefop.europa.eu/EN/publications/22524.aspx). -20%
-15% -10% -5% 0% 5% 10% 15%
MT AT DE HU LU IE LV UK NL PL CZ BE LT FI SI FR SE SK EU EE DK RO BG PT HR ES CY EL IT
20% 30% 40% 50% 60% 70% 80% 90% 100%
EL IT HR ES CY RO BG PT SK IE PL SI HU EU LT EE FR LV BE LU FI CZ DK UK SE NL DE AT MT
More overall employment than graduate employment
More graduate employment than overall employment
ISCED 3-6
ISCED 3-4
22 | November 2014
evidence also shows that within the group of graduates from upper secondary education, graduates from vocational education and training (VET) programmes have better employment prospects, particularly in countries where work-based learning is a strong component of VET programmes (see Section 3.5)34.
The employment prospects of young recent graduates differ not only by level of education but also by the field of study. Studies in science, engineering or health lead, in general, to better job opportunities than studies in humanities, social sciences, business or law35, but there are striking exceptions
throughout Member States.
In FI and SK, for instance, regardless of the education level, studies in the humanities and social sciences register better employment rates than those in science, engineering or health. This is also the case, as far as tertiary education is concerned, for BG, LU, LT, NL and MT; and in EL, PT and CZ for upper secondary and post-secondary non-tertiary education. This variation in graduate employment by field of study is partly due to differences in the structure of the labour market and the nature of a Member State's competitive industries36. It also hints at
country efforts to strengthen graduate employability (see Sections 3.4 and 3.5).
Occupational mismatch
The first job that young graduates take up may not match their expectations and qualifications. On average, 25% of employed young people with a tertiary degree have jobs that would not traditionally require this level of qualification (Figure 1.2.4)37.
Comparing this measure of occupational mismatch with overall graduate employment rates singles out EL, IT, ES or CY – which combine low levels of graduate employment with a high share of over-qualified employees. In contrast, MT, DE, DK and NL combine a good performance as far as graduate employment is concerned with low levels of over-qualification38.
The OECD's Survey on Adult Skills (see Section 2.3) can be used for a measure of occupational mismatch that looks at the competences behind the qualifications39. A recent report from
JRC-CRELL shows that occupational mismatch by competences and occupational mismatch by qualifications are substantially different40. The report also shows that the share of people with a
job matching their qualifications and competences is higher amongst those with a tertiary education, and that well-developed vocational education and training (VET) systems alleviate the mismatch.
34 Cedefop (2012), From education to working life: the labour market outcomes of vocational
education and training (http://www.cedefop.europa.eu/EN/publications/21556.aspx).
35 The gap is more acute for graduates with upper secondary and post-secondary non-tertiary
education, and less evident for those with tertiary education.
36 European Commission (2014), Employment and social developments in Europe 2013
(ec.europa.eu/social/publications).
37 For a more comprehensive measure of occupational mismatch by qualifications using the same LFS
data, see page 72-77 of ECB (2012), Euro area labour markets and the crisis: Occasional paper series No 138 (http://www.ecb.europa.eu/pub/pdf/scpops/ecbocp138.pdf). Moreover, since the correlation between ISCED and ISCO levels is not very strong, the Commission is involved in setting up a multilingual classification of European Skills, Competences, Qualifications and Occupations (ESCO), as part of the Europe 2020 strategy. The ESCO classification identifies and categorises skills, competences, qualifications and occupations relevant for the EU labour market and education and training. For more information, see: https://ec.europa.eu/esco/home.
38 See the additional contextual indicators at: ec.europa.eu/education/monitor.
39 See, for instance, page 228-234 of OECD (2014), Employment Outlook 2014
(http://www.oecd.org/els/emp/oecdemploymentoutlook.htm).
40 JRC-CRELL (2014), Occupational mismatch in Europe: understanding overeducation and
overskilling for policy making (https://crell.jrc.ec.europa.eu/).
One in four
employed tertiary
education
graduates has a
job below his or
her level of
qualification
The labour market
November 2014 | 23 The Commission is promoting an EU-level approach in the field of skills intelligence with a number of tools. To support better matching of skills supply and demand, in December 2012 the Commission launched the EU Skills Panorama41. The portal aims to offer a single access point
for data, information and intelligence on trends for skills and jobs across Europe. The EU Skills
Panorama also aims to consistently contribute to skills intelligence by anticipating skills needs
and improving the responsiveness of education and training systems.
Figure 1.2.4. Employed tertiary education graduates overqualified for their job (2013)
Source: Eurostat (LFS) based on an April 2014 extraction. Note: the Figure denotes 20 to 34 year-olds with tertiary
education attainment that have a job in ISCO 4-9 (sales, services, agriculture, production), i.e. not as legislator, senior official, manager, professional (ISCO1-2), nor as technician or associated professional (ISCO3).
Furthermore, the Commission has monitored during the last four years labour demand through the regular publication of the European Vacancy Monitor, providing a comprehensive overview of trends in demand on the European job market42. In this context, the Commission also
supports the setting up of European Sector Skills Councils and Sector Skills Alliances, designed to improve joint responses to changes in the need for skills in specific sectors.
Key findings and policy relevance
The focus on employability has to be strengthened within education institutions. Youth unemployment remains rampant across Europe and the employment rate of recent graduates stagnated at 75.5% in 2013. VET graduates have better employment prospects in countries where work-based learning is a strong component of VET programmes and higher education graduates are still about 11 percentage points more likely to be employed than those with upper secondary education attainment. But occupation mismatches by qualifications and competences demand that education and training systems become more sensitive to the needs of the modern labour market.
1.3. Tackling inequalities
43Investment in education is an important element in building growth. However, issues of equity and inclusiveness also need to be addressed with the purpose of distributing the benefits of education more equitably across society. Unless inequalities and discriminations are tackled,
41 See http://euskillspanorama.cedefop.europa.eu/. 42 See http://ec.europa.eu/social/main.jsp?catId=955.
43 This section is based on a contribution from the Network of Experts on Social Aspects of Education
and Training (NESET). It builds on previous work of the expert network, at the request of the European Commission (http://www.nesetweb.eu/).
0% 5% 10% 15% 20% 25% 30% 35% 40%