A microcontroller system for investigating the catch effect:
Functional electrical stimulation of the common peroneal nerve
D.J. Hart
a, P.N. Taylor
b,c, P.H. Chappell
a,∗, D.E. Wood
b,caElectronics and Computer Science, University of Southampton, Highfield, Southampton SO17 1BJ, UK bMedical Physics and Biomedical Engineering, Salisbury District Hospital, Salisbury, Wiltshire SP2 8BJ, UK
cAcademic Biomedical Engineering Research Group, School of Design, Engineering and Computing,
Bournemouth University, Talbot Campus, Fern Barrow, Poole, Dorset BH12 5BB, UK
Received 29 March 2004; received in revised form 1 July 2005; accepted 7 July 2005
Abstract
Correction of drop foot in hemiplegic gait is achieved by electrical stimulation of the common peroneal nerve with a series of pulses at a fixed frequency. However, during normal gait, the electromyographic signals from the tibialis anterior muscle indicate that muscle force is not constant but varies during the swing phase. The application of double pulses for the correction of drop foot may enhance the gait by generating greater torque at the ankle and thereby increase the efficiency of the stimulation with reduced fatigue. A flexible controller has been designed around the Odstock Drop Foot Stimulator to deliver different profiles of pulses implementing doublets and optimum series. A peripheral interface controller (PIC) microcontroller with some external circuits has been designed and tested to accommodate six profiles. Preliminary results of the measurements from a normal subject seated in a multi-moment chair (an isometric torque measurement device) indicate that profiles containing doublets and optimum spaced pulses look favourable for clinical use.
© 2005 IPEM. Published by Elsevier Ltd. All rights reserved.
Keywords: Neuromuscular stimulation; Catch effect; Doublets; Hemiplegia; Gait; Microcontroller; PIC; Deboo integrator
1. Introduction
A device to correct drop foot in real time was first pro-posed by Liberson et al.[1]. Surface stimulation is applied through adhesive electrodes placed above the peroneal nerve causing contraction of the tibialis anterior muscle. As first noticed by Liberson, a drop foot stimulator (DFS) can act as a recovery aid with users often experiencing consequen-tial improvements in their unaided walking[2]. A majority of surveyed users cite this as the reason when discontinuing use of a stimulator[3], although the mechanism behind this effect is unclear[4].
Drop foot is a common problem following neurological dysfunction due to stroke, multiple sclerosis or incomplete spinal cord injury. It is characterised by the inability to lift the foot while it is brought forward during the swing phase
∗Corresponding author. Tel.: +44 23 8059 3442; fax: +44 23 8059 2901. E-mail address:[email protected] (P.H. Chappell).
of gait often resulting in the foot catching the ground. This is due to the lack of activity in the ankle dorsiflexion and toe extensor muscles and also excessive activity in the calf muscle group pulling the foot into plantaflexion and inversion due to spacticity. Increasingly, functional electrical stimulation (FES) is used to correct drop foot. Electrical stimulation of the common peroneal nerve can produce dorsiflexion and eversion, which is timed to the gait cycle using a foot switch placed in the shoe under the heel. When weight is taken off the switch the stimulation is ramped up and then maintained at a constant level until heel strike occurs.Fig. 1shows the stimulation envelope of the Odstock dropped foot stimulator (ODFSIII). As a safety feature, should a heel strike signal not occur after a preset time-out, the stimulation is switched off. While this has been shown to significantly assist walking, the pattern of stimulation does not entirely match the natu-ral pattern of activity in the tibialis anterior, the muscle that produces dorsiflexion.Fig. 2shows the naturally occurring EMG activity at the beginning of the swing phase followed by
Fig. 1. Odstock Dropped Foot Stimulator timing parameters.
a reduction in mid-swing and then increasing to its maximum activity after heel strike (in this figure, the vertical axis shows the rectified and smoothed output voltage from an amplifier that has been normalised to a maximum value of 100 and is an indication of the typical pattern observed). This last burst of activity provides an eccentric contraction that lowers the foot to the ground, resisting the plantaflexion moment about the ankle joint. The effect is approximated in the ODFSIII by extending the stimulation period for a short time past heel strike but is a less than optimum solution. While a high level of stimulation is needed at heel strike, a lower level is required during the middle of the swing phase. This pattern may lead to unnecessary muscle fatigue that may ultimately limit the walking range of the stimulator user. It would therefore be desirable to mimic more closely the natural pattern of the tibialis anterior muscle.
[image:2.842.304.546.84.172.2]A typical specification for a stimulator is shown inTable 1. The Odstock single channel drop foot stimulator has been used successfully in the clinical setting for a number of years with the timing originally generated using discrete logic gates and analogue circuits. Recently, it has been redesigned to
Table 1
Specification for a ODFSIII[5]
Pulse width 3–350s
Output current 20–100 mA
Output voltage 100 V into 1 k
Rising ramp 0.5–4 s
Stimulation frequency 40 Hz
Stimulation time 0.5–6 s
Extension 0–1.6 s
Descending ramp 0.5–4 s
include experience with the older device and the control has been dedicated to a peripheral interface controller (PIC).
In contrast to the clinical device, which does not attempt to mimic the activity profile seen naturally in a healthy per-son[2]the prototype described in this paper was developed to investigate the effects of different profiles of stimulation patterns and to produce natural profiles. Of particular, inter-est is the effects of adding two pulses or ‘doublets’[6–9]and ‘optimum series’[10–12]. Increasing the stimulation inten-sity during the loading response, results in more time being spent with the body weight supported by the heel, as opposed to the toes. This positive effect has been achieved using some profile shaping[13].
A PIC solution is shown to meet and extend the desired functionality, allowing the choice of six stimulation profiles with independent and linear selection of each parameter.
With ethical approval, the response from stimulation of the common peroneal nerve in a semi-reclined human subject was tested using the multi-moment chair[14]; an apparatus that measures isometrically lower limb joint moments at the ankle, knee and hip.
2. Stimulation profiles
2.1. The natural stimulation profile and catch effect
A motor unit has a natural firing rate of 10–12 Hz, which is slow when compared to the frequency used in most
[image:2.842.137.453.547.715.2]stimulation applications (40 Hz in the ODFSIII). This higher stimulation frequency is required in order to produce a rapid and fused contraction because each stimulation pulse pro-duces a synchronous single contraction of many muscle fibres. In contrast, the natural activation of different muscle fibres is active asynchronously. However, it has been shown in natural muscle activity that at times when a greater force output is required, extra nerve pulses occur a few millisec-onds after the initial impulse. This has the effect of increasing the tension produced by muscle, even if the total number of nerve pulses is the same in any given period. This effect can also be demonstrated using electrical stimulation. When a motor unit is stimulated with a low-frequency train of pulses, the addition of an extra pulse in quick succession (doublet) can significantly increase muscle tension[6–9]. Under opti-mal conditions, the additional tension from a doublet lasts for several seconds and greatly exceeds the tension produced by a single pulse. Studies using the ‘catch effect’ have suggested a slower rate of muscle fatigue[9,10,12,15]. Rapid muscle fatigue is the fundamental imperfection of FES, hence this result would have important ramifications in the clinical set-ting. Research into the catch effect indicates many results and hypothesis’s supporting these findings[6,7,16]. As yet there appears no established explanation of this phenomenon. We therefore propose to exploit this effect to modulate the output from the anterior tibialis by adding “stimulation doublets” at heel rise and heel strike.Fig. 3shows an example of the stim-ulation waveform that may be used and roughly corresponds to the natural activity shown inFig. 2.
An aim of this research is to investigate the use of the catch effect in producing a stimulation profile, which more closely follows the natural gait[17,18].
2.2. Stimulator profiles
[image:3.842.60.281.525.707.2]To vary the intensity of the stimulation either pulse width modulation (PWM) or amplitude modulation (AM) can be
Fig. 3. Illustration of the potential stimulation pattern to mimic the natural muscle activity.
used. In order to minimise the engineering complexity of the system PWM was chosen with a constant stimulation voltage. The effect of the stimulation is largely proportional to the charge delivered to the nerve and therefore the contraction strength can be modulated by either a pulse amplitude or pulse duration. There is a threshold value of pulse amplitude below which axons will not be sufficiently depolarised; hence, not recruiting motor units. The threshold varies from subject to subject through a number of factors such as skin condition, electrode placement, tissue type and thickness.
Rather than using a linear ramp, an exponential profile Eq.(1)delivers a more gradual transition from ramping to the mid-band stimulation where the initial rate of increase in stimulation intensity grows quickly and progressively slows as the stimulation reaches its final value:
pw∝
1−exp
−t τ
(1)
where pw is the pulse width,t the time andτ is the time constant.
The typical timing specifications are used (Table 1). In profiles utilising doublets of stimulation, discreet control with a resolution of a millisecond is provided over doublet spacing, hence allowing investigation of the catch effect and force response. Research into the use of doublets suggests the catch effect being most noticeable with doublet spacing of 5–10 ms
[9], hence the doublet parameter is selectable over the range 4–11 ms.
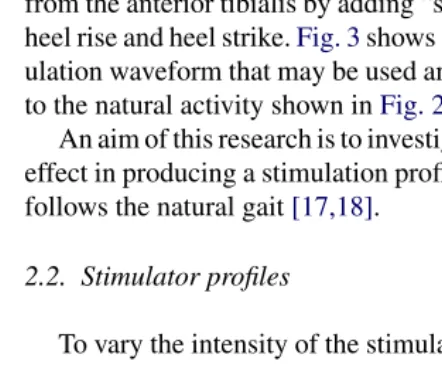
Fig. 4shows the six stimulation profiles with the following features:
1. 40 Hz: This profile mimics the ODFSIII. The only dis-tinction between the profiles being PWM rather than AM during ramping. Differences of the modified ODFSIII to observed force responses should only be due to the dif-ferent ramping methods adopted or the coupling of the stimulation signal to the output transformer.
2. 20 Hz: As profile 1, however stimulation is applied at 20 Hz rather than the typical 40 Hz used by the ODFSIII. The response gained from this profile will prove a useful comparison when testing a subject using profiles 3 and 5. 3. Doublets at 20 Hz: This profile tests the effectiveness of sustained force found when using doublets at 20 Hz and hence has the same number of pulses per second as the 40 Hz constant frequency stimulation (profile 1). Experiments using this profile will demonstrate that any differences in the torque produced is due to the use of doublets.
Fig. 4. The six stimulation profiles, dotted lines indicate ramping intensity: (1) single pulses throughout at 40 Hz; (2) single pulses throughout at 20 Hz; (3) doublets throughout; (4) a controllable duration of doublets after ramp up and at heel strike; (5) optimum spaced pulses throughout; (6) a controllable duration of optimum spaced pulses after ramp up and at heel strike.
5. Optimal: This profile tests the effectiveness of sustained force found when using a sequence of optimally spaced stimulation pulses based upon pulse sequences which gave the most force from the human thenar muscle in experi-ments carried out by Thomas et al.[11]. No substantial effect of varying the inter-pulse interval of post doublet pulses was found. Hence, a sixth inter-pulse spacing of 35 ms was replaced with 40 ms to aid timing and com-parison between profiles. Per series, the same number of stimulation pulses is applied as the ODFSIII would, hence investigation into whether this variable spacing pattern throughout gives greater force per amount of applied stim-ulation can be made. It has been suggested that the same amount of stimulation with variable spaced pulses can give slower muscle fatigue[9,10,12,15]. The pulse inter-vals adopted in this profile are 5, 15, 25, 30, 35 and 40 ms. 6. Optimal in bursts: This profile is akin to profile 4, a controllable duration of the optimum series of pulses is applied during periods where the force response in the tibialis anterior would be naturally greatest. In between,
the stimulation is maintained at 20 Hz single pulses. An initial peak is added between the end of the rising ramp and the start of the main stimulation. During this time (0–1.6 s) repetitions of the optimum series are added to a profile.
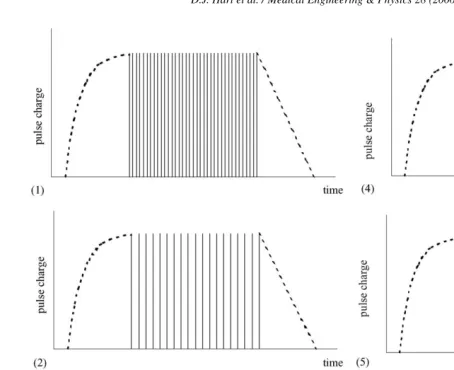
The same number of stimulation pulses (six) per 150 ms is applied to profiles 1, 3 and 5 compared with profile 2, where 50% less is applied over the same period (three pulses).Fig. 5
shows the four different pulse spacing trains over 150 ms adopted by the profiles. Ramping always takes place at 50 ms inter-pulse spacing (20 Hz) except for profile 1 which is at 40 Hz (25 ms inter-pulse spacing).
3. Stimulator
Fig. 5. Timings of the stimulation profiles.
hardware. If all parameter values could be expressed in a dig-ital form within the PIC, complete computer control would be an achievable future development. A number of user inputs are selectable to allow the choice of different profiles and timing parameters.
3.1. Design
A standard ODFSIII was modified in this design. The CE marked device was chosen because its output is known to be safe and effective in clinical use. In typical use, analogue set-tings (Table 1) by clinicians or users must be conveyed in a form understandable to the PIC. Linear potentiometers, con-nected across the voltage supply (5 V) to the PIC, are used for these variables. A multi-channel 8-bit and serial ADC trans-lates the voltages set on the wiper terminals. A single pole and double throw switch is provided to choose between fixed or adaptive timing. A second switch allows for the selection between either manual or partial computer control. There is linear and continuous control over the time taken to ramp
down between no stimulation and maximum over the range, 0.5–4 s. A visual indicator (LED) is illuminated when stim-ulation is being applied. At switch on/off, no stimstim-ulation is applied to the user.
The final voltage (Vfpw) from the pulse width potentiome-ter is in direct proportion to the pulse width produced at the output. The ADC samplesVfpwand stores its 8-bit represen-tation (fpw). During ramping time (T), either up or down, the pulse width (pw) is modulated.
3.2. Ramp up
A series capacitor and variable resistor are used to form the exponential function Eq. (1). Sampling of the voltage across the capacitor before each pulse provides a digital value of the pulse width (pw) in the exponential charging manner required. Before charging occurs,Vfpw is converted by the ADC to its digital form (fpw) and then through simple calcu-lation ramping continues until the digital value of the voltage across the capacitor reaches 75% of fpw (this percentage cor-responds to a level where there is sufficient slowing of the ramp to represent its end). Once this threshold is passed the pulse width (pw) is set at 0.75 fpw until ramp down. A simple voltage follower buffers the voltage across the resistor used to setVfpw(Fig. 7).
When operating at the lowest achievable final pulse width, Vfpw has a minimum value of 150 mV corresponding to a pulse of approximately 30s width. This potential is the minimum the capacitor can be accurately charged to over the maximum ramping time of 4 s. In order to achieve this time period, large capacitance and resistance values are needed. To minimise the effects of leakage current, which would oth-erwise have a notable effect, a tantalum capacitor is used in preference to a standard electrolytic. Pulses widths of 5s and above are produced during ramping while the mid-profile pulses are between 30 and 340s.
An op-amp (LM324) with an output capable of reaching close to zero, when operating from a single positive supply, is crucial in maintaining accurate timings at low pulse widths.
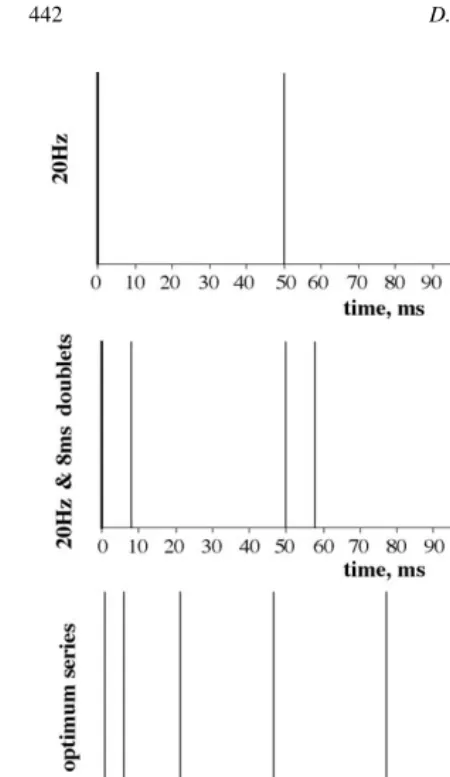
Fig. 6. Schematic diagram of PIC based stimulator (rectangle with the broken line shows the modules incorporated into an ODFSIII).
3.3. Ramp down
A capacitor charged by a constant current source, acts as a linear integrator. This is the fundamental characteristic required; to linearly ramp fromVfpw(a controllable param-eter) to zero in a time independent ofVfpw, i.e. the charging rate is proportional to charging level. While conventional cur-rent mirrors and op-amp integrators were considered, a single supply circuit, ‘The Deboo’ integrator was used[19].
A ‘ramp down disable’ control signal from the PIC dis-ables integration by holding its output at near to zero during phases of stimulation other than ramp down. After the exten-sion phase of stimulation, the integrator is no longer inhibited and its output charges at a rate appropriate to that fraction of Vfpwapplied to its input by a controllable resistor network (Fig. 8).
By designing the Deboo integrator to have an integra-tion period ofτ(i.e. for an input ofVfpwapplied, the output
charges toVfpwinτs), applying a 10th ofVfpwresults in an integration time of 10τ. An op-amp voltage follower buffers the fraction ofVfpwapplied, as otherwise the impedance of the resistor network would affect the biasing of the Deboo integrator.
The Deboo integrator was found to operate well with good timing accuracy. Discharge of the capacitor, between trains of the stimulation profiles, was achieved with a transistor and a small resistance placed in series to limit the peak discharge current.
3.4. Ramping control signal protocol
Fig. 7. Circuit schematic of ramp up module. potentiometer to give the appropriate exponential ramp
char-acteristic.
Once pw passes 75% of the originally scanned fpw, the pulses in the middle of profile (Fig. 4) are applied. Ramp enable remains high, allowing complete charging of the ramp
up capacitor. This is conducted due to the requirement ofVfpw governing the rate of charge of the Deboo integrator. Ramp enable could be disengaged during the mid-band stimulation, however, it would result in charging and discharging of the ramp up capacitor as it is toggled at the start and finish of
[image:7.842.60.542.464.719.2]the mid-band profile. Efficient use of power is achieved by minimising the number of times the ramp up capacitor is charged and discharged.
Up to this time ramp down disable (Fig. 8) is applied high, inhibiting the charging of the Deboo integrator. On comple-tion of the mid-band stimulacomple-tion, this signal goes low thereby allowing the production of a linear ramp in pw by the PIC sampling the ramp down signal.
3.5. Pulse generation
Accurate control over pulse width is achieved using the internal 8-bit timer of the PIC, which maintains a minimum overhead on the processor time. With no pre-scalar, 1s res-olution can be achieved in the range 0–255s. To meet the specified range of 3–350s requires a divide by 2 pre-scalar resulting in a resolution of 2s (count range up to 175). The most efficient use of assembler code generated an overhead of five instruction cycles, hence when a pulse width of zero is requested a pulse of 5s is observed.
3.6. Mid-profile stimulation and selection
When called with a positive width value and negative width value, a pulse width function accurately produces an output pulse of the given values. For each test profile, the mid-band stimulation is then simplified into effectively implementing a state machine corresponding to a number of timing delays (Fig. 9). These state machines were generated through consideration of the existing ODFS operation and what was required logically. Since for each profile there are a known number of pulses every 150 ms, timing loops are evaluated through counting the number of pulses generated. About 80% of the program memory in the PIC16F84 is used to store the software.
On power-up one of the six profiles is selected using a six-throw-single-pole switch. A voltage divider, using five series connected 220 k resistors, divides the range into 51 unit increments (255/5) allowing for sensing of the state of the switch. The ADC translates a voltage into a digital value (0–255), which is transmitted serially to the PIC. The switch setting is determined by the PIC examining the boundary values of each interval.
3.7. Serial interface
The inclusion of this element is partially seen to demon-strate further development. The clinical setting of poten-tiometers and switches to dictate parameters does not exploit their possible accuracy. Research devices, controlled by pocket PCs through a serial interface appear indicative of how practical DFSs may be developed [20,21]. Clinicians could set parameters through the use of a pocket PC, with no risk of unintentional adjustment between appointments. The decreasing price of these devices suggests this may be a feasible method of future clinical control.
4. Experimental method
The modified ODFSIII allows for the programming of dif-ferent stimulation outputs in order to test the six waveforms shown inFig. 4. Initial tests on three able-bodied volunteers recruited from the Salisbury District Hospital and the Uni-versity of Southampton were proposed (Table 2) and are the subject of future work. If the tests are successful, the test pro-cedure will be repeated with three current ODFSIII users to see if the same results are produced in the target user group. Ethical approval for the experimental work was obtained from the Salisbury Research Ethics Committee. A comfort-able stimulation intensity and timing, appropriate for produc-ing foot-lift durproduc-ing walkproduc-ing, was found for each subject. The subject was then positioned in an apparatus that measures isometrically lower limb joint moments at the ankle, knee and hip; the multi-moment chair[14]. The subject sat within the apparatus, with the feet secured in boxes mounted on beam structures with strain gauge transducers. The knees are secured in vertical support beams, again with strain gauges attached. These sensors measure any force change produced about the hip, knee and ankle in the three orthogonal planes. Sensor inputs are sampled at 100.8 Hz and averaged over 16 samples. Straps around the pelvis, waist and body are used to minimise movement and for safety. Different joint angles are accommodated by inclining the back-board, raising or lowering the seat height and adjusting the angles of the feet boxes in the sagittal plane. In these tests, the subject was semi-reclined with the position defined at the ankles 65◦, at the knees 15◦and at the hips 35◦. This position was selected to mimic the ‘extended’ posture adopted during walking and for comfort.
In this study, the responses only at the ankle are inves-tigated. By the nature of the design of the multi-moment chair, dorsiflexion moments are measured directly as one of the bending moments of the beam structure, with an associ-ated non-systematic RMS error of 0.86 N m[14]. Steps were taken to minimise further errors by fixing the foot securely to prevent any movement and to allow for rests in between stimulation tests to minimise the effects of fatigue. During initial measurements, it was observed that the dorsiflexion moments were only a few Newton meter maximum. It was therefore decided to increase the stimulation levels to result in increased moments up to about 10 N m.
[image:8.842.303.547.668.736.2]Dorsiflexion force was determined for the six profiles with a 310s pulse width during the main stimulation time. The force values were converted into torque by measuring the
Table 2
Selection criteria for able-bodied volunteers No history of neurological
injury or illness
Normal range of passive movement about the ankle
No history of epilepsy Able to tolerate the sensation of stimulation
hip to knee and knee to ankle distances. A Mixed Signal Oscilloscope (Agilent 546222D) and current probe (Philips PM9355) captured the current waveforms during each stim-ulation, which was set at 30 mA.
[image:10.842.306.543.90.133.2]5. Results
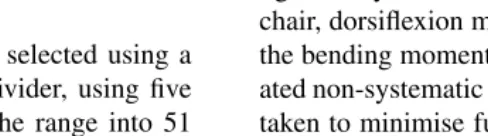
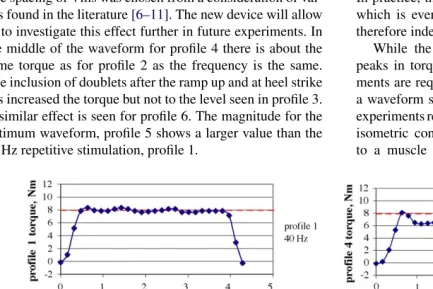
Fig. 10shows the torque generated for the different pro-files. The purpose of the experiments was to investigate the shaping potential of the different profiles. While no attempt was made to time the stimulation duration precisely, all the waveforms are of approximately the same length except pro-file 1 whose average value is included as a broken line in all the plots. Each stimulation profile was started and stopped manually using a switch.
The waveform for profile 1 clearly has a bigger magnitude than profile 2 due to twice the stimulation frequency. With 4 ms separating the doublets there is more torque for profile 3. The spacing of 4 ms was chosen from a consideration of val-ues found in the literature[6–11]. The new device will allow us to investigate this effect further in future experiments. In the middle of the waveform for profile 4 there is about the same torque as for profile 2 as the frequency is the same. The inclusion of doublets after the ramp up and at heel strike has increased the torque but not to the level seen in profile 3. A similar effect is seen for profile 6. The magnitude for the optimum waveform, profile 5 shows a larger value than the 40 Hz repetitive stimulation, profile 1.
Table 3
Average torque over the top part of each waveform for the different profiles
Profile 1 2 3 4 5 6
Torque (N m) 7.9 6.2 9.3 7 9.7 6.8
Difference with respect to profile 1 (%)
0 −21 17 −12 22 −15
Table 3shows the average torque for the different profiles. Of note is the increase in magnitude when using the optimum profile 5.
6. Discussion
Observations of the current waveform show no distortions and only transients with short time-constants caused by the impedance of a subject’s skin. All the observed voltage and current transients were shorter than the smallest inter-pulse duration that can be achieved by the stimulator of 1.5 ms. In practice, the minimum inter-pulse duration will be 4 ms, which is even longer. Physically, the doublet pulses were therefore independent events.
[image:10.842.76.510.427.716.2]While the stimulation profiles have demonstrated that peaks in torque can be achieved (Fig. 10), further experi-ments are required to determine if it is possible to generate a waveform shape that is close to that seen naturally. Also experiments reported in this paper have been carried out under isometric conditions. There will be varying loads applied to a muscle during walking and the further experiments
are needed to demonstrate whether peaks of torque can be achieved under these dynamic conditions.
There are reports in the literature of experiments to study the effects of doublets and optimum series[6–12], but we have not found any investigations into the phenomenon with respect to the tibialis anterior muscle. The inter-pulse times for the optimum series in Section2.2andFig. 4were loosely based on the values reported by Thomas et al. in their stimu-lation of the median nerve that innervates thenar motor units
[9]. It is possible that individual muscles may respond better to other time series as the effect may depend on different fibre types and muscle anatomy.
It is not clear that an increase in torque output observed using doublets can be achieved with a lower energy cost
[9,10].
The combination of digital and analogue components has resulted in a practical design. Ramping up uses a non-linear and gradual transition, ensuring there is no discontinuity between ramping and the start of the main stimulation. A novel Deboo integrator is used in the ramp down circuit, achieving a reliable and accurate timing. Our focus for this work is in the flexibility offered by the PIC in storing a num-ber of different stimulation patterns to investigate the effects of doublet pulses. Other designs are possible where nearly all the functions required from the stimulator are implemented digitally in a PIC. A balance is needed between memory space (number of stored waveforms), size (portability), power con-sumption (battery life), program complexity (development time) and reliability (number of components and software design).
7. Conclusion
A versatile and microcontroller based stimulator has been developed for use in the clinical research setting by replacing many of the analogue circuits in an Odstock Drop Foot Stim-ulator. Linear ramping down is achieved using a novel Deboo integrator. The new stimulation waveform has been realised using a combination of simple analogue and digital design. Parameters are set using analogue inputs converted to digital values. Up to six different stimulation profiles with doublets or optimum series are stored in the controller’s memory. The results indicate that the stimulation of the common peroneal nerve with a non-repetitive series of pulses enhances the mag-nitude of dorsiflexion torque, which could lead to waveform shaping of the tibialis anterior activity during a gait cycle.
References
[1] Liberson WT, Holmquest HJ, Scot D, Dow M. Functional elec-trotherapy: stimulation of the peroneal nerve synchronised with the swing phase of the gait of hemiplegic patients. Arch Phys Med Rehabil 1961;42:101–5.
[2] Burridge J, Taylor P, Wood D, Swain I. The effects of common peroneal stimulation on the effort and speed of walking: a random-ized controlled trial with chronic hemiplegic patients. Clin Rehab 1997;11:201–10.
[3] Burridge J, Taylor P, Hagan S, Swain I. Experience of clinical use of the Odstock dropped foot stimulator. Artif Organs 1997; 21(3):254–60.
[4] Rushton DN. Functional electrical stimulation and rehabilitation—an hypothesis. Med Eng Phys 2003;25:75–8.
[5] Taylor PN, Burridge JH, Dunkerley AL, Wood DE, Norton JA, Sin-gleton C, et al. Clinical use of the Odstock dropped foot stimulator: its effect on the speed and effort of walking. Arch Phys Med Rehabil 1999;80(12):1577–83.
[6] Burke RE, Rudomin P, Zajac FE. Catch properties in single mam-malian motor units. Science 1970;168:122–4.
[7] Popovic D, editor. Advances in external control of human extremities proceedings I–X. Dubrovnik, 1962–1990. Originally published by the Yugoslav Committee for ETRAN Kneza Milosa 9, Belgrade, Yugoslavia, ISBN: 8676210012http://www.smi.hst.aau.dk/phdkotor/ echecd/index.html.
[8] Lee SCK, Gerdom ML, Binder-Macleod SA. Effects of length on the catchlike property of human quadriceps femoris muscle. Phys Ther 1999;79:738–48.
[9] Bigland-Ritchie B, Zijdewind I, Thomas CK. Muscle fatigue induced by stimulation with and without doublets. Muscle & Nerve 2000;23(9):1348–55.
[10] Bickel SC, Slade JM, Warren GL, Dudley GA. Fatigability and variable-frequency train stimulation of human skeletal muscles. Phys Ther 2003;83:4.
[11] Thomas CK, Johansson RS, Bigland-Ritchie B. Pattern of pulses that maximise force output from single human thenar motor units. Am J Physiol 2002:J680–1.
[12] Karu ZZ, Durfee WK, Barzilai AM. Reducing muscle fatigue in FES applications by stimulating with N-Let pulse trains. IEEE Trans BME 1995;42:809–17.
[13] O’Halloran T, Haugland M, Lyons GM, Sinkjær T. Effect of modi-fying stimulation profile on loading response during FES-corrected drop foot. In: From technology to market. . .Bridging the gap, 2003 International Functional Electrical Stimulation Society Conference (IFESS, 2003). 2003. p. 226–30. Poster presentation No. 1.8. [14] Wood DE, Donaldson NN, Perkins TA. Apparatus to measure
simul-taneously 14 isometric leg joint moments. Part 2. Multi-moment chair system. Med Biol Eng Comput 1999;37(2):148–54.
[15] Ratkevicius A, Quistorff B. Metabolic costs of force generation for constant frequency and catchlike inducing electrical stimulation in human tibialis anterior muscle. Muscle Nerve 2002;25:419–26. [16] Sandercock TG, Heckman CJ. Doublet potentiation during eccentric
and concentric contractions of cat soleus muscle. J Appl Physiol 1997;4.
[17] Mangold S, Keller T, Popovic MR. Muscle activity during normal walking and its relevance for the functional electrical stimulation applications. In: Proceedings of 7th Vienna international workshop on functional electrical stimulation. 2001., ISBN 3-900928-05-3 p. 18–21. Session 2 Paraplegia, Upper Motor Neuron Lesion. [18] Hof AL, Elzinga H, Grimmius W, Halbertsma JPK. Speed
depen-dence of averaged EMG profiles in walking. Gait & Posture 2002;16(1):78–86.
[19] MAXIM analogue—readers newsletter. APP 1155, June 21; 2005.
http://dbserv.maxim-ic.com/appnotes.cfm/appnote number/1155/. [20] Lyons GM, O’Keefe DT. A versitle drop foot stimulator for research
applications. Med Eng Phys 2002;24:237–42.
![Table 1Specification for a ODFSIII [5]](https://thumb-us.123doks.com/thumbv2/123dok_us/8501616.347637/2.842.137.453.547.715/table-specication-for-a-odfsiii.webp)