White Rose Research Online URL for this paper: http://eprints.whiterose.ac.uk/81114/
Version: Submitted Version
Proceedings Paper:
Barr, A., Clarke, S.D., Petkovski, M. et al. (3 more authors) (2014) Quasi-static and high-strain-rate experiments on sand under one-dimensional compression. In: Hiermaier, S., (ed.) Proceedings of the Hopkinson Centenary Conference. Hopkinson Centenary Conference, 9-11 September 2014, Cambridge, UK. Fraunhofer EMI , 1 - 15. ISBN 9783000467394
[email protected] https://eprints.whiterose.ac.uk/
Reuse
Unless indicated otherwise, fulltext items are protected by copyright with all rights reserved. The copyright exception in section 29 of the Copyright, Designs and Patents Act 1988 allows the making of a single copy solely for the purpose of non-commercial research or private study within the limits of fair dealing. The publisher or other rights-holder may allow further reproduction and re-use of this version - refer to the White Rose Research Online record for this item. Where records identify the publisher as the copyright holder, users can verify any specific terms of use on the publisher’s website.
Takedown
If you consider content in White Rose Research Online to be in breach of UK law, please notify us by
Quasi-static and high-strain-rate experiments on
sand under one-dimensional compression
A. D. Barr, S. D. Clarke, M. Petkovski, A. Tyas, J. Warren
Department of Civil and Structural Engineering, The University of Sheffield, Sheffield, South Yorkshire, UK
S. Kerr
Defence Science and Technology Laboratory, Porton Down, Wiltshire, UK
This paper investigates the effect of strain rate on the behaviour of dry and partially-saturated sand at very high stresses, seeking to clarify the existence of a strain-rate dependence and how this is affected by changes in moisture content. Dynamic one-dimensional compression tests on a fine quartz sand have been carried out to axial stresses of 400 MPa using a split Hopkinson pressure bar, alongside quasi-static tests to 800 MPa using the mac2T multi-axial test rig at The University of Sheffield. Specimens were prepared at moisture contents of 0.0%, 2.5% and 5.0%, and were laterally confined using a steel ring or steel loading box to ensure one-dimensional test conditions. Lateral stresses were recorded to allow the three-dimensional stress state of the specimens to be analysed. The results show that knowledge of both the axial and radial stresses is important for understanding the response of sand at higher strain rates, where an increase in stiffness is observed axially when compared to the quasi-static results.
1
Introduction
In order to make accurate predictions of the response of soils to blast and impact events, it is vital to have an understanding of the soil behaviour at very high pressures, and over a wide range of strain rates and ground conditions. While the effect of strain rate is of particular interest, the existing literature is inconsistent in its conclusions. Work by Farr [2] used a uniaxial strain device to test a variety of partially-saturated sandy soils at strain rates of 10 3 s , where it was found that the axial stiffness of the soil increased with strain rate in all cases. In contrast, Song et al. [3] performed tests on a dry quartz sand using a quasi-static device and a split Hopkinson pressure bar (SHPB), and concluded that there was no strain-rate effect between 10 3 s , while Bragov et al. [4] tested dry quartz sand using a SHPB and plate impact experiments, and reported no change in stiffness between 103 6 s . Bragov et al. recorded radial stresses in the SHPB tests, and the relationship between axial and radial stresses was used to estimate the mean stress in the plate impact experiments.
Current work at The University of Sheffield seeks to clarify the effects of strain rate on dry and partially-saturated quartz sand through quasi-static and dynamic one-dimensional compression to very high stresses. Quasi-static tests (10 s ) have been performed to axial stresses of 800 MPa using the mac2T test rig, alongside dynamic tests (103 s ) to axial stresses of 400 MPa using a SHPB. In both cases the sand was confined and the axial and lateral response was recorded, so that the three-dimensional stress state could be derived.
2
Material properties
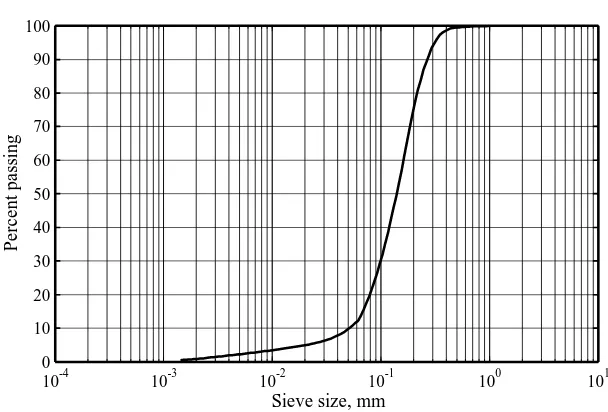
The material tested was a light brown–orange uniform fine quartz sand. A sieve analysis of the sand was carried out to assess the particle size distribution, the results of which are presented in Figure 1. A summary of material properties is provided in Table 1. Specimens were tested at moisture contents of 0.0%, 2.5% and 5.0% in both the quasi-static and dynamic tests, where moisture content, w, is the ratio of the mass of water, Mw, to the mass
of dry sand, Ms. All specimens were carefully oven-dried before testing, and
10-4 10-3 10-2 10-1 100 101 0
10 20 30 40 50 60 70 80 90 100
Sieve size, mm
P
e
rc
en
t p
as
si
n
[image:4.595.102.406.105.311.2]g
[image:4.595.97.388.377.530.2]Figure 1: Initial particle size distribution
Table 1: Initial sand properties
Specific gravity 2.66
D10 50 µm
D50 130 µm
D60 150 µm
Uniformity coefficient, Cu 3.0
Min. dry density 1.35 Mg/m3 Max. dry density 1.87 Mg/m3
Table 2: Summary of test variables
Peak strain rate [s-1]
Peak axial stress [MPa]
Moisture content [%]
Number of tests
10-3 (mac2T) 800
0.0 3
2.5 3
5.0 3
103 (SHPB) 400
0.0 6
2.5 5
[image:4.595.96.516.589.749.2]3
Dynamic methodology
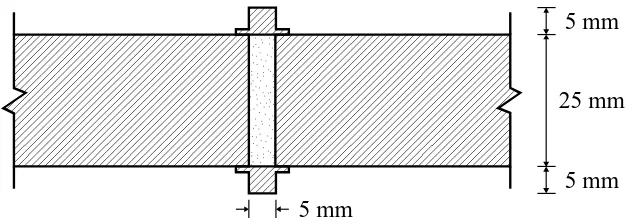
The dynamic tests were performed using a split Hopkinson pressure bar, with a confining ring to contain the sand specimens. The stainless steel incident and transmitter bars are each 25 mm in diameter and 1500 mm in length, while the striker bar is 25 mm in diameter and 400 mm in length. Semi-conductor strain gauges on both bars were arranged to ensure than only longitudinal waves were recorded.
Sand specimens were held in a steel confining ring with a 25 mm internal diameter and 35 mm external diameter over a length of 5 mm, as depicted in Figure 2. A strain gauge located on the outside surface of the ring enabled the circumferential strain of the ring to be measured and, using thick walled pipe theory, the average internal pressure in the sample could be related to the circumferential strain using the expression
P =
iE
2 o
R -
R
2i 2 iR
2
where Pi is the internal radial pressure exerted on the specimen by the
confining ring, E is the Young’s modulus of the ring, is the circumferential strain measured on the outside of the ring and Ro and Ri are the outer and
inner radii of the ring respectively [5]. To take into account the significant change in specimen length during the test, the average internal pressure deduced from the circumferential strain was factored by the length of the confining ring divided by the varying sample length.
5 mm
25 mm
5 mm 5 mm
[image:5.595.101.415.567.679.2]3.1
Test procedure
To prepare a sand specimen, the confining ring was held vertically and a set mass of sand poured and compacted into the ring to achieve a density of approximately 1.5 Mg/m3. A thin ( ) disk of aluminium foil and a small amount of cyanoacrylate adhesive were used to hold the specimen in place while the ring was arranged between the Hopkinson bars. During the test, the strength and mass (0.01g) of the foil could be considered to be negligible.
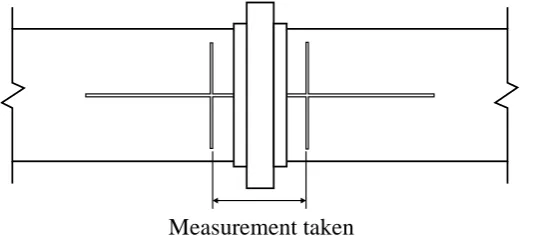
Small specimen lengths are required to achieve stress equilibrium in soil specimens, and so careful measurement of the initial length is needed to ensure the accuracy of density calculations. The incident and transmitter bars were each marked with a pair of perpendicular lines using a sharp blade, and the distance between the inside edges of these lines was measured using a travelling microscope fitted with a digital dial gauge (Figure 3). Comparison of the measurements before and after the sand specimen was inserted provided the initial specimen length with an accuracy of .
[image:6.595.99.367.399.520.2]Measurement taken
Figure 3: A travelling microscope fitted with a digital dial gauge was used to find the pre-test length of the sand specimen by measuring between lines marked on the pressure bars.
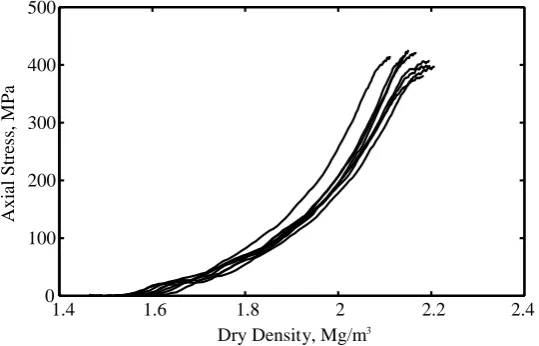
Stress pulses were applied by firing the striker bar using a gas gun, which was set up in a consistent manner to ensure a similar peak axial stress and strain rate in each test. This setup provided peak axial stresses in the specimen of approximately 400 MPa and peak strain rates of approximately 4800 s . The stresses and strain observed in a typical test are shown in Figure 4 and Figure 5. The care taken in the setup of the apparatus and in the measurement of the specimens results in high repeatability, as shown in Figure 6.
0 50 100 150 200 -100 0 100 200 300 400 500
Time, µ s
[image:7.595.99.369.102.294.2]S tr e ss , M P a Front Stress Back Stress Radial Stress
Figure 4: Typical axial and radial stress development in a SHPB test on dry sand
0 50 100 150 200
0 1000 2000 3000 4000 5000 S tr ai n ra te , s -1
Time, µ s
0 0.1 0.2 0.3 0.4 S tr ai n
[image:7.595.101.392.331.508.2]Strain rate Strain
Figure 5: Typical development of strain and strain rate in a SHPB test on dry sand
1.4 1.6 1.8 2 2.2 2.4
0 100 200 300 400 500
Dry Density, Mg/m3
A x ia l S tre ss , MP a
[image:7.595.100.370.551.724.2]4
Quasi-static methodology
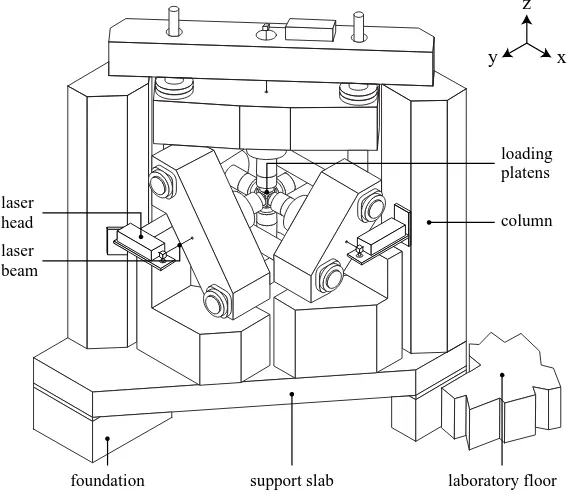
The quasi-static tests were carried out in mac2T, the University of Sheffield’s test rig for Multi-Axial Compression of Concrete at Elevated Temperatures, which is shown in Figure 7. This rig allows specimens to be tested in true multi-axi x y z) to high stresses, with independent
control of loads or displacements in the x-, y- and z-axes [6].
laser head
laser beam
foundation support slab laboratory floor column loading platens x y
[image:8.595.99.383.247.493.2]z
Figure 7: mac2T test rig
25 mm
100 mm
100 mm
100 mm 50 mm
50 mm
50 mm 40 mm
[image:9.595.101.380.107.315.2]33 mm
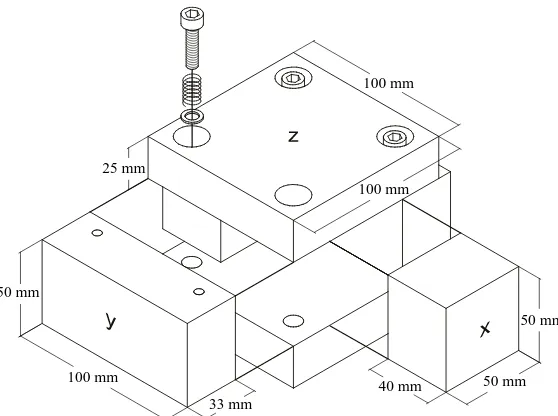
Figure 8: Sand loading box used in mac2T
4.1
Test procedure
To prepare a specimen for testing, five of the six test box blocks were loosely bolted together so that only the topmost face of the box was open, then the sand specimen was poured into the void and the final block inserted. The sand was compacted using a series of hammer drops until the protrusion of the x-axis blocks indicated that the specimen had achieved a dry density of 1.5 Mg/m3.
1.4 1.5 1.6 1.7 1.8 1.9 2 2.1 2.2 2.3 2.4 0
100 200 300 400 500 600 700 800
Dry Density, Mg/m3
Ax
ia
l st
re
ss,
MP
a
mac2T w = 0.0%
mac2T w = 2.5%
mac2T w = 5.0%
[image:10.595.109.488.100.367.2]SHPB w = 0.0% SHPB w = 2.5% SHPB w = 5.0%
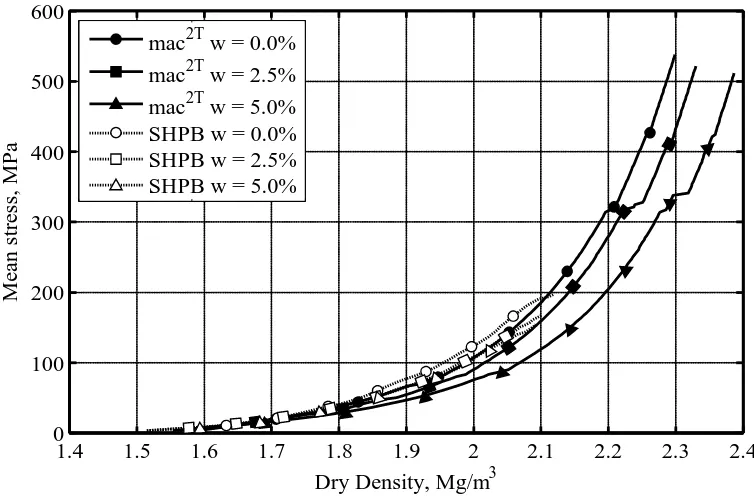
Figure 9: Axial stress–dry density data for mac2T and SHPB tests with varying moisture
content. Mean results are presented and unloading omitted for clarity.
1.4 1.5 1.6 1.7 1.8 1.9 2 2.1 2.2 2.3 2.4
0 100 200 300 400 500 600
Dry Density, Mg/m3
Me
an
st
re
ss,
MP
a
mac2T w = 0.0%
mac2T w = 2.5%
mac2T w = 5.0%
SHPB w = 0.0% SHPB w = 2.5% SHPB w = 5.0%
Figure 10: Mean stress–dry density data for mac2T and SHPB tests with varying moisture
[image:10.595.112.489.438.686.2]5
Results and discussion
Data from the quasi-static mac2T tests was readily converted into stress-strain data for further examination, and in the SHPB tests the response of the sand specimen was calculated using one-dimensional elastic wave propagation theory, which is well reported elsewhere and will not be repeated here [7]. One-dimensional conditions were assumed in the specimen, and the strains recorded in the steel confining ring confirmed that this assumption was valid: the maximum radial strain in the sand specimen was 0.05%, compared to axial strains of over 30%. Axial stress–dry density and mean stress–dry density data are presented in Figure 9 and Figure 10 for the quasi-static mac2T tests and dynamic SHPB tests, where dry density, d, is the ratio of the dry
mass of the soil to its volume. Unloading has been omitted for clarity. All of the specimens tested follow the expected pattern for sands in one-dimensional compression: at low stresses the particles in the sand roll and slide over each other into a denser configuration, then as the voids are filled this compaction mechanism becomes more difficult, with further compaction achieved through particle crushing.
5.1
Moisture effects
In the quasi-static tests the addition of water leads to a reduction in the stiffness of the sand specimen, with the 2.5% moisture content specimens behaving less stiffly than the dry specimens, and the 5.0% moisture content specimens less stiff than the 2.5% moisture content specimens. This is indicated by the higher dry densities achieved by the wet specimens for a given stress in Figure 9 and Figure 10. As reported by Martin et al. [8], this reduction in stiffness is likely due to the lubricating effect of the water between the sand particles, reducing inter-particle friction and facilitating the rolling and sliding mechanism which leads to compaction.
however, this contradicts previous work, such as that by Farr [2], which showed that sandy materials exhibited less particle breakage at higher strain rates. An alternative explanation could be that at the higher strain rate the moisture does assist in the rearrangement of particles as in the quasi-static tests, but that another mechanism, such as localised loading of pore water, increases the stiffness of the specimen, resulting in little net change in stiffness.
It is worth noting that none of the tests display the rapid stiffening associated with significant loading of pore water, such as that observed by Hendron et al. [9] and Veyera [10]. Full saturation is only encountered in the 5% moisture content mac2T tests at axial stresses of 600 MPa and above, where the drained conditions permit the excess pore water to be expelled from the specimen rather than sustain load.
5.2
Strain-rate effects
Figure 9 shows the relationship between axial stress and dry density, where the dynamically-tested specimens consistently exhibit an increase in stiffness over those tested quasi-statically. This effect is particularly evident at low stresses where the strain rate is at its peak, and is reduced as the strain rate decreases throughout the test. While the dynamic specimens display little change in stiffness with increasing moisture content, the quasi-static specimens become less stiff, so that the increase in axial stiffness due to strain rate appears to increase with moisture content. It is noted that while the mac2T tests were fully drained, the loading of the SHPB specimens more closely resembled undrained conditions, with little opportunity for the escape of pore air. The resulting compression of pore air contributes to the stiffness of the specimen at higher strains, but a calculation based on ideal gas behaviour in undrained conditions estimates that the compression of air observed at 2.1 Mg/m3 would require an additional pressure of 190 kPa, a tiny fraction of the 80 MPa mean increase in stress observed in the dry sand at 2.1 Mg/m3 compared to the quasi-static tests.
for a certain dry density, the dynamically-tested sand specimens generated higher axial stresses but lower radial stresses when compared to the quasi-static specimens, so that there was a smaller change in the overall stiffness. Lower radial stresses may be the result of radial confinement in the sand specimen, which would enable the specimen to sustain the higher axial stresses seen in Figure 9.
6
Conclusions
Using the mac2T test rig, quasi-static one-dimensional compression tests on fine quartz sand were carried out to axial stresses of 800 MPa, alongside dynamic tests using a split Hopkinson pressure bar to axial stresses of 400 MPa. In both test series lateral stresses and strains were also recorded.
Specimens were prepared at moisture contents of 0.0%, 2.5% and 5.0%. In the quasi-static tests the specimens became increasingly less stiff with the addition of water, while in the dynamic tests the water appeared to have little effect on the overall stiffness at the moisture contents tested.
Between peak strain rates of 10 s and 103 s a significant increase in axial stiffness was observed, but this effect was greatly reduced when mean stresses were considered. The data presented suggests that the increase in axial stiffness observed between the quasi-static and dynamic tests is not due to an inherent strain-rate dependence in the sand, but rather is the result of increased confinement due to the radial inertia of the SHPB specimens.
Many of the previous studies on soils at high strain rates, including those by Farr [2] and Song et al. [3], presented only axial stress and strain results, and so this data highlights the importance of understanding the full three-dimensional stress state of the soil. The variation in radial stresses with strain rate also serves to warn against assumptions of consistent stress ratio with changing strain rate.
7
Acknowledgements
8
References
1. Warren, J., et al., Briefing: UK Ministry of Defence Force Protection
Engineering Programme. Proceedings of the ICE - Engineering and
Computational Mechanics, 2013. 166(3): p. 119-123.
2. Farr, J.V., Loading rate effects on the one-dimensional compressibiliy of
four partially saturated soils, 1986, US Army Engineer Waterways
Experiment Station: Vicksburg, MS.
3. Song, B., W. Chen, and V. Luk, Impact compressive response of dry sand. Mechanics of Materials, 2009. 41: p. 777-785.
4. Bragov, A.M., et al., Determination of physicomechanical properties of
soft soils from medium to high strain rates. International Journal of
Impact Engineering, 2008. 35.
5. Stephens, R.C., Strength of materials: theory and examples. 1970: Hodder Arnold.
6. Petkovski, M., R.S. Crouch, and P. Waldron, Apparatus for Testing Concrete under Multiaxial Compression at Elevated Temperature
(mac2T). Experimental Mechanics, 2006. 46: p. 387-398.
7. Gray III, G.T., Classic split-Hopkinson pressure bar testing, in ASM
Handbook Vol. 8: Mechanical Testing and Evaluation, H. Kuhn and D.
Medlin, Editors. 2000, ASM International.
8. Martin, B.E., et al., Moisture effects on the high strain-rate behavior of sand. Mechanics of Materials, 2009. 41: p. 786-798.
9. Hendron, A.J., M.T. Davisson, and J.F. Parola, Effect of degree of saturation on compressibility of soils from the Defence Research
Establishment Suffield, 1969, US Army Engineer Waterways
Experiment Station: Vicksburg, MS.
10. Veyera, G.E., Uniaxial stress-strain behavior of unsaturated soils at
high strain rates, 1994, Wright Laboratory Flight Dynamics Directorate,