Jonathan A. Black1and W. Andy Take2
Quantification of Optical Clarity of
Transparent Soil Using the Modulation
Transfer Function
Reference
Black, Jonathan A. and Take, W. Andy, “Quantification of Optical Clarity of Transparent Soil Using the Modulation Transfer Function,”Geotechnical Testing Journal, Vol. 38, No. 5, 2015, pp. 588–602, doi:10.1520/GTJ20140216. ISSN 0149-6115
ABSTRACT
Transparent synthetic soils have been developed as a soil surrogate to enable internal visualization of geotechnical processes in physical models. Transparency of the soil dictates the overarching success of the technique; however, despite this fundamental requirement, no quantitative framework has yet been established to appraise the visual quality of transparent soil. Previous approaches to assess and optimize transparency quality included an eye chart assessment method, although this approach is highly subjective and operator-dependent. In this paper, an independent method for quantitatively assessing the optical quality of transparent soil is proposed based on the optical calibration method, Modulation Transfer Function (MTF). The work explores this hypothesis and assesses the potential for MTF to quantify the optical quality of transparent soils for a number of aspects including (i) optimum oil blend ratio, (ii) depth of viewing plane, and (iii) temperature. The results confirmed that MTF offers a robust and reliable method to provide an independent quantitative measure of the optical quality of transparent soil. The impact of reduced soil transparency and the ability to track speckle patterns—thus accuracy and precision of displacement measurement—was correlated with MTF to evaluate the permissible viewing depth of transparent soil.
Keywords
transparent soil, modulation transfer function, transparency, physical modeling
Manuscript received September 16, 2014; accepted for publication March 11, 2015; published online April 20, 2015.
1
Department of Civil and Structural Engineering, Univ. of Sheffield, Sheffield, S1 3JD, UK, e-mail: j.a.black@sheffield.ac.uk
2
Department of Civil Engineering, Queen’s Univ., Kingston, ON, K7L 3N6, Canada.
Introduction
VISUALISATION IN GEOTECHNICAL MODELLING
Technological advancements in imaging and computational capabilities have fuelled the rapid advance of visual and optical assessment methods in geotechnical research. X-ray radiography (Roscoe et al. 1963), stereo-photogrammetry (Butterfield et al. 1970; Andrawes and Butterfield 1973), computer based image processing (Taylor et al. 1998) and photoelasticity (Drescher and De Jong 1972) are some of the pioneering observational methods that have been developed. Many modern non-invasive visualisa-tion methods adopted in geotechnical research originate from embryonic techniques such as these; albeit benefiting from the considerable level of new technology at our disposal enabling increased measurement capabilities. For example, the translation of X-ray computed tomography and magnetic resonance imaging from the medical sector have enabled unprecedented resolution of internal soil structure that until recently would not have been possible (Desrues et al. 1996;Hall et al. 2010).
Over the past fifteen years, digital image photography coupled with image processing techniques has enabled digital
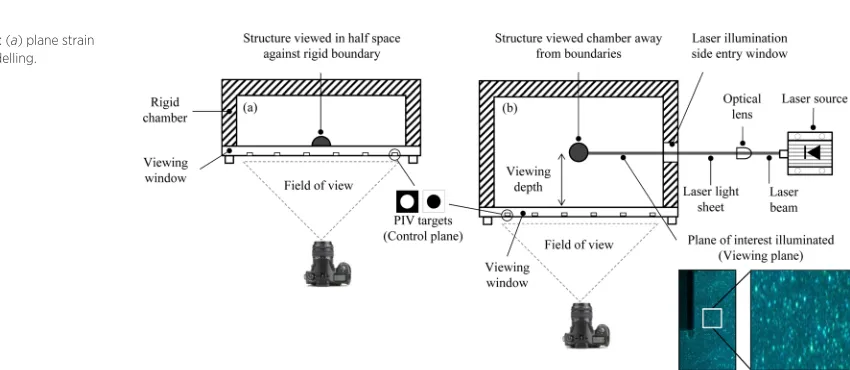
image correlation (DIC) for soil deformation measurement. White et al. (2003)adapted a particular form of DIC called par-ticle image velocimetry (PIV), initially conceived in fluid mechanics, specifically for geotechnical purposes, which is now routinely implemented in conjunction with plane-strain labora-tory modelling. Unlike the earlier image-based methods, the technique is not reliant on tracking artificial targets, but instead uses the unique texture signature of natural soil for higher measurement resolution. Although regarded as state-of-the-art, several shortcomings are still inherent in plane-strain modelling methodology such as (i) the impact of surface friction at the viewing window boundary, (ii) the need to simplify model geometry and the installation process for structural inclusions, and (iii) measurements are limited to only the exposed soil plane. To overcome these limitations, researchers have devel-oped translucent or transparent synthetic media as a soil surro-gate, referred to as transparent soil, to enable internal visualisation of geotechnical processes in physical models. Transparent soil consists of an aggregate and a matched refrac-tive index fluid. When fully saturated, they appear homogenous and thus allow light to pass, enabling internal visualisation within the soil. This is beneficial as it allows observation within the middle of a test chamber which reduces the impact of boundary effects and the need for geometrical simplification of complex structures (Fig. 1). Early experiments in transparent soil adopted back illumination to silhouette embedded target markers to capture the mechanical response of the soil (Gill and Lehane 2001); however, this has been superseded by laser-aided imaging in conjunction with DIC to illuminate soil texture (Fig. 1) for increased measurement density and resolution (Iskander and Liu 2010;Stanier et al. 2013). A summary of the development of transparent soil and recent works is reported by Iskander (2010).
The main areas of interest using this research technique focused on measurements of deformation patterns, permeabil-ity, and flow characteristics. As a result, researchers using
Nomenclature
c/p¼cycles per pixel
DIC¼digital image correlation Imax¼maximum pixel intensity Imin¼minimum pixel intensity
Imax(I)¼maximium pixel intensity in captured image Imin(I)¼maximium pixel intensity in captured image Imax(O)¼maximium pixel intensity of an object Imin(O)¼maximium pixel intensity of an object
LED¼light emitting diode lp/mm¼line pairs per millimetre
MTF¼modulation transfer function PIV¼particle image velocimetry
FIG. 1
[image:2.612.129.554.550.735.2]transparent soil for these applications have sought to create a blend of soil with optimal transparency in order to maximize its visual clarity, increase the size of test chambers, and improve measurement resolution. Transparency of the soil dictates the overarching success of the technique; however, despite this fun-damental requirement, no quantitative framework has yet been established to assess the visual quality of transparent soil adopted in geotechnical research.Stanier (2011)established op-timum transparency using an “eye test” calibration by viewing letters of decreasing font size through transparent soil at various oil mix ratios. However, it is noteworthy that this approach is highly subjective and operator-dependant. Clearly an impartial and quantitative framework would be desirable to determine optimal transparency and to enable comparison of optical qual-ity of various transparent soils reported in literature.
In this paper, a method for quantitatively assessing the optical quality of transparent soil is proposed based on the opti-cal opti-calibration method, modulation transfer function (MTF), commonly used to express the imaging quality and performance of an optical system. MTF is a measure of the modulation (or contrast) that is transferred from the object to an image. When an object is observed with an optical system, the resulting image will be degraded due to inevitable aberrations and diffraction phenomena. As a result, bright areas in an image will not appear as bright as they do in the object, and dark or shadowed areas will not be as black as those observed in the original patterns. MTF is established using a calibration target consisting of concurrent black and white line pairs of increasing spatial fre-quency. As spatial frequency increases, image modulation reduces such that individual line pairs are no longer visible in the image, but merge to a uniform colour, signifying the limit of resolution for a given optical system. Calibration is typically conducted in air; however, degradation in image quality would also occur if the calibration target were viewed through a trans-lucent medium. The work presented in this paper explores this hypothesis and assesses the potential of MTF to quantify the op-tical quality of transparent soils. Furthermore, opop-tical quality is correlated with DIC measurement to demonstrate a practical example as to the impact optical clarity has on the accuracy and precision of DIC to track speckle patterns in transparent soil applications.
Transparent Soil Development
GRANULAR TRANSPARENT SOILS
Granular soils have been simulated using glass beads and crushed glass with early developers includingChen and Wada (1986)to visualize flow, Allersma (1982)to study stress distri-bution under simple shear, andKonagai et al. (1992)to investi-gate railway embankments under seismic loading. Recently, silica gel has been adopted to represent granular soils in works by Iskander et al. (2002) to model pile penetration, Liu et al.
(2002) on shallow foundation settlement, and Ahmed and Iskander (2010) for investigating tunnel induced settlements. The most recent granular transparent soil developed is that by Ezzein and Bathurst (2011) who used fused quartz aggregate to examine geo-grid soil interaction behavior (Ezzein and Bath-urst 2014).Siemens et al. (2010) also used this material for a novel investigation of drawdown in unsaturated flow applica-tions, benefiting from the direct visualization of the air-fluid front observed at the saturated, non-saturated boundary inter-face where transparency diminishes.
FINE GRAINED TRANSPARENT SOILS
Precipitated amorphous silica (Flo-guard SP) was the first sili-cate aggregate used to model fine grain (clay) soils and has been extensively reported by Iskander et al. (1994), Iskander et al. (2002) Sadek et al. (2002), and Liu et al. (2003). Other works using a similar soil particle (HST-600 silica) include that of Hird et al. (2008)to investigate displacement around continu-ous augers in clay and driven pile installations (Ni et al. 2010). The latter works introduced artificial reflective seeding particles within the soil slurry prior to consolidation that are illuminated using a laser light sheet to provide texture for DIC analysis, as portrayed inFig.1. It is worth noting that due to low optical quality of the HST-600 based material, the maximum depth of soil through which texture was visible was 50 mm; conse-quently, the model geometry was restricted to 100 by 100 mm on plan.
Gill (1999)created an alternative fine grained transparent soil blend using fumed amorphous silica aggregate to investigate deformation and strain caused by the installation of a pene-trometer by tracking marker beads embedded inside the soil using video extensometer.McKelvey (2002)andMcKelvey et al. (2004) also used this material to investigate interaction effects of vibrated stone column foundations by tracking the silhouette of deforming columns backlit within the model. In both the lat-ter works, the model geometry reported was considerably larger than any previously achieved using precipitated amorphous silica; for example,McKelvey (2002)tests were conducted in a 415 mm diameter chamber, suggesting that fumed silica soils offered superior optical quality than precipitated amorphous silica counterparts. Recent works using a variant of this fumed silica material coupled with DIC laser aided measurement include examination of helical screw piles (Stanier 2011;Stanier et al. 2013), stone column ground improvement (Kelly 2013), soil plugging behavior during press-in piling of tubular piles (Black 2012a; Forlati and Black 2014), sample disturbance effects (Black 2012b).
TRANSPARENT SOIL MODELLING—OPTICAL QUALITY
grain variants representative of clay soils, and their ability to accurately model natural soil behavior. Recent publications such as those by Iskander et al. (1994,2002,2003) and Ezzein and Bathurst (2011)documenting mechanical behavior of both fine and coarse grain materials, in conjunction with the increas-ing number of investigative studies reported in literature, have been highly beneficial in alleviating concerns and enhance the awareness of transparent soil modeling as a viable technique. While this has served to dismiss some cynics, several limitations persist that are a direct result of the visual quality of the trans-parent material that limits the global appeal of this method; for example:
(i) The permissible model geometry and overall success of the illumination based image tracking technique (e.g., DIC) is governed by the optical quality of the material. Consequently, model geometries and the viewing depth to the illumination plane reported in literature are highly variable, inferring that different levels of optical clarity are achieved. The subsequent impact of low optical transmission is that the ability to resolve detail within the model, either the speckle pattern of reflective seeding particles or natural soil speckle pattern/particles, is significantly reduced. This aspect is specifically demonstrated in this paper using DIC correlation.
(ii) Small models invoke concerns about the impact of scale, boundary, and stress related effects on the observed soil behavior. This invites questions as to the suitability of the methodology compared to other simpler forms of physical modelling con-ducted in larger calibration chambers with applied boundary stresses.
(iii) Complex photogrammetric distortions owing to non-coplanarity of the viewing and control planes (refer toFig.1) as reported by Stanier et al. (2012)
have become evident as model dimensions have increased. These distortions are often unaccounted for and thus significant optical errors can be present in the experimental data reported.
ASSESSMENT OF TRANSPARENCY
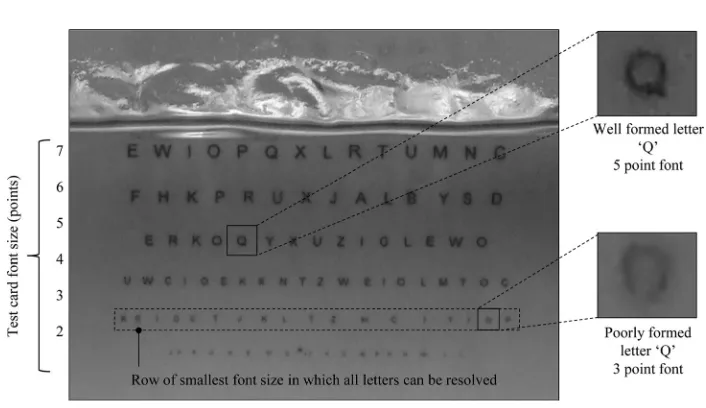
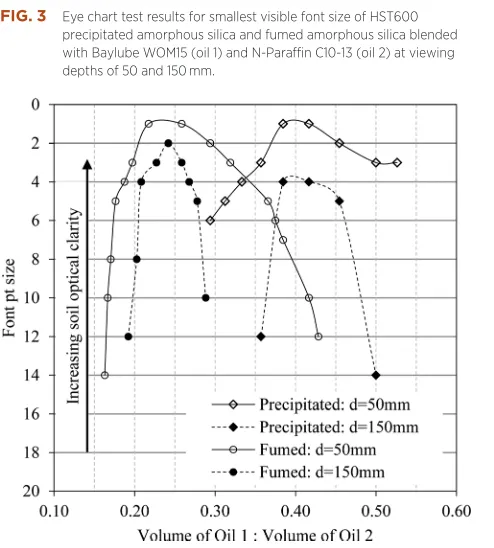
Several previous works have attempted to demonstrate the material transparency achieved; for example,Liu and Iskander (2010)viewed grid lines through the soil to portray the level of transparency noting, however, that the viewing depth of soil in test was typically 50 mm.Ezzein and Bathurst (2011)describe the use of a refractometer to match the refractive index of the pore fluid with that of the fused quartz aggregate although no optical assessment of the soil and oil combination was con-ducted. Stanier (2011)implemented a visual appraisal using a test card consisting of letters of decreasing font size (Fig.3), similar to the commonly known Snellen Chart (Snellen 1862) used by opticians in eye examinations to refine and optimise the visual clarity of the transparent soil and oil mix ratio for viewing depths up to 150 mm.Figure2shows an adapted Snellen chart ‘eye test’ calibration target viewed through 100 mm of transpar-ent soil where it is clear that the ability to distinguish letters is reduced at smaller font sizes. The visual assessment of HST-600 and fumed transparent clay soils using the eye test approach is shown in Fig.3. Is it evident that similar font sizes can be resolved when the viewing depth is small for each material; however, as the viewing depth increases, the optical clarity of the precipitated silica diminishes more rapidly, resulting in lower resolution of the text.
Despite the apparent success of this eye chart approach to assess optimum transparency several limitations remain: (i) it is subjective to individual interpretation and the visual acuity of the operator, and (ii) the actual achievable resolution of a
FIG. 2
[image:4.612.203.556.535.739.2]transparent soil model test is a function not only of the soil op-tical quality, but also the image capture system adopted (camera and lens components), which is not considered. Clearly a robust assessment framework providing qualitative means of evaluat-ing optical clarity of transparent soil, of both coarse and fine grained soils, and the optical test system would be beneficial. This paper describes the development and implementation of such a framework adapted from the scientific optical method known as MTF, commonly used to describe lens performance and quality.
Modulation Transfer Function
When an object is observed by an optical system, the resulting image will be degraded due to inevitable aberrations and diffrac-tion phenomena caused by a combinadiffrac-tion of the camera, lens assembly and alignment errors. Hence, the optical system will deteriorate the overall imaging performance such that an acquired image will not exactly replicate the original object pre-cisely. Calibration of optical systems is typically conducted in air; however, degradation would equally occur in an image if the object were viewed through a translucent media such as water or transparent soil, owing to additional diffraction of light rays that results from the loss of optical transmission. The MTF is a measure of the modulation (or contrast) that is transferred from the subject (object) to the image. In other words, it meas-ures how faithfully the optical system reproduces (or transfers) detail from the object to the image. It is important to note that a lack of optical clarity does not affect all details in an image to the same degree.
Consider an example as shown inFig.4whereby a model
pile is inserted into a consolidated bed of precipitated amor-phous HST-600 silica (Fig.4(a)) and fumed silica (Fig.4(b)) soil
mixed at their respective optimum transparency and illumi-nated by a laser light sheet viewed through a soil depth of 100 mm. The pile is visible in both images as it is large and spans many pixels in width. In contrast, the laser-illuminated seed particles which are critical to good image texture for DIC image analysis are points of light consisting of just a few pixels in diameter. It is evident that a greater number of illuminated particles are clearly visible in the fumed silica soil. These points of light inherently have a much higher spatial frequency and
Fig.4illustrates how this speckle pattern has been attenuated to
a blurrier image in the lower quality HST-600 silica based soil.
FIG. 3 Eye chart test results for smallest visible font size of HST600 precipitated amorphous silica and fumed amorphous silica blended with Baylube WOM15 (oil 1) and N-Paraffin C10-13 (oil 2) at viewing depths of 50 and 150 mm.
FIG. 4
[image:5.612.57.304.76.350.2] [image:5.612.253.569.511.732.2]Comparison of the histograms of pixel intensity within the two sample regions in these images illustrates that the fumed silica contains significantly more particles with pixel intensities brighter than the modal background intensity of the soil (i.e., a wider range of pixel intensities that provide “texture” for soil tracking) as shown inFig.4(c). In lay terms, the bright points of light that form the speckle pattern for DIC-based measurements are significantly more “blurry” when viewed through the trans-parent soil inFig.4(a)than inFig.4(b). This principle is further demonstrated in this paper (see the section “Relevance of MTF to DIC Measurements”) by comparing DIC tracking capability of synthesized test images of reducing speckle pattern intensity contrast.Figure4corroborates that fumed silica based soils first established byGill (1999)offer higher optical clarity than their precipitated amorphous silica counterparts.
Various optical calibration charts have been produced for the purpose of determining the resolution, sharpness, and chro-matic aberration of optical systems such asISO 12233:2014or USAF 1951. Calibration targets are defined by spatial frequency (number of bright and dark areas) often referred to as line pairs per millimetre (lp/mm) in object space or cycles per pixel (c/p) in image space. Contrast is the apparent difference in pixel intensity between bright and dark areas of the target as captured by an image (i.e., black and white). The MTF is defined as a ratio of the image and object modulation (Eq1) such that:
MTF¼Modulation of image
Modulation of object
¼ ImaxðIÞIminðIÞ
= ImaxðIÞþIminðIÞ
ImaxðOÞIminðOÞ
= ImaxðOÞþIminðOÞ
(1)
whereImax(I)andImin(I)are the maximum and minimum inten-sity as captured in an image of an actual object with repeating structure having maximum and minimum intensityImax(O)and
Imin(O). The modulation transfer function is normalized to unity at zero spatial frequency. At low spatial frequencies, the modu-lation is close to 1 (or 100 %) and generally falls as the spatial frequency increases until it reaches zero. This is the limit of re-solution for a given optical system and is referred to as the cut-off frequency as it is no longer possible to resolve individual detail (i.e., line pairs) or features within the image such as the texture speckle pattern. When the contrast value reaches zero, the image is a uniform shade of grey and thus none of the object detail is transferred to the image.
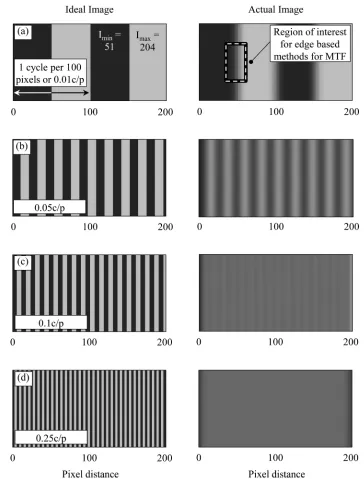
To illustrate how the MTF works, a series of ideal images consisting of alternating black and white stripes have been pro-duced that have a maximum (Imax) and minimum (Imin) pixel intensity of 204 and 51, respectively, and spatial frequencies defined by the number of cycles per pixel (c/p) in the range of 0.01 c/p (low frequency) to 0.25 c/p (high frequency) inFig.5. The adjoining images in Fig. 5, termed “actual image” have been produced by digitally manipulating the ideal image by a
Gaussian filter with a radius of 5 pixels which has the effect of blurring the image. The purpose of this is to artificially simulate the effects that would be observed if the patterns in the ideal images were captured through a transparent soil with an arbi-trary optical clarity less than air.
For the simulated “actual image” at a spatial frequency 0.01 c/p it is evident that the boundary between the black and white stripes is blurred and not as well-defined owing to a loss of resolution produced by the Gaussian filter. Cross-sections of pixel intensity through the ideal and blurred images ofFig.5are presented inFig.6. In this intensity map (greyscale), pixel inten-sity 0 corresponds to the color black, and inteninten-sity 255 white. As the ideal images have been artificially generated, they pro-duce a perfect square waveform, i.e., the transition from the dark to light regions is instant and occurs over a single pixel; however, the corresponding actual image yields an imperfect square waveform due to the blur in these images. The transition from low to high intensity (black to white), and vice versa, is more gradual as represented by the curved edges and inclination of the rise and fall between the minimum and maximum signal values. Nevertheless, despite this loss of edge resolution, it is still possible to distinguish visually (Fig.5) and via the waveform of intensity (Fig.6) that the actual image correctly resolves two line pairs and that the minimum (Imin¼51) and maximum (Imax¼204) pixel intensities (contrast) are still maintained. For this reason, the modulation of the ideal and actual image are the same as the pixel intensity limits Imaxand Imin are unaf-fected; hence the MTF can be calculated using Eq1and show to be MTF¼1.
practice, it is common to report the resolution of the optical sys-tem as the spatial frequency in which the modulation is 50 or 30 % of the original pattern, denoted as MTF50 and MTF30, respectively.
Experimental Apparatus and
Technique
TRANSPARENT SOIL
The transparent soil used in this investigation is an analogue for fine grained clay and consisted of fumed amorphous silica
aggregate and two mineral oils, N-Paraffin C10-13 and Baylube WOM 15 as the pore fluid. In order to simulate a wide range of soil transparency, the fumed silica was deliberately prepared with incorrectly matched refractive pore fluid combinations ranging from 100 % Baylube WOM 15: 0 % N-Paraffin C10-13 to a 50 %: 50 % mix blended in 10 % increments (Table1). The soil aggregate and fluids were thoroughly mixed using a hand held food blender and placed in Perspex test chambers meas-uring 150 by 150 by 150 mm. Samples were then placed in a vacuum to evacuate the air to produce a two-phase continuum. This stage was crucial as air trapped within the material leads to a loss of transparency. The calibration target (discussed below)
FIG. 5
[image:7.612.207.571.87.566.2]was placed within the test chamber so that it could be viewed at increasing depths of transparent soil and correlated with MTF.
As the purpose of this paper is to introduce and validate the use of MTF as a feasible robust method to quantitatively
compare optical quality, coarse 10 % incremental pore fluid mix ratio combinations were considered adequate for this purpose. However, for calibration of an actual soil–fluid blend combination to be used in a physical model test, the authors would recommend investigators to undertake a secondary finer
FIG. 6 Effect of increasing spatial frequency on signal modulation.
FIG. 7
[image:8.612.59.533.92.465.2] [image:8.612.243.554.554.736.2]calibration using smaller incremental mix ratios once the wider optimal range has been establish.
CAMERA SETUP
Images of calibration targets consisting of alternating black and white stripes of increasing spatial frequency were captured so that the image modulation could be determined for each oil mix. The camera and lens combination was a Canon EOS 1100D Single Lens Reflex (SLR) with a 18–55 mm lens. During the test, the camera was mounted on a tripod at a distance of 0.75 m from the front of the test chamber and was activated using an automatic remote trigger to minimize temporal move-ments of the camera position between subsequent images. MTF is known to be affected by camera parameters such as aperture, exposure time, focus, and illumination; thus, calibration was conducted in a dark room under constant LED illumination with the camera properties fixed at focal length of 55 mm, an aperture of f6.3, shutter speed of 1/20th s, ISO of 100, auto white balance, and no flash. An image was initially captured by allowing the camera to auto focus on the target plane before switching to manual focus for the remainder of the cal-ibration process. These rigorous precautions ensured that any changes in pixel intensity observed at each lp/mm, and result-ing change in MTF, were only attributed to loss of transpar-ency of the soil.
CALIBRATION TARGET
The range of spatial frequencies considered is reported in
Table1, noting that the frequency is stated as line pairs per milli-metre, not cycles per pixel as in the example, as this is the typi-cal convention for physitypi-cal typi-calibration targets. The typi-calibration target was mounted on a backing plate that was located at the required depth in the soil using a 2 axis degree of freedom motion control system. This system ensured that the calibration target could be located precisely at the required viewing depth, which provided added confidence that changes observed in
MTF were attributed to varying levels of optical transparency and not misplacement of the calibration target in the soil body. Tests were conducted by placing the calibration target inside the test chamber so that it was viewed through the transparent soil material at depths of 50, 100, and 150 mm.
Factors Affecting Transparency
A number of test scenarios were examined that focused on investigating factors that are known to affect the visual clarity of transparent soil (Table 1), for example (a) refractive index match of the pore fluid, (b) depth of viewing plane, and (c) temperature, and are considered and discussed in the follow-ing sections.
OPTICAL SYSTEM CALIBRATION
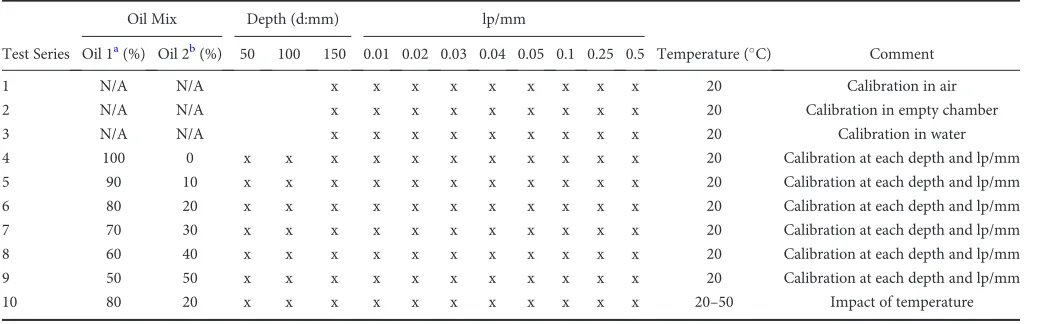
Prior to conducting visualization tests on transparent soil, sev-eral calibration tests were performed as control tests to evaluate the best possible level of visual clarity that could be achieved for the camera, lens, and target combination. Calibration images were captured for targets of increasing spatial frequency from 0.01 to 0.5 lp/mm for the target viewed in air and at a depth of 150 mm inside the test chamber when empty and filled with water. The MTF signal modulation was determined for each case and is presented inFig.8. For the target in air, it is evident that the loss of resolution was low, reducing to only 0.96 for the highest target spatial frequency. When the transparent soil con-tainer is introduced into the system, the MTF values are slightly worse than the in-air case, illustrating the effect of the transpar-ent Perspex sidewalls on the maximum possible MTF value in the absence of transparent soil using this apparatus.
CALIBRATION OF OPTIMUM OIL BLEND REFRACTIVE INDEX MATCH
[image:9.612.56.579.82.244.2]The MTF for a calibration target with increasing spatial fre-quency viewed through a soil depth of 150 mm is presented in
TABLE 1 Tests conducted for transparency assessment using MTF.
Oil Mix Depth (d:mm) lp/mm
Test Series Oil 1a(%) Oil 2b(%) 50 100 150 0.01 0.02 0.03 0.04 0.05 0.1 0.25 0.5 Temperature (C) Comment
1 N/A N/A x x x x x x x x x 20 Calibration in air
2 N/A N/A x x x x x x x x x 20 Calibration in empty chamber
3 N/A N/A x x x x x x x x x 20 Calibration in water
4 100 0 x x x x x x x x x x x 20 Calibration at each depth and lp/mm
5 90 10 x x x x x x x x x x x 20 Calibration at each depth and lp/mm
6 80 20 x x x x x x x x x x x 20 Calibration at each depth and lp/mm
7 70 30 x x x x x x x x x x x 20 Calibration at each depth and lp/mm
8 60 40 x x x x x x x x x x x 20 Calibration at each depth and lp/mm
9 50 50 x x x x x x x x x x x 20 Calibration at each depth and lp/mm
10 80 20 x x x x x x x x x x x 20–50 Impact of temperature
a
Oil 1: Baylube WOM 15.
b
Fig.9, noting that Baylube WOM 15 and N-Paraffin C10-13 are
referred to as oil 1 and oil 2, respectively, in the figure. The adjoining images (Figs.9(b)and9(c)) convey the wide range of
optical clarity of the soil for different oil mix ratios as the target is barely visible at the 60 % oil 1:40 % oil 2 ratio. The MTF anal-ysis confirms that soil with pore fluid mix ratios considerably outside the optimum refractive index match to the soil aggre-gate exhibit rapidly diminishing MTF profiles as spatial fre-quency increases. For example, at oil 2 contents of 0, 40, and
50 %, low levels of optical transmission are achieved across the range of spatial frequency and the MTF decreases to 0.04 for the oil blend of 50 % oil 1:50 % oil 2 at 0.5 lp/mm.
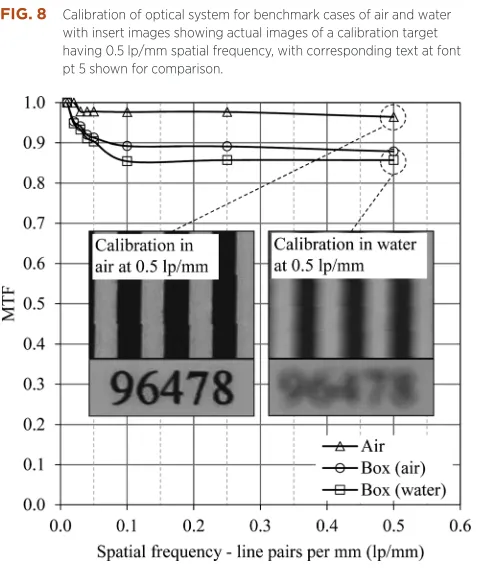
As the oil blend approached the refractive index of the soil aggregate, visibility of the target is improved such that 90 % oil 1:10 % oil 2 and 70 % oil 1:30 % oil 2 produced MTF results that diminished less rapidly than the previous cases. However, as the spatial frequency increased to 0.5 lp/mm, it is evident that resolution is lost as MTF reduced to similar levels as the poorly matched fluid conditions. The greatest optical clarity was achieved for the 80 % oil 1:20 % oil 2 ratio, whereby the MTF yielded significantly higher performance across all spatial fre-quencies, indicating higher resolution is achieved owing to the better refractive match of the pore fluid blend. These results are presented in a similar format inFig.9(d)as the eye evaluation chart method shown inFig.3, such that the optimum clarity in either MTF or visible font size are corrected with oil mix ratio. This data illustrates that patterns of increasing spatial frequen-cies can provide a quantitative measure of transparency when viewed at a given depth in a transparent soil, and therefore enable differentiation of optical quality. It should be noted that Fig.9presents only a coarse pore fluid mix ratio calibration for the purpose of demonstrating and validating the MTF approach; it would be necessary to undertake smaller incremen-tal mix ratio changes to determine the precise optimum fluid combination when calibrating transparent soil for experimental modelling.
IMPACT OF VIEWING DEPTH
A wide range of model geometries have been reported in litera-ture when implementing laser aided image tracking methods of DIC with transparent soil. Stanier (2011) achieved a viewing
FIG. 8 Calibration of optical system for benchmark cases of air and water with insert images showing actual images of a calibration target having 0.5 lp/mm spatial frequency, with corresponding text at font pt 5 shown for comparison.
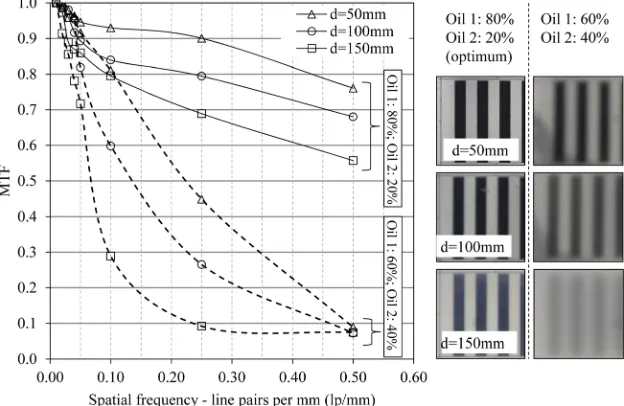
[image:10.612.46.286.77.361.2] [image:10.612.53.545.539.732.2]depth of 100 mm to the plane of interest while still able to detect sufficient texture for tracking; however, Iskander et al. (2002) reported maximum achievable viewing depths in the region of only 50 mm. Clearly the permissible viewing depth will be a function of material transparency. To demonstrate the effect that viewing depth and material transparency have on the abil-ity to resolve detail, a series of tests were conducted using the optimum fluid ratio 80 % oil 1:20 % oil 2 and a poorly matched fluid 60 % oil 1:40 % oil 2. Viewing depths of 50, 100, and 150 mm were considered as these reflected those previously identified in literature.Figure10presents the MTF relationship measured for the three depths to the measurement plane along with corresponding images captured of the 0.1 lp/mm calibra-tion target for the optimum and poorly matched pore fluids. The images qualitatively illustrate that as the viewing depth increases, the ability to resolve the image detail diminishes,
particularly so for the case of the poorly-matched fluid; this is quantitatively captured in the MFT relationships. This is illus-trated in more detail inFig.11in which the MTF values for each
[image:11.612.254.566.94.297.2]spatial frequency is plotted against viewing depth, with the opti-mum pore fluid (Fig.11(a)) providing MTF values greater than 0.5 for even the highest spatial frequency tested (0.5 lp/mm), whereas the same frequency pattern is severely degraded (MTF value lower than 0.1) in the poorly matched fluid (Fig.11(b)) even at a viewing depth of 50 mm. This data clearly illustrates that speckle patterns, upon which the DIC measurement tech-nique is reliant, would be severely limited depending on the spa-tial frequency of the pattern. The correlation of MTF values with speckle pattern texture are discussed later in the manu-script by way of a practical demonstration of the impact of opti-cal transparency and the ability to resolve texture for DIC measurement.
FIG. 10
Calibration of fumed silica aggregate transparent soil to determine the impact of viewing depth on optical transmission for oil mix ratio blend (i) oil 1: 80 %; oil 2: 20 % and (ii) oil 1: 60 %; oil 2: 40 % at 0.1 lp/mm at depths of 50, 100, and 150 mm using MTF with corresponding images of the calibration target.
FIG. 11
[image:11.612.205.567.552.734.2]IMPACT OF TEMPERATURE
It is well-established that the refractive index is influenced by temperature; hence, within the context of transparent soil mod-elling, it is necessary to ensure that calibration and subsequent tests are conducted at constant temperature. In many cases reported in the literature, calibration was conducted in a tem-perature controlled environment nominally maintained at 20C, although it is worth noting that this is not always possi-ble. For example,Ezzein and Bathurst (2014)report on geo-grid pull-out interaction tests conducted in a large scale test box 3.7 m long whereby it was not possible to conduct tests in a temperature controlled environment.
[image:12.612.60.543.103.305.2]The impact of temperature on soil transparency is por-trayed inFig.12for the optimum soil mix ratio of oil 1: 80 %:oil 2: 20 %, calibrated at 20C, for increased temperatures of 25C–50C, viewed at a soil depth of 50 mm. Note, owing to the requirement to elevate the soil temperature, an alternative experimental configuration was necessary for this test sub-set whereby the chamber containing soil was submerged in a water bath in order to provide a constant boundary temperature con-ditions maintained by the surrounding heated water. For this reason, the 20data presented inFig.12is not directly compara-ble with that at 20, viewed at 50 mm soil depth presented in Fig.10. The reduced MTF values evident inFig.12are due to the
[image:12.612.218.556.505.744.2]FIG. 12 Effect of temperature on fumed silica transparent soil having oil ratio [oil 1: 80 %; oil 2: 20 %] at a viewing depth of 50 mm; (a) MTF versus spatial frequency, (b) actual images and (c) signal modulation.
FIG. 13
additional reduction in visual clarity caused by the additional depth of water in front of the chamber when placed in the water bath.
It is clear that changes in soil temperature have a detrimen-tal effect on optical quality as confirmed by the progressive reduction in MTF and loss of signal contrast with increasing temperature as the soil deviates from the calibration tempera-ture (Fig.12(a)). Figure12(b) illustrates an image of the same line-pair pattern at the calibration temperature of 20C and an elevated temperature of 50C. In this example, the related change in refractive index of the pore fluid has both reduced the contrast of the pattern but also increased the mean intensity of the image (Fig.12(c)). This confirms that temperature should be a consideration and controlled in transparent soil model tests. However, if the temperature changes can be kept to a few degrees,Fig.12illustrates that temporal changes are not as criti-cal to overall opticriti-cal quality of the transparent soil medium as other factors such as viewing depth or poor initial optical match. Additional discussion regarding the impact of tempera-ture effects are reported by Black and Tatari (2015) whereby the change in refractive index and consequent change in pixel intensity are used advantageously to investigate the behavior of thermal energy piles by visually observing heat flow in piles.
Relevance of MTF to DIC
Measurements
Along with the quality of the sub-pixel interpolation scheme, one of the most important factors influencing the precision and accuracy of DIC is image texture (e.g., Take 2015). Image tex-ture describes the degree of variation in pixel intensity values
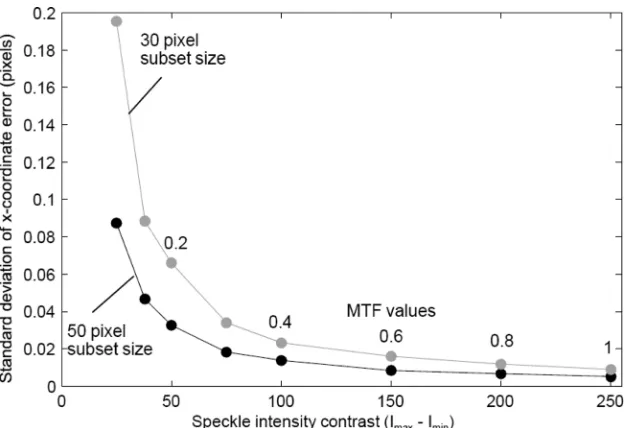
within an image subset. A considerable amount of research has been undertaken in the DIC community to quantitatively address the assessment of image texture, the role played by sub-set size, and the impact of both of these factors on the precision and accuracy of DIC measurements (e.g.,Sutton et al. 2009;Pan et al. 2008,2009,2010). In this section, the relevance of MTF on image texture with particular emphasis on its subsequent effect on the precision of DIC results will be illustrated using numerically-generated images to demonstrate the underlying philosophy. The images used for this discussion consist of a 1000 by 1000 pixel black canvass, onto which 5000 points of white light were randomly assigned to sub-pixel locations uni-formly throughout the image (Fig.3). Following the procedure described in detail by Take (2015), each point of light that makes up the speckle pattern ofFig.13has a non-integer pixel position of the centre and a shape defined by a Gaussian inten-sity profile of size of 10 pixels, a maximum inteninten-sityImaxout of a maximum 8-bit scale of 255. For this example, this speckle pattern was created with an Imax value of 250 and Imin of 0 intensity. Images were then created at progressively lower con-trasts (i.e.,Imax–Iminvalues) of 100 and 25 illustrated inFig.13 to create the same speckle pattern, but at dramatically different contrasts. These images were then infected with a uniformly distributed white noise with a maximum magnitude of 4 % of the full-scale intensity to the image pairs to include the influ-ence of sensor noise. Expressed in another way, these digitally generated images roughly approximate a MTF value of 0.4 and 0.1, respectively.
[image:13.612.254.567.89.303.2]DIC tracking on a rectangular grid of subsets (19 rows and 19 columns) of size 30 and 50 pixels square was performed between the two nominally identical images (i.e., the same speckle pattern except for different fields of random white
FIG. 14
noise) created at each contrast value to observe the resulting error in the DIC measurements, when subject to a rigid body image translation of 10 pixels. This error, expressed as the standard deviation of the x-positon coordinate of these 361 measurements of subset movement, is presented in Fig.14for eight speckle patterns of progressively reducing contrast. These results indicate that the noise resulting in a loss of speckle pattern contrast is not a linear function of speckle intensity con-trast. Instead, there exists a threshold contrast below which the precision of DIC measurements is severely compromised. In this particular example, despite the original high-contrast of the original speckle pattern, a reduction in contrast associated with a MTF value of 0.2 or less will result in poor quality DIC results. It should be noted that the relationship between DIC measure-ment noise and speckle pattern intensity contrast inFig.14is a function of patch size, spatial frequency of the initial speckle pattern, and the magnitude of the random white noise in the imaging system. However, this illustrative example demon-strates the concept of limiting threshold texture intensity and a methodology to assess texture-based noise due to a loss of con-trast arising from light scattering due to non-ideal transparent soil media. For a particular experimental setup, a similar frame-work could be used to assess the maximum depth of transpar-ency based on an acceptable level of precision required for each physical modelling application.
Conclusions
Transparency of the soil dictates the overarching success of the technique; however, despite this fundamental requirement, no quantitative framework has yet been established to appraise the visual quality of transparent soil. Previous approaches such as the eye chart assessment are highly subjective and operator dependant; thus an independent assessment method is neces-sary. This paper proposed such a method for quantitatively assessing the optical quality of transparent soil based on the optical calibration method, MTF. The work explored this hypothesis and assessed the potential for MTF to quantify the optical quality of transparent soils for a number of aspects including (i) optimum oil blend ratio, (ii) depth of viewing plane, and (iii) temperature. Verification of the results con-firmed that MFT offers a robust and reliable method of quanti-tatively measuring of the optic quality of transparent soil. The impact of reduced soil transparency, correlated with MTF, was demonstrated using a practical example to investigate the view-ing depth at which the accuracy and precision of DIC to track speckle patterns in transparent soil is severely compromised. The successful methodology implemented in this paper offers researchers engaged in transparent soil physical modelling a new reliable method of assessing soil transparency that has the potential to make a positive contribution to enhancing measure-ment resolution and capabilities of experimeasure-mental systems.
References
Ahmed, M. and Iskander, M., 2010, “Analysis of Tunnelling Induced Ground Movements Using Transparent Soil Models,”
J. Geotech. Geoenviron. Eng., Vol. 137, No. 5, pp. 525–535. Allersma, H., 1982, “Photoelastic Investigation of the Stress
Dis-tribution During Penetration,”Penetration Testing, Volume 2: Proceedings of the Second European Symposium on Pene-tration Testing, Amsterdam, The Netherlands, May 24–27, CRC Press, Boca Raton, FL, pp. 411–418.
Andrawes, K. and Butterfield, R., 1973, “The Measurement of Planar Displacements of Sand Grains,”Geotechnique, Vol. 23, No. 5, pp. 571–576.
Black, J. A., 2012a, “Ground displacement during press-in piling using transparent soil and PIV,” Singapore, Dec 6–7, IPA, Tokyo, Japan, pp. 1–8.
Black, J. A., 2012b, “Soil Sample Disturbance During Site Investigation: Soil Sample Disturbance During Site Inves-tigation,”Technical Report to Environmental Scientifics Group (ESG)–Geotechnical Services Division, ESG, Staffordshire, UK. Black, J. A. and Tatari, A., 2015, “Transparent Soil to Model
Thermal Processes: A Thermal Pile Example,” ASCE Geo-tech. Test. J.(in press).
Butterfield, R., Harkness, R., and Andrawes, K., 1970, “A Stereo-Photogrammetric Method for Measuring Displace-ment Fields,”Geotechnique, Vol. 20, No. 3, pp. 308–314. Chen, J. and Wada, N., 1986, “Visualization of Immiscible
Dis-placement in a Three-Dimensional Transparent Porous Medium,”Exp. Fluids, Vol. 4, No. 6, pp. 336–338.
Desrues, J., Chambon, M., and Mazerolle, F., 1996, “Void Ratio Evolution Inside Shear Bands in Triaxial Sand Specimens Studied by Computed Tomography,”Geotechnique, Vol. 46, No. 3, pp. 529–546.
Drescher, A. and De Jong, D., 1972, “Photoelastic Verification of a Mechanical Model for the Flow of Granular Material,”
J. Mech. Phys. Solids, Vol. 20, No. 5, pp. 337–351.
Ezzein, F. and Bathurst, R. J., 2011, “A Transparent Sand for Geotechnical Laboratory Modelling,” ASTM Geotech. Test. J., Vol. 34, No. 6, pp. 590–601.
Ezzein, F. and Bathurst, R. J., 2014, “A New Approach to Evalu-ate Soil–Geosynthetic Interaction Using a Novel Pullout Test Apparatus and Transparent Granular Soil,” Geotext. Geo-membr., Vol. 42, No. 3, pp. 246–255.
Forlati, G. and Black, J. A., 2014, “Impact of Pile Geometry on the Installation of Open Ended Press-In Piles,”Proceedings of the 8th International Conference on Physical Modelling in Geotechnics, Perth, Australia, Jan 14–17, CRC Press, Boca Raton, FL, pp. 763–769.
Gill, D., 1999, “Experimental and Theoretical Investigations of Pile and Penetrometer Installation in Clay,” Ph.D. thesis, Trinity College, Dublin, Ireland.
Gill, D. and Lehane, B., 2001, “An Optical Technique for Inves-tigating Soil Displacement Patterns,”Geotech. Test. J., Vol. 24, No. 3, pp. 324–329.
Hall, S., Bornert, J., Desrues, J., Pannier, Y., Lenoir, N., Viggiani, G., and Besuelle, P., 2010, “Discrete and Continuum Analy-sis of Localised Deformation in Sand Using X–RaylCT and Volumetric Digital Image Correlation,” Geotechnique, Vol. 50, No. 5, pp. 315–322.
Proceedings of the 2nd British Geotechnical Association Inter-national Conference on Foundations, Dundee, Scotland, June 24–27, Vol. 1, Taylor and Francis, London, pp. 565–574. ISO 12233:2014, 2014:Photography: Electronic Still Picture and
Imaging, Resolution and Spatial Frequency Responses, ISO, Geneva, Switzerland.
Iskander, M., 2010,Modelling With Transparent Soils: Visualiz-ing Soil Structure Interaction and Multi Phase Flow, Non-Intrusively, Springer, New York.
Iskander, M., Lai, J., Oswald, C., and Mannheimer, R., 1994, “Development of a Transparent Material to Model the Geo-technical Properties of Soils,”ASCE Geotech. Test. J., Vol. 17, No. 4, pp. 425–433.
Iskander, M. and Liu, J., 2010, “Spatial Deformation Measure-ment Using Transparent Soil,”ASCE Geotech. Test. J., Vol. 33, No. 4, pp. 314–321.
Iskander, M., Liu, J., and Sadek, S., 2002, “Transparent Amor-phous Silica to Model Clay,” J. Geotech. Geoenviron. Eng., Vol. 128, No. 3, pp. 262–273.
Iskander, M., Sadek, S., and Liu, J., 2003, “Optical Measurement of Deformation Using Transparent Silica Gel to Model Sand,”Int. J. Phys. Modell. Geotech., Vol. 2, No. 4, pp. 13–26. Kelly, P., 2013, “Soil Structure Interaction and Group Mechan-ics of Vibrated Stone Column Foundations,” Ph.D. thesis, University of Sheffield, Sheffield, UK.
Konagai, K., Tamura, C., Rangelow, P., and Matsushima, T., 1992, “Laser Aided Tomography: A Tool for Visualization of Changes in the Fabric of Granular Assemblage,”Struct. Eng. Earthq. Eng., Vol. 9, No. 3, pp. 193–201.
Liu, J. and Iskander, M. G., 2010, “Modelling Capacity of Trans-parent Soil,”Can. Geotech. J., Vol. 47, No. 4, pp. 451–460. Liu, J., Iskander, M., and Sadek, S., 2002, “Optical Measurement
of Deformation Under Foundations Using a Transparent Soil Model,”International Conference on Physical Modelling in Geotechnics, St. Johns, Newfoundland, Canada, July 10–12, R. Phillips, P. J. Guo and R. Popescu, Eds., CRC Press, Boca Raton, FL, pp. 155–159.
Liu, J., Iskander, M., and Sadek, S., 2003, “Consolidation and Permeability of Transparent Amorphous Silica,” ASCE Geotech. Test. J., Vol. 26, No. 4, pp. 1–12.
McKelvey, D., 2002, “The Performance of Vibro Stone Column Reinforced Foundations in Deep Soft Ground,” Ph.D. thesis, Queens University, Belfast, Northern Ireland.
McKelvey, D., Sivakumar, V., Bell, A., and Graham, J., 2004, “Modelling Vibrated Stone Columns in Soft Clay,” Proc. Inst. Civ. Eng. Geotech. Eng., Vol. 157, No. 3, pp. 137–149. Ni, Q., Hird, C., and Guymer, I., 2010, “Physical Modelling of
Pile Penetration in Clay Using Transparent Soil and Particle Image Velocimetry,”Geotechnique, Vol. 60, No. 2, pp. 121–132.
Pan, B., Lu, Z., and Xie, H., 2010, “Mean Intensity Gradient: An Effective Global Parameter for Quality Assessment of the Speckle Patterns Used in Digital Image Correlation,” Opt. Lasers Eng., Vol. 48, No. 4, pp. 469–477.
Pan, B., Qian, K., Xie, H., and Asundi, A., 2009, “Two-Dimen-sional Digital Image Correlation for In-Plane Displacement and Strain Measurement: A Review,” Meas. Sci. Technol., Vol. 20, No. 6, 062001.
Pan, B., Xie, H., Wang, Z., Qian, K., and Wang, Z., 2008, “Study on Subset Size Selection in Digital Image Correlation for Speckle Patterns,”Opt. Exp., Vol. 16, No. 10, pp. 7037–7048. Roscoe, K., Arthur, J., and James, R., 1963, “The Determination of Strains in Soils by an X–Ray Method,”Civ. Eng. Public Works Rev., Vol. 58, Nos. 873–876, pp. 1009–1012.
Sadek, S., Iskander, M., and Liu, J., 2002, “Geotechnical Proper-ties of Transparent Silica,”Can. Geotech. J., Vol. 39, No. 1, pp. 111–124.
Siemens, G., Peters, S., and Take, W. A., 2010, “Analysis of a Drawdown Test Displaying the Use of Transparent Soil in Unsaturated Flow Applications,” 5th International Confer-ence on Unsaturated Soils, Barcelona, Spain, Sept 6–8, CRC Press, Boca Raton, FL, pp. 733–738.
Snellen, H., 1862, Probebuchstaben zur Bestimmung der Seh-scha¨rfe, Publisher, Utrecht, the Netherlands.
Stanier, S. A., 2011, “Modelling the Behaviour of Helical Screw Piles,” Ph.D. thesis, University of Sheffield, Sheffield, UK. Stanier, S. A., Black, J. A., and Hird, C. C., 2012, “Enhancing
Accu-racy and Precision of Transparent Synthetic Soil Modelling,”
Int. J. Phys. Modell. Geotech., Vol. 12, No. 4, pp. 162–175. Stanier, S. A., Black, J. A., and Hird, C. C., 2013, “Modelling
Helical Screw Piles in Clay and Design Implications,”Proc. Inst. Civ. Eng. Geotech. Eng.(available online).
Sutton, M. A., Oreu, J.-J., and Schreier, H. W., 2009,Image Cor-relation for Shape, Motion and Deformation Measurements, Springer, New York.
Take, W. A., 2015, “Thirty-Sixth Canadian Geotechnical Collo-quium: Advances in Visualization of Geotechnical Processes Through Digital Image Correlation,”Can. Geotech. J. (avail-able online).
Taylor, R. N., Grant, R. J., Robson, S., and Kuwano, J., 1998, “An Image Analysis System for Determining Plane and 3-D Dis-placements in Soil Models,”Proceedings of Centrifuge ’98, To-kyo, Japan, Sept 23–25, Taylor & Francis, London, pp. 73–78. United States Air Force, 1951, Resolution Test Chart, United
States Department of the Air Force, Washington, D.C. White, D., Take, W., and Bolton, M., 2003, “Soil Deformation

![FIG. 12Effect of temperature on fumed silica transparent soil having oil ratio [oil 1: 80 %; oil 2: 20 %] at a viewing depth of 50 mm; (a) MTF versus spatial frequency, (b)actual images and (c) signal modulation.](https://thumb-us.123doks.com/thumbv2/123dok_us/7870526.181902/12.612.60.543.103.305/effect-temperature-transparent-viewing-versus-spatial-frequency-modulation.webp)