A New Approach to Multimedia Information Filtering
Based on its Structure
Xiaodi Huang1 and Jianming Yong 2
1 Department of Mathematics and Computer Science, Faculty of Science 2Depatment of Information Systems, Faculty of Business
University of Southern Queensland [email protected]
Abstract In information filtering systems, the documents are sequentially presented to the users based on the user relevance values.This paper argues that the presented documents should be both important and relevant to the users. Based on this view, a structure based filtering framework is described, which considers the importance and relevance values of documents. An approach, which is used to calculate the importance values of documents, is proposed to improve the representation of user profiles. The experiment results and discussion are given.
Keywords: Centrality, User profiles, Rank, Structure
1. Introduction
As the World Wide Web grows exponentially, it becomes more and more difficult for the users to find the information they want. In order to reduce this information overload, it is useful to prioritize the information. The prioritizing can take the form of highlighting items of high importance or deleting items that are not considered relevant. Information filtering is such an information identifying process in which documents are selected from a stream of incoming data to satisfy a relatively stable and specific information need. Information Filtering is traditionally divided into three types [8]:
•Content-based filtering (also called cognitive filtering): where documents are selected based on correlation between the content of the documents and the user's preferences. Only the content and properties of a document contribute to the filtering, and each user operates independently. This is a traditional approach.
•Social filtering (also called collaborative filtering): where documents are filtered for a user based upon the likes of other users with similar
tastes. User profiles are used to compare with each other. Groups of similar profiles are identified and users belonging to one group will be presented the same set of documents. Social filtering systems need a number of participants and documents to efficiently work together, which is the major drawback.
•Economic filtering: where documents are filtered based upon cost factors. Such factors can be the relation between cost and benefit of use, or the available network bandwidth and size of the documents.
Hanani, Oard and Belkin et. al. [11, 12, 13] consider that a “good” information filtering can successfully indicate the relevance of incoming documents, and thus protect the user from not relevant information , and without missing relevant information .
Summarily, all current filtering systems consider only the relevance to the users or cost of documents in different ways. However, a document maybe be relevant to the users but not important, or important but not relevant. We argue that a system should provide the users with relatively important and highly relevant documents. Generally, a document in the collection has the following characteristics:
• Importance
influential papers firstly. We are concerned here with not only the relevant content, but also their important roles in the large volume of relevant information.
• Relevance
Relevance is a confusing and much debated concept. The generally accepted theoretical conceptualization of relevance involves the relationship between a user's information problem or need and the information that can solve the problem. The operational conceptualization involves a user's decision to accept or reject information retrieved from an information system [2].
The importance involves the relationships between documents in the collection, while the relevance indicates the relationships between the documents and the users.
In this paper, we propose a new approach, called a structure _based filtering, which combines both the importance and the relevance values of a document. Links between the documents provide a natural mechanism for quantifying notions of “importance”. More specially, a link can indicate the judgment of the author of one document as to the importance of another document. The proposed approach firstly extracts the link structure of a document collection. Then it employs a notion of centrality widely used in social network analysis to measure the importance values of documents. Finally, all documents in the collection are ranked by their overall ranking scores which are calculated with consideration of both the importance and the relevance values of the documents.
2
. Structure Based Filtering
Framework
The overall problem of information filtering can be broadly described as learning a map from a space of documents to the space of user relevance values. More precisely, we denote the space of documents as D and space of user relevance values as R. The objective is to learn a map f :D→R such that f(d) corresponds to the ranking score of a document d. Given that such a map is known for all points in D, a
finite set of documents can always be rank-ordered and presented in a prioritized fashion to the user [5]. In the framework, we decompose the map into two levels in two parallel lines as shown in Figure 1. The higher level in the first line represents a structure mapping f11 from the document space to a connected graph, where the nodes represent the documents, and the edges represent link relationships between the documents. That is, f11:D×D→G(V,E). This
mapping is learned in an off-line setting, based on the link analysis of collection of documents. The lower level in the first line subsequently employs another mapping f12 from the structure graph G to a set of importance values of nodes in the graph G, which measure how much the important roles of documents in the collection are, i.e., f12:V →Rn.
Figure 1 The Mappings of the Structure based Filtering
In the second line, the higher level partitions the document space into m classes by a clustering technique, i.e., f21:D→{C1, ,Cm}. The lower
level then estimates the mapping f22 describing user relevance for the different classes, i.e.,
s
m R
C C
f22:{ 1, }→ [5]. The whole mapping f will be finished by combination of all those mappings.
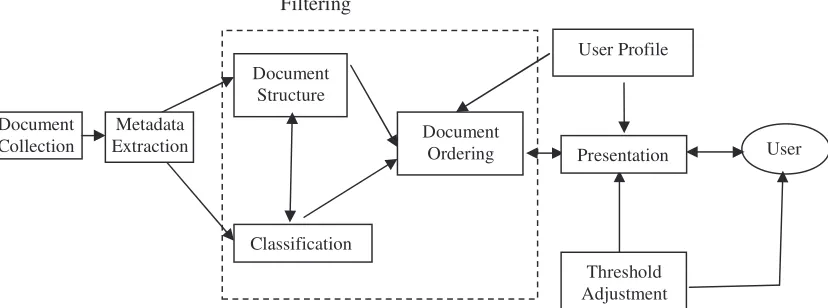
Figure 2 shows a conceptual architecture of structure based filtering systems. Basically, it is composed of four components: Document Collection, Metadata Extraction, Filtering Engine and User Profiles.
Document Collection: It might be web sites, a set of databases, email folders and so on.
Metadata Extraction: It extracts potentially relevant information, and passes it to a filter engine. A relation between documents can be established on a basis of various attributes of documents, such as whether there exists a reference between one document and another or they have common keywords. With this information, the characteristics of the document collection can be derived and analyzed.
Document Structure: Based on the information from
G(V,E)
{C1,…, Cm}
Rn(d)
Rs(d)
R(d)
f11 f12
f22
Figure 2 The Conceptual architecture of Structure based filtering Systems
metadata extraction, Document Collection can be represented as a graph, where a node represents a document, and an edge represents the link relationship between two documents.
Classification: The documents are classified into a finite number of classes by using a clustering technique.
Document Ordering: The documents are ranked in terms of their ranking scores, which combine both importance and relevant values of documents. User Profile: A vector to represent user’s preference. More importantly, user profiles are used for comparing documents to find the important and relevant documents for users, and also for grouping the users. The importance values of documents are combined into user files as a common feature of every user.
Presentation: The documents are sequentially presented to the user in a priority form.
There is also a feedback mechanism in the framework to improve performance of the system.
3. NodeRank: A Ranking for A Node
in the Graph
As mentioned before, the relationships between the documents in a collection can be extracted into a connected graph. After this, we need a function, i.e., f12 , to map every node of this graph into a real value of importance, which can indicate the important position of a corresponding document in the collection. Fortunately, we can employ the measure of “centrality” used in social network analysis as a basis of the mapping.
Centrality refers to the importance of a particular node in a network. The measures of centrality have been developed to “attempt to describe and measure properties of ‘actor location’ in a social network” [3]. In a document collection, the relationships between documents are composed of a graph. The importance of a document in such a graph can be measured by documents passed through it, or it can easily reach other documents in the collection. Or it is itself directly connected to other documents. From this perspective, the role of a document can be a function of its position in a given network.
There currently exists a variety of centrality measures developed, but the measures are roughly classified into three major types: degree, closeness, and betweenness centrality , which are defined as follows.
Definition 1 (Freeman) Degree Centrality: Degree centrality of a node refers to the number of edges attached to the node.
Obviously, Degree centrality can be normalized to range from 0 to 1, where 0 means the smallest possible and value 1 the highest possible centrality. The normalized measures are called relative measures of centrality:
1 ) ( ) (
'
− =
n u C u
C D
D
whereC' (u) |{v|(u,v) E v V}|
D = ∈ ∧ ∈ , and n=|V|. Degree centrality reflects the direct relationships of a document with other documents in the collection. It indicates the number of links connecting adjacent Document
Collection
Document Structure
Document Ordering
Classification
User Profile
Filtering
Threshold Adjustment
Presentation User Metadata
nodes to a local node, so it is a local centrality.
Definition 2 (Freeman) Closeness Centrality is the sum of geodesic distances, defined as the shortest path connecting two nodes, between a node and all others.
∈ − =
V v
C d u v
n u C
) , (
1 )
(
where d(u,v) is the shortest path between nodes u and v , which is equal to the number of edges between them. Measures of centrality based on closeness reflect a node’s freedom from the controlling actions of others, their capacity for independent action within the network. This measure actually indicates how far a node is from all others. A node with higher closeness score is less centralized one than a node with lower closeness score. The most central nodes can quickly interact with all other nodes because they are close to all others.
Definition 3 (Freeman) Betweenness Centrality of a node u is the sum of probabilities across all possible pairs of nodes, and that the shortest path between nodes uj and uk pass through node u.
= −
=
= n j
j
k jk g u
CB
1 1
1
' ( ) ,
2 / ) 2 )( 1 (
) ( )
(
'
− − =
n n
u C u
C B
B
Centrality measures based on betweenness reflect the intermediary location of a node along indirect relationships linking other nodes. Betweenness centrality “measures the extent to which a particular point lies ‘between’ the various other points in a graph: a point of relatively low degree may play an important ‘intermediary’ role and so be very central to the network” [4]. A node with high betweenness has a capacity to facilitate or limit interaction between the nodes it links.
Closeness and Betweenness are the global centralities.
Different centrality measures can give quite different results for the same network. It can happen that a node has low degrees, but high betweenness centrality. In order to overcome the drawbacks of single measure, the combination of degree, closeness and betweenness yields the following measure:
) ( )
( )
( )
(u w1C u w2C u w3C u
Rn = D + C + B (1)
where the weights w1, w2, and w3 sum to 1. For simplicity, we can give equal importance to three measures by having equal values of the weights.
Based on above description, we give the follow definition 4.
Definition 4 NodeRank: Let G=(V,E) be an undirected and connected graph. Let f12 be a function which assigns a real value to a node of G. R n(u) is called a NodeRank of node u, and
1 ) (
0≤Rn u ≤ .
Generally, a node has a high NodeRank score, if it has high degree, is easily accessible to (close to) all other nodes, and lies on several geodesics (shortest paths) between other nodes.
4. Document Rank: A Ranking for A
Document in the collection with
consideration of importance
Based on previous description, the ranking score of a document to a given user is calculated as follows:
) ( ) ( )
(d R d R d
R = n × s (2)
where Rn(d) is calculated by equation (1) , and Rs(d)
is the relevance value of a document to a user.
The calculations of Rs(d) are different in current
filtering systems. The main techniques include relevance feedback and collaborative filtering, such as, the Rocchio’s vector space feedback model [9] , and Roberstson’s probabilistic networks[10].
We can also write equation (2) in the matrix form as follows:
] [ ] [ ]
[nm Rsnm Rnm m
R × = × × (3)
Where
n : The number of users in the system m: The number of documents in the collection
] [nm s
R × : A users-by-documents matrix,
where its entry Rij is the ranking score of the j-th
document for the i-th user. ]
[m m n
R × : A diagonal matrix made up of the
like this,
⋅
m s s s
R R R
2 1
.
The ranking scores of documents are composed of two parts: one is the importance value and another is the relevance value. From above formulas, it is easy to know the documents, which have both a highly important position in the collection and a highly relevant to users, will be presented in high priorities.
From the perspective of the structure based information filtering, a document collection can be formally represented as a 5-tuple graph:
) , , , ,
(V E
µ
fλ
G= where V is the set of nodes to represent the documents, E⊆V×V is the set of edges to indicate the relationships between the documents
µ
:V →LV is a function assigning labels to the nodes, f :V →ℜ is a function assigning the important values to the nodes, andℜ →
E :
λ
, a function assigning weights to the edges. In this definition, LV is the set of node labels.For simplicity, suppose the weight of every edge in the graph is 1, and we restrict our considerations to undirected and connected graphs.
In summery, we have the following theorem.
Theorem 1 Let D be a set of documents, and a mapping f :D→ℜ . Let
τ
∈ℜ be a positive real threshold value which is between 0 and 1. The following properties of thestructure based filtering hold true:1. 0≤R(d)≤1,d∈D
2. Fτ ={d|R(d)≥
τ
∧d∈D} 3. Fτ ⊆ D4. O(d1)<O(d2), if R(d1)≥R(d2) and τ
F d d1, 2∈
5. O(d)=0, if d∈D\Fτ
where
Fτ : A set of remaining documents corresponding to τafter filtering
O(d) : The presented order number of document d , and a positive integer. If O(d) = 0, the document d will be filtered .
R(d): A ranking score of document d , which can be calculated by formulas (1) and (2)
5. Experiment
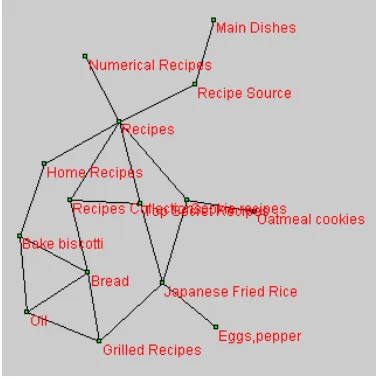
In this experiment, the structure of a small document collection on receipts is analyzed. Pages and links of this collection are gathered by using web crawling software named webCrawler. The results are shown in Figure 3.
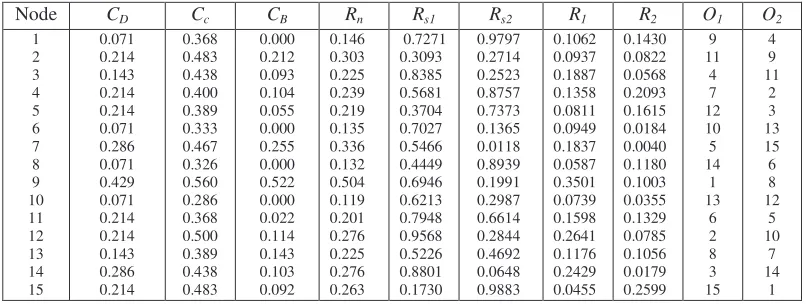
Table 1 illustrates the centrality indices and the ranking scores of the collection .The third column of Table 1 shows the Betweenness Centrality indices of the nodes. Betweenness Centrality indices “allow a research to compare different networks with respect to the heterogeneity of the betweenness of the members of the networks” [3]. As shown in Table 1, Recipes node is a prominent node with respect to those measures compared with the other nodes in the collection. From the table, different centrality index may lead to different interpretation. Node 1, for example, has the same Closeness centrality value as that of node 11, but big different in the Betweenness centrality. As mentioned before, different centrality measures have different focus aspects of structure of the network. Therefore, we use combination of them in equation (1) as the importance values, rather than a single centrality measure.
Figure 3 The Structure of A Small Document Collection on Recipes
Centrality Indice and Importance Value
0 0.1 0.2 0.3 0.4 0.5 0.6
1 3 5 7 9 11 13 15
Document
V
al
ue
Cd Cc Cb Rn
Figure 4 Comparisons of Centrality Indices and Importance Values
“Hub” is a transitional document throughwhich the users move to certain destinations, while “sink” tends to be a final destination.
Figure 4 illustrates the centrality indices and importance values of documents in the collection.
Suppose there are two users, and their relevance vectors, i.e. the user relevant values of the documents, are Rs1 and Rs2 as shown in the Table 1. We can then construct users-by-documents matrix Rs and the importance value of diagonal matrix Rn. Therefore, the ranking scores of documents are calculated according to formula (3):
n sR
R
R=
[
]
=
⋅ ⋅ ⋅
⋅ ⋅ ⋅
0.2630 0.3030
0.1460
0.9883 0.2714
0.9797
0.1730 0.3093
0.7271
[
0.14300.1062 0.08220.0937 0.25990.0455]
⋅ ⋅
⋅ ⋅
=
The results are also shown in Table 1. Note that the order number for document 9 to be presented to the user 2 is only 8, although it has highest importance value in the collection.
For the user 1, if the threshold τ = 0.06 is chosen, then documents 15 and 8 will not be presented. O1 and O2 in Table 1 also give the ranking order of presentation of documents to users 1 and 2, respectively.
6. Related Work
There exists many information filtering systems. The main mechanisms of these systems involve three problems: how to represent the user’s information (query or profile) and the document set for effect comparison; how to compare above representations? How to use feedback mechanism to improve the performance of systems. Our approach focuses on linking the document collection to the users not for comparison, but for more accurately representing every user’s need. That is, to access the important and relevant information. Actually our approach models common features among diverse user profiles.
The Information Lens system [14] created rules based on the structure of a mail message to filter mails. However, the extracted structure was within a document. Other link analysis of the structure of information include HITS and PageRank algorithms [7, 6], but they used the link structure to improve web search engines.
[image:6.595.310.534.107.200.2]
Table 1 Parameters in the Collection
7. Conclusion
The presentation of user profiles is an important issue in information filtering systems. This paper proposes a new approach to determining the importance values of documents in the collection to form part of user profiles, on the assumption that every user needs both important and relevant documents. This approach employs the concept of centrality used in social network analysis to explore different roles of documents, and then gives overall ranking scores of documents together with relevant values. Our approach explicitly takes advantage of the link structure of documents. It thus does not depend on the contents of documents. The future work will include more applications.
Reference
[1] Freeman, L.C. "Centrality in social networks: I. Conceptual clarification." Social Networks, 1:215-39.1978,Cambridge University Press. [2] Linda Schamber: Relevance and Information
Behavior. Annual Review of Information Science and Technology(ARIST), 29:3-48, 1994
[3] Wasserman, Stanley and Katherine Faust (1994). Social Network Analysis: Methods and applications
[4] Scott, John (2000). Social Network Analysis: A Handbook, London: Sage.
[5] J.Mostafa,S.Mukhopadhyay, M.Palakal,W.La m, A Multilevel Approach to Intelligent Information Filtering: Model, System, and
Evaluation, ACM Transactions on Information Systems, Vol. 15, No. 4, October 1997, Pages 368–399.
[6] L.Page, S. Brin, R. Motwani, and T. Winograd, "The PageRank Citation Ranking: Bringing Order to the Web", January 1998.
[7] J. Kleinberg, "Authoritative Sources in a Hyperlinked Environment", Proc. 9th ACM-SIAM Symposium on Discrete Algorithms, 1998.
[8] T.W. Malone, et al.: Intelligent Information-Sharing Systems, Communications of the ACM (1987) Vol. 30 No. 5, pp. 390-402. [9] J. Rocchio. Relevance feedback in information
retrieval. pages 313–323, 1971.
[10] S. F. Robertson. The probability ranking principle. Journal Of Documentation, pages 294–304, 1977.
[11] Hanani, U., Shapira, B. and Shoval, P., 2001, "Information Filtering: Overview of issues, research and systems", User Modeling and User-Adapted Interaction 11, 203-259. [12] Oard W.D."The state of the art in text
filtering". User Modeling and User Adapted Interaction(UMUAI) 7(3), 141-178,1997. [13] Belkin N.J., and Croft, W.B. (1992),
"Information filtering and information retrieval two sides of the same coin? Communications of the ACM 35(12), 29-38.
[14] Malone, T.W., Grant,K.R., Rao, R.et.al. Semi structured messages are surprisingly useful for computer-supported coordination. ACM Trans. Off. Inf.Syst. 5, 2, 115-131, 1987.
Node CD Cc CB Rn Rs1 Rs2 R1 R2 O1 O2