Solar09, the 47th ANZSES Annual Conference
29 September- 2 October 2009, Townsville, Queensland, Australia
1
User-controlled Energy Consumption in a Transparent Electricity System
Fouad Kamel
Faculty of Engineering & Surveying Electrical, Electronic & Computer Engineering
University of Southern Queensland, Toowoomba, Queensland e-mail: [email protected]
Abstract
The paper is describing a dynamic smart grid technique applicable in a transparent electricity market where the end-user is enabled to be acting on controlling or curtailing own demand according to received information about market conditions on the internet. Computer-controlled switches are giving users the ability to control and curtail demand on user’s premises as necessary following a preset strategy. This technique is proposed for Eastern and Southern Australia where the Australian Energy Market Operator AEMO (2009) is presently publicly communicating such simultaneous information on electrical market conditions on the internet. The approach is pursuing improved use of electrical energy associated with improved energy management, reduced electricity prices and reduced pollution caused by electrical generation.
Keywords:
Electrical energy generation, electricity distribution, peak demand, plant capacity factor, electricity supplier, electricity user, demand side response, smart grid.
Introduction
The traditional user-supplier rapport in the electrical energy market has historically evolved following a strategy implying whenever a load is switched on it is expected to be fulfilled by the supplier at the expected time and quality. Growing electrical demands followed by constantly growing supply led to troubled electrical services manifested by technical and economic deficiencies and critical environmental impacts. Peak demands are usually associated with compromised quality, risk of forced outages and high-priced energy supply; while low-demands on the other side might be driving power plants to be operating at compromised economic viability. The situation came to an extent at which electrical suppliers, at their end, needed an operating scheme, where they can identify and prioritise demand while users at the other end, needed to be aware of supplier capabilities and network conditions. A demand-side-response such as the scheme presented in frame of this work aims at allowing electricity purchasers deciding about purchasing electricity at a certain time and price.
Solar09, the 47th ANZSES Annual Conference
29 September- 2 October 2009, Townsville, Queensland, Australia
2 based on cost) and make a foregoing judgement on the value of the purchased product. This does not mean they go without, but they may advance or delay a purchasing.
Background
The Australian Energy Market Operator AEMO (2009) is managing power flows across the Australian Capital Territory, New South Wales, Queensland, South Australia, Victoria and Tasmania. Western Australia and the Northern Territory are not connected primarily because of their geographic distance from the rest of the market. The
electricity market is comprised of a wholesale sector and a competitive retail sector. All electricity dispatched in the market must be traded through the central spot market.
Figure 1 is an example of an actual energy demand and prices situation broadcasted every 30 minutes on the internet by the AEMO (2009). The price curve is closely following the demand curve. Electricity prices are typically at their lowest level at night during times of low demand (off-peak). Prices usually rise according to two major peak demands at day-time; mornings from 9 AM to 14 PM and evenings from 17 to 20 PM. For most residential electricity customers, electricity pricing doesn't vary; instead, consumers typically pay one set price regardless of the time of day.
Figure 2 illustrates the occurrence of electricity demand supplied in Queensland during the year 2008 as extracted from data of the AEMO (2009). The figure indicates mainly the fact that the higher the load above the base load the lesser likely the extent of their duration will be. Base load power stations are those operated twenty four hours per day throughout the year corresponding to a plant capacity factor of 1 providing thus the most economic operation and the least possible energy price. Any loads exceeding the base load are usually covered by other power plants operated for shorter periods at plant capacity factor lesser than 1 providing thus higher energy prices. This implies, the higher the peak demand is the higher the energy price will be. Accordingly, the limited operation of the more expensive power plants makes their operation even more
expensive.
Figure 3 depicts electrical energy demand in Queensland corresponding to a base-load and other load levels.
Solar09, the 47th ANZSES Annual Conference
29 September- 2 October 2009, Townsville, Queensland, Australia
3
Figure 1 Wholesale electricity price in AUD $/MWh and demand in MW for a typical day in Queensland on 5th May 2009; source: The Australian Energy Market Operator
AEMO (2009). .
Energy Demand Queensland 01 Jan-31 Dec 2008 Data source AEMO (2009)
0 1000 2000 3000 4000 5000 6000 7000 8000 9000 10000
0 14 28 43 57 71 85 100
% Time a year
M
[image:3.595.124.489.86.263.2]W
[image:3.595.88.509.358.591.2]Solar09, the 47th ANZSES Annual Conference
29 September- 2 October 2009, Townsville, Queensland, Australia
4
Electric Energy Demand Qld 08 (TWh)
[image:4.595.168.429.83.325.2]Years Energy Demand MWh at base load 4100 MW 36 TWh Years Energy Demand MWh above 6000 MW 3 TWh Years Energy Demand MWh between 5000 and 6000 MW 6 TWh Years Energy Demand MWh between 4100 and 5000 MW 7.3 TWh
Figure 3 Electrical energy demand in Queensland corresponding to a base-load and other load levels.
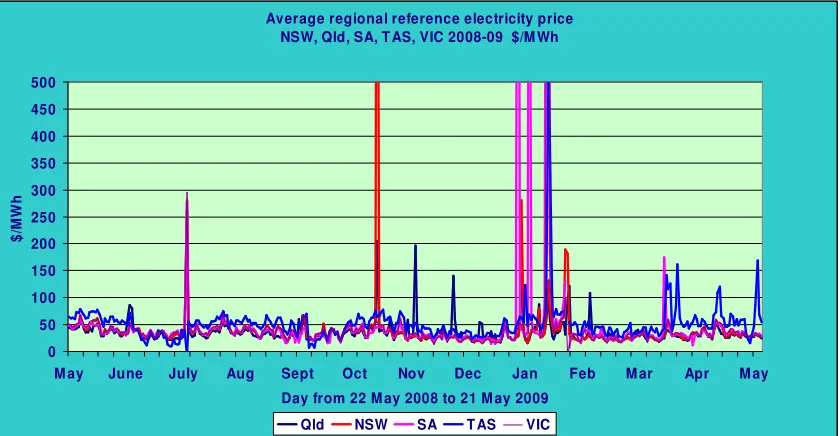
Average regional reference electricity price NSW, Qld, SA, T AS, VIC 2008-09 $/M Wh
0 50 100 150 200 250 300 350 400 450 500
M ay June July Aug Sept Oct Nov Dec Jan Feb M ar Apr M ay
Day from 22 M ay 2008 to 21 M ay 2009
$
/M
W
h
Qld NSW SA T AS VIC
Figure 4 Fluctuation of electricity prices in Queensland, data extracted from the Australian Energy Market Operator AEMO (2009).
Demand Side Response DSR
[image:4.595.89.509.391.609.2]Solar09, the 47th ANZSES Annual Conference
29 September- 2 October 2009, Townsville, Queensland, Australia
5 (2006) is describing demand side response as a tariff or program established to motivate changes in electric use by end-use customers in response to changes in the price of electricity over time. Demand side response provides means for users to reduce the power consumption and save energy. Further on, it maximizes utilizing the current capacity of the distribution system infrastructure, reducing or eliminating the need for building new lines and expanding the system.
The energy users association of Australia targeting a demand-side-response (DSR) action in EUAA (2005) pp20 summarizes that, for example, South Australian electricity consumers only use the highest 10% of their maximum electrical demand on the
network less than 0.5% of the time per year, i.e., for about 40 hours per year. The report is stating further: while the electricity consumers are insulated from price volatility by ‘flat’ electricity prices, they are also paying a significant and undisclosed (hard to evaluate) premium in their retail electricity prices to cover the retail supplier’s costs of managing the risks of the extreme price volatility.
Energy Average Regional Reference Price (RRP) Queensland 01 Jan-31 Dec 2008 data source AEMO (2009)
0 10 20 30 40 50 60 70 80 90 100
0 14 28 43 57 71 85 100
% Time a year
[image:5.595.87.511.306.537.2]R R P E n e rg y W h o le s a le P ri c e $ /M W h
Figure 5 Electricity wholesale price RRP in Queensland in 2008, data extracted from the Australian Energy Market Operator AEMO (2009).
Figure 5 illustrates the occurrence of the regional reference wholesale price RRP in Queensland during the year 2008; extracted from data of the AEMO (2009). The figure indicates mainly that low-priced supplies are taking place at very high occurrences of more than 80% a year, while high prices happen at lower occurrences. For instance, prices around AUD $20/MWh are occurring at frequencies of about 80 %, while prices of over $50/MWh have occurrences of less than 10 %. The scheme presented in this study is aiming at avoiding peak prices.
Solar09, the 47th ANZSES Annual Conference
29 September- 2 October 2009, Townsville, Queensland, Australia
6 real time- either to anticipate problems by recognizing early symptoms or to respond to disturbances already under way.
In a report of DOE) pp.20; while the nation’s transportation sector emits 20% of all the carbon dioxide we produce, the generation of electricity emits 40% – clearly presenting an enormous challenge for the electric power industry in terms of global climate change. Energy (2008) pp.26 reports new approach to electric power adding computers and communications to the existing network. The transition is similar to the one that began two decades ago in telecommunications network. And in pp 41: utilities are now asked to consider reducing demand as an alternative. In this fashion, demand will become the “fifth fuel” after coal, natural gas, nuclear and renewable.
The combined effects of energy efficiency and demand response on the potential for peak demand reduction for the United States as a whole are presented in EPRI (2009) pp5-1 showing savings approaching 43% of the peak demand in 2030. Such savings are capable of not only reducing the need for new generation capacity, but also
compensating for grid reliability problems.
Methodology
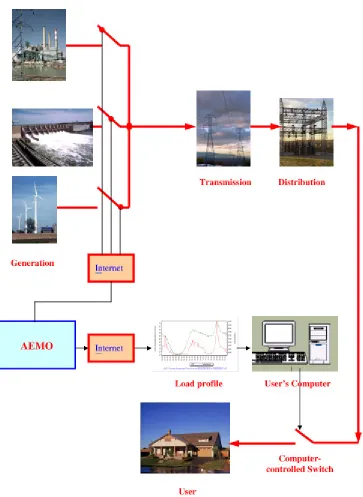
The presented scheme allows electricity users to make use of the continuous and simultaneous information communicated to them on the internet by the Australian Energy Market Operator AEMO (2009) about electricity market conditions helping undertaking information-based decisions. It allows users internally manage, control and at times curtail own loads as necessary. Main tools to achieve that goal are to implement user’s premises with programmable computer-controlled switches enabled to disconnect local loads based on preset energy prises and to alert and encourage users to make use of the scheme.
The scheme is an endeavour towards realizing a smart grid environment, where the electricity market is based on transparency and the end-users are enabled to becoming an active part of the business, undertaking informed decisions at the right time. The smart-grid technology will make use of the internet and modern communication systems to moderate the use of energy at times of peak demand around the clock reflecting so the benefit of the user and supplier. Expanding the scheme shall lead to improved electrical supply system characterized mainly by moderate and controlled energy demands and improved system performance.
Objectives of this work are to achieve reduced peak demand, improved power system supply economics by improving capacity factor of electrical networks and finally reduced transmission and distribution losses by curtailment of load during demand peak events.
Outlines of this scheme are presented in Figure 6, where the Australian Energy Market Operator is managing market conditions, continuously monitoring generators and supplies and broadcasting information on the internet to electricity users. Users then are enabled to control their electric loads through computer-controlled switches. Figure 7
shows customers fully curtailing energy withdrawals at any energy price above
Solar09, the 47th ANZSES Annual Conference
29 September- 2 October 2009, Townsville, Queensland, Australia
7
Discussion
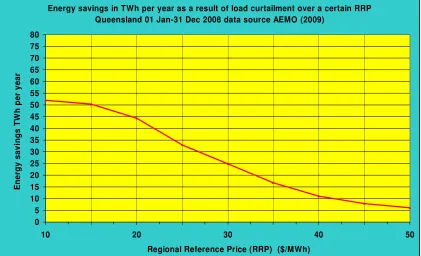
Referring to Figure 8, the scheme is able to remove 6.1 TWh/year from a total of 52.2 TWh/year if users are setting switches to curtail own loads at any RR prices above $50/MWh; this is a percentage of 11.7 % of the total demand. In case the users chose to curtail their loads at $40/MWh, the savings will be 11.1 TWh/year; a percentage of 21.2%, and 24.8 TWh/year at a $30/MWh curtailment; a 47.5%. Referring to the fact that actual load-price curves are presently being publicly accessible on the AEMO website and computer-controlled switches have been recently introduced to the market, the scheme is today readily applicable.
Conclusions
The study introduces the use of computer-controlled switches to control peak electrical demand by curtailing or shifting loads to different times of a day when the demand is less strained. Providing consumers, on the internet, with the information needed to control own electricity demand allows them to be consciously and proactively reducing and optimizing their energy consumption. The scheme is helping thus achieving
Solar09, the 47th ANZSES Annual Conference
29 September- 2 October 2009, Townsville, Queensland, Australia
8
[image:8.595.114.477.101.598.2]
Solar09, the 47th ANZSES Annual Conference
29 September- 2 October 2009, Townsville, Queensland, Australia
[image:9.595.95.513.88.299.2]9
Figure 7 Day electricity demand curtailed for wholesale regional reference price not to exceed AUD $55/MWh in Queensland in 2008.
Energy savings in TWh per year as a result of load curtailment over a certain RRP Queensland 01 Jan-31 Dec 2008 data source AEMO (2009)
0 5 10 15 20 25 30 35 40 45 50 55 60 65 70 75 80
10 20 30 40 50
Regional Reference Price (RRP) ($/MWh)
E
n
e
rg
y
s
a
v
in
g
s
T
W
h
p
e
r
y
e
a
r
[image:9.595.88.509.403.659.2]Solar09, the 47th ANZSES Annual Conference
29 September- 2 October 2009, Townsville, Queensland, Australia
10
References
AEMO (2009) Australian Energy Market Operator, Electricity Market Price & Demand Data Sets, http://www.aemo.com.au/data/price_demand.html
M. H. Albadi and E. F. El-Saadany (2008) A summary of demand response in electricity markets, 78, 11, 1989-1996, 10.1016/j.epsr.2008.04.002
http://ezproxy.usq.edu.au/login?url=http://search.ebscohost.com/login.aspx?direct=true &db=aph&AN=34090756&site=ehost-live
DOE (2006) Benefits of Demand Response In Electricity Markets And Recommendations For Achieving Them, Feb.2006,
http://eetd.lbl.gov/ea/EMP/reports/congress-1252d.pdf
DOE The Smart Grid an Introduction,
http://www.oe.energy.gov/DocumentsandMedia/DOE_SG_Book_Single_Pages.pdf
G.-S. Energy (2008) The Electricity Economy, Aug 2008,
http://www.globalenvironmentfund.com/data/uploads/The%20Electricity%20Economy. pdf
EPRI (2009) Assessment of Achievable Potential from Energy Effi ciency and Demand Response Programs in the U.S., January 2009,
http://my.epri.com/portal/server.pt?space=CommunityPage&cached=true&parentname= ObjMgr&parentid=2&control=SetCommunity&CommunityID=221&PageIDqueryCom Id=0
EPRI (2003) Electricity Technology Roadmap:2003 Summary and Synthesis Power Delivery and Markets, Nov 2003,
http://my.epri.com/portal/server.pt?space=CommunityPage&cached=true&parentname= ObjMgr&parentid=2&control=SetCommunity&CommunityID=221&PageIDqueryCom Id=0
EUAA (2005) Demand Side Response in the National Electricity Market Case Studies End-Use Customer Awareness Program, April 2005,