TO ASSES THE PREDICTIVE VALUE OF CALCIUM CREATININE RATIO IN SPOT URINE SAMPLE FOR EARLY PREDICTION OF
PRE ECLAMPSIA
DESSERTATION SUBMITTED IN FULFILMENT OF THE
REGULATIONS FOR THE AWARD OF
MD OBSTETRICS AND GYNAECOLOGY
DIVISION OF OBSTETRICS AND GYNAECOLOGY PSG INSTITUTE OF MEDICAL SCIENCES AND
RESEARCH
THE TAMILNADU DR.M.G.R.MEDICAL UNIVERSITY GUINDY, CHENNAI, TAMILNADU, INDIA
TO ASSES THE PREDICTIVE VALUE OF CALCIUM CREATININE RATIO IN SPOT URINE SAMPLE FOR EARLY PREDICTION OF
PRE ECLAMPSIA
DESSERTATION SUBMITTED IN FULFILMENT OF THE
REGULATIONS FOR THE AWARD OF
MD OBSTETRICS AND GYNAECOLOGY
DR.KANCHANAMALAI MD DGO
DIVISION OF OBSTETRICS AND GYNAECOLOGY PSG INSTITUTE OF MEDICAL SCIENCES AND
RESEARCH
THE TAMILNADU DR.M.G.R.MEDICAL UNIVERSITY GUINDY, CHENNAI, TAMILNADU, INDIA
CERTIFICATE
This is to certify that Dr. SINDHU D has prepared this dissertation entitled “
To Asses the predictive value of calcium to
creatinine ratio in spot urine sample for early prediction
of pre eclampsia’’
under my overall supervision and guidance in the Institute of PSG Institute of Medical Science and Research, Coimbatore in partial fulfillment of the regulations of Tamil Nadu Dr. M.G.R Medical University for the award of M.D. Degree in Obstetrics and Gynaecology.Dr. S RAMALINGAM, Principal
PSG Institute of Medical Sciences & Research, Coimbatore – 641004.
Dr, KANCHANMALIA MD DGO.,
Professor,
Department of Obstetrics and Gynaecology,
PSG Institute of Medical Sciences and Research,
Coimbatore- 641004
Dr. SEETHA PANICKER MD DGO., DNB.,
Professor and Head,
Department of Obstetrics and Gynaecology,
PSG Institute of Medical Sciences and Research,
DECLARATION
DECLARATION
DECLARATION
DECLARATION
DECLARATION
I hereby declare that dissertation entitled “
To Asses the
predictive value of calcium creatinine ratio in spot urine
sample for early prediction of pre eclampsia
” was prepared by me under the guidance and supervision of Dr. KANCHANAMALAI MD DGO., PSG Hospitals Coimbatore.ACKNOWLEDGEMENT
I wish express my sincere thanks and gratitude to my Professor
Dr.KANCHANMALI MD OG Department of Obstetrics and Gynaecology, PSG Institute of Medical Science and Research for her guidance and encouragement all along in completing my study. She showed me different ways of approach to study the problem and the need to be persistent to accomplish my goal.
I am extremely thankful Prof. Dr. Seetha Panicker MD DGO., DNB., Prof. Dr. T.V.Chitra MD., DGO., DNB., Prof. Dr. Reena Abraham
MD., DGO., Department of Obstetrics and Gynaecology, PSG Institute of Medical Science and Research for their cooperation extended for this study. I wish to record my gratefulness and feeling of indebtedness to them for the support given to me during the period of the study.
I am so grateful to the Principal Dr. S. Ramalingam and Medical Director Dr. Vimal Kumar Govindan, PSG Hospitals for permitting me to carry out this study.
I am indebted to all teaching staff, colleagues, interns and all the labour ward staffs of my department, for their valuable suggestions, cooperation and auxiliary attitude. I am extremely thankful to all the patients who were the most important part of my study.
I am obliged to my husband and parents. They have helped me in organizing all the facts during the preparation of this project. I would like to thank my friends and for their support in completion of course.
CONTENTS
TITLES PAGE
NO
INTRODUCTION 1
AIMS AND OBJECTIVES 10
REVIEW OF LITERATURE 12
MATERIALS AND METHODS 32
RESULTS 45
DISCUSSION 62
CONCLUSION 71
STATISTICAL ANALYSIS 73
1
INTRODUCTION
INTRODUCTION
INTRODUCTION
2
INTRODUCTION
Hypertensive disorders during pregnancy constitute the most common medical disorders encountered by obstetricians. The incidence is 7% to 10 %, of which pre eclampsia and eclampsia constitute 70% and chronic hypertension 30%. It remains the leading cause for maternal mortality and morbidity worldwide accounting for 15 % to 20%.
3
Involvement of renal system is well before the symptomatology of pre elampsia manifest.
Pritchard stated that the presence of chorionic villi in women with pre eclampsia causes vasospasm leading to development of hypertension and serious multiorgan dysfunction, specifically confined to placenta, kidneys, liver and sometimes brain.
4
So prediction of pre eclampsia earlier helps in early intervention and prevention of pre eclampsia. So many research workers are more towards the way of predicting pre eclampsia there by, primary prevention.
According to World Health Organization, hypertensive diseases during pregnancy are a major cause of perinatal mortality and morbidity. Hypertension in pregnancy is defined as, systolic blood pressure >= to 140, diastlolic blood pressure >= to 90 mm of Hg associated with proteinuria.
5
Though the etiology of hypertensive disorder in pregnancy have been explained by many research workers over many years, the etiology remains unclear even today.
Many systems affected due to hypertension in pregnancy. In women with preeclampsia, renal function changes develop well before establishment of the symptoms and signs of pre eclampsia.
Many research works have been done to establish the correlation between hypocalciuria and development of pre eclampsia, so that it can be used as early predictor of pre eclampsia.
6
investigations may be used as a screening method in predicting hypertension in pregnanacy.
Since then, various trails have been trying to detect effectiveness of hypocalciuria in predicting pre eclampsia. Many other trials have failed to show the effectiveness of the low calcium excretion as a screening method.
So the need to establish the predictive values of this investigation and thus the efficacy as a screening test in predicting the high risk women. Multiple predictive tests have be put forth till date for prediction of pre eclampsia, but all of limited use for example,
ROLL OVER TEST
7
ANGIOTENSIN SENSITIVITY TEST
A woman destined to get pre eclampsia will respond to less than 8ng/kg/min of n angiotensin infusion due to an alteration in vessel wall refractoriness,this test done between 26 to 30weeks.
PLATELET VOLUME
Thrombocytopenia and platelet dyfunction are the integral features of pre eclampsia. Increased destruction causes the platelet volume to increase because of relatively younger and therefore larger platelets entering the circulation. Ahmed et al found high platelets volumes to be a marker of impending pre eclampsia but with a substantive overlap with normotensive women.
SERUM FIBRONECTIN
8
with pre –eclampsia,in a study those levels rise within 12 weeks of gestation are high risk for developing pre eclampsia
UTERINE ARTERY DOPPLER
Uterine artery impedance between 18 to 26 weeks is being used as an early predictor of pre eclampsia.
ANTOTHROMBIN III LEVELS
URINARY KALLIKREIN EXCRETION
Ratio <170 between 16 to 20 weeks of pregnancy predicts pre eclampsia.
9
10
AIMS & OBJECTIVES
AIMS & OBJECTIVES
AIMS & OBJECTIVES
11
AIM
To Asses the predictive value of calcium creatinine ratio in spot urine sample for early prediction of pre eclampsia
OBJECTIVES
To asses predictive value of calcium creatinine ratio To asses maternal outcome
12
REVIEW OF LITERATURE
REVIEW OF LITERATURE
REVIEW OF LITERATURE
13
REVIEW OF LITERATURE
Hypertensive disorders of pregnancy constitute the most common medical disorders encountered by obstetricians.
The incidence is 7% to 10 %,of which pre eclampsia/ eclampsia constitute 70% and chronic hypertension 30%. It remans the leading cause for maternal mortality and morbidity worldwide accounting for 15 % to 20%.
14
Multiple predictive tests have be put forth till date for prediction of pre eclampsia, but all of limited use for example,
ROLL OVER TEST
A hypertensive response induced by having women at 28 to 32 weeks of gestation assume supine position after lying laterally recumbent predicts gestational hypertension
ANGIOTENSIN SENSITIVITY TEST
A woman destined to get pre eclampsia will respond to less than 8ng/kg/min of angiotensin infusion due to an alteration in vessel wall refractoriness, this test done between 26 to 30weeks.
PLATELET VOLUME
15
younger and therefore larger platelets entering the circulation. Ahmed et al found high platelets volumes to be a marker of impending pre eclampsia but with a substantive overlap with normotensive women.
SERUM FIBRONECTIN
Endothelial cell activation is the likely cause of elevated serum cellular Fibronectin levels in high risk women. Study those levels rose within 12 weeks of pregnancy are intended to progress to develop pre eclampsia.
UTERINE ARTERY DOPPLER
16
ANTOTHROMBIN III LEVELS
URINARY KALLIKREIN EXCRETION
Ratio <170 between 16 to 20 weeks of pregnancy predicts pre eclampsia.
Though many number of predictive tests are available, none has been proved to be very sensitive and specific to predict pre eclampsia. Hence many randomized control trials are to be conducted to prove one test which is both sensitive and specific to predict pre eclampsia
17
antenatal mothers at 20 to 30 weeks gestation was not a satisfactory predictive marker for development of pre eclampsia.
The major variation among different population, in calcium levels suggests that it cannot be used as a screening method.
Phuapradit W et al, conducted a study in the OBG Department, Mahidol University, Thialand, they assessed 190 primigravidas, at 28 to 32 weeks of pregnancy without any risk factors, were involved in the study .
Pre ecalmpsia was noted in 6.8% of samples, pateints with pre eclampsia did not demonstrate reduced excretion of calcium than normal population (2).
18
Study conducted by Kazerooni T et al in Shiraz University Shiraz, Iran. Study involved 200 women; they showed that CCR was appreciably less in pre eclampsia patients with a significant P value.
They concluded that, Calcium creatinine ratio can be used as mode of routine screening for early prediction of pre-eclampsia. (3)
Anai T, et al, conducted study in the Department of Obstetrics and Gynecology, Medical College of Oita. Hypocalciuria in women with preeclampsia.
19
following 4 groups: 3 mild preeclamptic patients, 5 severe preeclamptic patients, 4 patients with intrauterine growth retardation (IUGR), and 10 healthy pregnant women.
The mean 24-hour urinary calcium excretion in the 4 groups was 44.3 +/- 21.3 mg/day, 11.6 +/- 2.7 mg/day, 161.4 +/- 80.4 mg/day and 145.0 +/- 45.0 mg/day, respectively. Calcium excretion was significantly lower in the mild and severe preeclamptic patients than in the women with IUGR and the normal pregnant women.
20
calcium excretion were found in the mean calcium/creatinine ratio.
They concluded saying that determination the CCR in random urine samples is a reliable index of preeclampsia.(4)
Study conducted by Ozcan T et al in the Maternity Hospital, Turkey.
They conducted a study by testing the CCR and the calcium level in urine sample in 56 antenatal mothers, 44 among the 56 samples had normal CCR and hypertension developed in 8. The mean CCR was estimated the values to be significantly lower in the preeclamptic group compared with the normal group with significant p value.
21
and 95%, respectively. The results conclude that CCR can be used as screening tool for prediction of pre eclmapsia.
Saudan PJ et al conducted a study in Dept of Renal Medicine, University of New South Wales, Australia.
They wanted to prove the fact that Hypocalciuria has been associated with hypertensive disorder in pregnancy with or without proteinuria, but not with normal pregnancy.
They stressed up on the fact that reduced CCR has high sensitivity in detecting the pre eclampsia among high risk women. 81 antenatal mothers with established hypertension after 12 weeks of pregnancy were included in the study.
22
calcium excretion antenatally, compared to the population who remained normotensive. Results of statistical analyses revealed sensitivity 68% and a specificity of 70%.
The pathogenesis of renal involvement in pre eclampsia has been proved to occur well before the establishment of symptoms.
This test cannot be used as a sceerning test as the test lacks sensitivity, as a predictor of pre eclampsia
Kazerooni T published a study conducted in Iran,
23
The CCR was compared, were correlated by prevalence pre eclampsia. 8 women developed pre-eclampsia and 94 were found to have normal blood pressure. The variables like age, time of enrollment to the study and time of delivery were compared between the two groups, and they did not show any association.
Mean urinary calcium concentration in normotensive and pre eclampsia women, were statistically significant, with hypoclaciuria in pre eclampsia women ,with significant P value.
24
Calcium excretion in preeclampsia was assessed by Sanchez-Ramos L et al in the Dept of OBG, Florida Health Science Center, Florida.
They compared 24-hour urine data from 143 obstetric patients: 33 with preeclampsia, 58 normotensives, and 52 patients with gestational hypertension. The mean maternal age, race, and parity of these three groups did not differ significantly.
25
The PPV -85 and NPV - 91%.They concluded that Urinary calcium levels below 12 mg/dL may help distinguish preeclampsia from other hypertensive disorders of pregnancy.(8)
Efficacy of CCR in spot urine and proteinuria as a screening tool for preeclampsia.
A study published by Rodriguez MH et al in American journal was conducted in Dept of OBG, Southern California School of Medicine, Los Angeles.
88 normotensive gravid women between 24 and 34 weeks of gestation underwent urine evaluation for the presence of microalbuminuria and urinary calcium excretion (calcium/creatinine ratio).
26
or equal to 11 micrograms/ml) and a low CCR .Conversely, 94% of women who did not demonstrate high microalbuminuria and a low calcium/creatinine ratio remained normotensive at the time of delivery.
These results suggest that changes in renal function are present in gravid women who are otherwise free of symptoms in which preeclampsia will eventually develop.
They concluded the study saying that testing for microalbuminuria and a CCR can be used as assessment tool in early prediction of preeclampsia.(9)
Hypocalciuria as predictor of preeclampsia. Study done by Sanchez et al showed that,
27
In this study urinary calcium excretion was measured in 103 primigravida at risk for developing preeclampsia less than 24 weeks of pregnancy. Multiple 24-hour urine samples were collected 24 weeks, 32 weeks, and 33 weeks to term. Post delivery, the values were evaluated for the development of hypertensive disorder.
Patients who developed preeclampsia had hypocalciuria (169 +/- 30 mg/24 hours) when compared to normal population (298 +/- 15 mg/24 hours) with P value less than .05, this levels were observed during pregnancy. Statistical analysis was done and PPV and NPV were obtained for calcium excretion levels of 195 mg/24 hours.
28
These observations suggest that hypocalciuria may be related to the progression of hypertensive disorder during pregnancy.
(11) The CCR and PROTEINURIA in Predictors of Preeclampsia published by Sheela CN et al.
Study conducted in Dept of OBG St. John’s Medical College & Hospital, Bangalore
Aim was to evaluate the urinary CCR and proteinuria as a marker for early prediction of preeclampsia. They Screened 200 asymptomatic women attending their clinic for pre eclampsia by doing CCR in spot urine and also microalbuminuria at 20 to 24 weeks of pregnancy.
29
Statistical results of sensitivity, specificity, PPV and NPV of 69.2%, 98.2%, 85.7% and 95.8% respectively and p value was statistically very significant. It was found to be a good test for prediction of preeclampsia.
The study determined that pre eclampsia is associated with low calcium excretion at threshold for CCR at 0.04, so CCR in spot urine can be used as screening method in early pregnancy as a primary prevention for development of pre eclampsia.
30
They have evaluated the biochemical and clinical parameters for early detection of their alterations in pregnant women with late preeclampsia. Eighty nine patients between 24 and 32 gestation weeks were studied. Fifteen of them (18%) developed arterial hypertension (mean 141.5 +/- 3mmHg).
The perinatal results, gestational age at delivery, birth weight and Apgar score of the newborns were not significantly different among the groups that were evaluated. The microalbuminuria was analyzed through radioimmunoanalysis and reactive strips for the immunochemical semi quantitative determination.
31
negative predictive value with respect to other methods, but the differences were not wide enough to consider it the method of choice.
In the group of patients (n = 15) who developed arterial hypertension, all the biochemical methods showed a normality higher than 80%. They concluded that none of these methods used alone is useful for the early prediction of the appearance of preeclampsia
32
MATERIALS AND METHODS
MATERIALS AND METHODS
MATERIALS AND METHODS
33
MATERIALS AND METHODS
The study was conducted in the dept of OBG, PSG Hospitals, and Coimbatore from July 2012 to May 2013.
STUDY DESIGN
Prospective study
STUDY POPULATION
The study group consisted of 200 samples, randomly selected from the pateints attending the antenatal clinic from gestational age 24 weeks to 34 weeks.
INCLUSION CRITERIA
Singleton pregnancy
Gestational age 24 to 34weeks
34
EXCLUSION CRITERIA
Chronic hypertension Renal disease
Multiple Pregnancy Autoimmune diseases
Diabetes complicating pregnancy Previous abruption
Previous IUGR
35
METHODOLOGY
37
200 antenatal women who attended the PSG hospitals obstetrics and gynecology department outpatient department, from july 2012 to may 2013 at 24 to 34 weeks of gestation were enrolled in the study.
Informed consent was obtained from the patients for urinary CCR estimation.
Antenatal women with history of hypertension, diabetes and renal disease and women with the disorders mentioned in exclusion criteria were removed from the trail.
38
Blood pressure (BP) was measured in the right arm sitting position. The urine sample was collected at the collection center and sent to bio chemistry laboratory for estimation of CCR.
The doctors and patients were blinded from the CCR values; they were observed and followed up regularly up to delivery.
Each and every patient involved in the trail was observed closely for signs and symptoms of pre eclampsia, like increased weight gain, reduced urine output, swelling of ankle, headache, epigastric pain, blurring of vision.
39
determing the sesnsitivity, specificity, PPV, NPV of CCR in determination of pre eclampsia.
GESTATIONAL HYPERTENTION
Defined as Blood pressure of more than or equal to 149/90 without protienuria
PREECLAMPSIA
Defined as blood pressure of more than or equal to 140/90 mmHg associated with protein excretion.
The women in the study were categorized bases on above definition as normotensive or hypertensive.
CCR values were determined and the levels less than or equal to <0.04+_0.04 were considered as low calcium excretion, I e positive,
40
statistical analysis. Pearson correlation was established between normal group and the group who developed pre eclampsia with age, birth weight, and gestational age of development od pre eclmapsia
OUTCOME MEASURES
Development of pre eclampsia
Gestational age of development of pre eclampsia Mode of delivery
41
PRO FORMA
NAME AGE
SERIL NO OP NUMBER IP NUMBER ADDRESS UNIT
SOCIO ECONOMIC STATUS MENSTRUAL HISTORY OBSTETRIC HISTORY
GESTATIONAL AGE OFCOLLECTION ANTENATAL COMPLICATION
PR
42
EDEMA ICTERUS CVS RS PA
CALCIUM CREATININE RATIO
GESTATIONAL AGE OF COLLECTION FOLLOW UP-
GESTATIONAL AGE OF DEVELOPMENT OF PRE ECLAMPSIA
43
PSG Institute of Medical Science and Research, Coimbatore
Institutional Human Ethics Committee
INFORMED CONSENT
I, Dr. SINDHU.D, MD., (OG) postgraduate from the department of Obstetrics and Gynecology of PSG Institute of Medical Science & Research (PSGIMS&R), am carrying out a study on the topic: To Asses the predictive value of calcium creatinine ratio in spot urine sample for early prediction of pre eclampsia.
Under the aegis of the Department of Obstetrics and Gynecology, PSGIMSR
The objectives of this study are:
44
Sample size: 200
Respondents are patients at 24 to 34 weeks of gestation, who attended the outpatient department. PSG hospitals coimbatore
Consent: The above information regarding the study, has been read by me/ read to me, and has been explained to me by the investigator/s. Having understood the same, I hereby give my consent to them to interview me. I am affixing my signature / left thumb impression to indicate my consent and willingness to participate in this study.
Signature / Left thumb impression of the Study Volunteer / Legal Representative:
45
46
Results
During the study period a total of 200 patients were included in the study.
BOX 1
No of postives and negatives
Among 200 samples 18 patients had abnormal CCR and 182 had normal values, i,e 18 were positives and 182 negatives CCR- Calcium Creatinine Ratio
Test parameter Test positive (n%) Test negative (n%) Total (n%)
47
BOX 2
The correlation of CCR with pre eclampsia
CCR Pre-Eclampsia Normotensive Total
Test Positive 5 (2.5%)
(True Positive)
13 (6.5%)
(False Positive) 18 (9.0%)
Test Negative 2(1%)
(False Negative)
180(90%)
(True Negative) 182(91%)
Among the 18 positive values,5 were true positives that is they developed pre eclampsia and 13 were false positive that is they failed to
results ,2 were false negative meaning they developed pre eclampsia with normal CCR values and rest 180 were true negatives with normal CCR and normal blood pressure
48
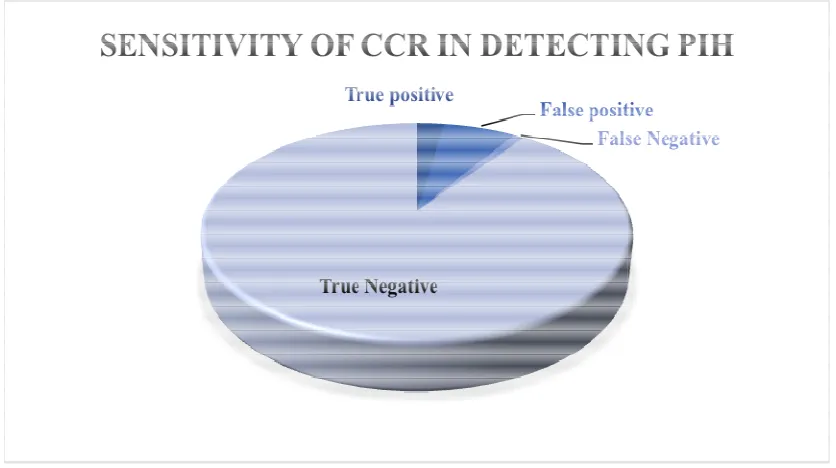
Fig 1
Among the 18 positive values,5 were true positives that is they developed pre eclampsia and 13 were false positive that is they failed to develop pre eclampsia, among 182 negative results ,2 were false negative meaning they developed pre eclampsia with normal CCR values and rest 180 were true negatives with normal CCR and normal blood pressure
[image:58.595.105.523.141.375.2]49
BOX 3
Results of statistical analysis
The sensitivity of CCR in prediction of pre eclampsia is 71% and specificity is 86%.
With very low PPV and good NPV of 98.8%
Test parameter Criteria Sensitivity Specificity PPV NPV
CCR <0.04+_
50
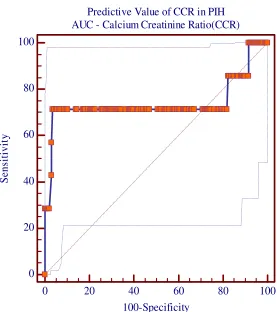
Area under curve of CCR
Fig 2
Predictive Value of CCR in PIH AUC - Calcium Creatinine Ratio(CCR)
0 20 40 60 80 100
0 20 40 60 80 100
100-Specificity
S
e
n
s
it
iv
it
[image:60.595.183.460.221.533.2]51
Test parameter AUC SE 95% CI
CCR 0.74 0.16 0.67-0.80
The Area under the Curve of CCR in predicting Pre eclampsia is 0.74
52
BOX 4
Correlation of pre eclampsia and CCR with age, BW, GA at delivery
Pearson Correlation CCR Pre-Eclampsia
Correlation
Coefficient P Value
Correlation
Coefficient P Value
Age 0.100 0.160 0.075 0.293
BW 0.148 0.036 -0.029 0.682
GA at delivery 0.115 0.106 -0.065 0.362
CCR -0.110 0.122
Pre-Eclampsia -0.110 0.122
CCR-Calcium Creatinine ratio BW-Birth Weight
53
Normal CCR is found to have positive Pearson correlation with age, birth weight (BW) (statistically significant), implying that normal CCR samples had appropriate age, normal birth weight and term gestational age (GA) at delivery.
54
BOX 5
Correlation of pre eclampsia with age, BW, GA of delivery and CCR
CCR-Calcium Creatinine ratio BW-Birth Weight
GA-Gestational Age
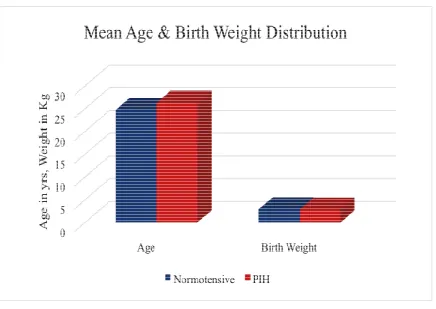
Parameters Normotensive PIH P Value
Age 24.73 26.29 0.2926
BW 2.92 2.86 0.6825
GA at Delivery 38.75 38.29 0.3621
Calcium Creatinine
Diagnosis of Pre correlation with age,
common in younger age group.
Whereas Negative correlation with birth weight, gestational age and C
55
Fig 3
Diagnosis of Pre-Eclampsia has positive Pearson correlation with age, incidence of pre eclampsia is seen more common in younger age group.
Whereas Negative correlation with birth weight, gestational age and CCR,with P Value not significant
Eclampsia has positive Pearson incidence of pre eclampsia is seen more
[image:65.595.108.544.135.444.2]56
BOX 6
Correlation of CCR with age, BW, GA of delivery and CCR
CCR-Calcium Creatinine ratio BW-Birth Weight
GA-Gestational Age
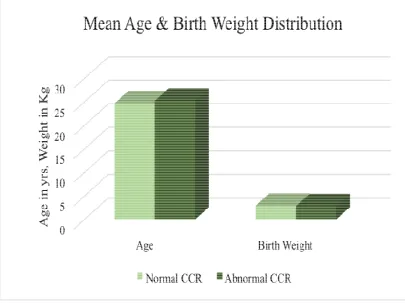
Parameters Normal
CCR
Abnormal
CCR P Value
Age 24.73 25.28 0.566
BW 2.93 2.81 0.2338
GA at Delivery 38.74 38.67 0.8191
Calcium Creatinine
CCR is found to have positive Pearson correlation with age, birth weight (statistically significant) and gestational age, whereas CCR has negative Pearson correlation with pre eclampsia.
57
Fig 4
CCR is found to have positive Pearson correlation with age, birth weight (statistically significant) and gestational age, whereas CCR has negative Pearson correlation with pre
[image:67.595.142.547.145.448.2]pre-58
BOX 7
Correlation of mode of delivery with CCR
Mode of Delivery Normal
CCR %
Abnormal
CCR %
NVD 122 67.03 15 83.33
LSCS 59 32.42 3 16.67
IUD Term 1 0.55 0 0.00
Mode of delivery had negative correlation with CCR, 83.3% of patients with abnormal CCR had normal delivery compared to normal CCR
59
Fig 5
Mode of delivery had negative correlation with CCR, 83.3% of patients with abnormal CCR had normal delivery compared to normal CCR only 67% had normal delivery
Mode of delivery had negative correlation with CCR, 83.3% of patients with abnormal CCR had normal delivery
[image:69.595.107.548.140.432.2]60
BOX 8
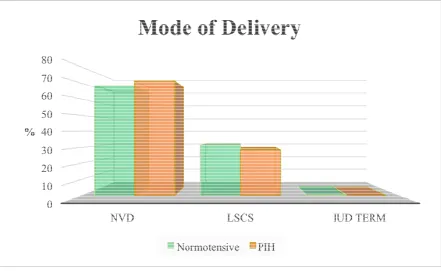
Correlation of mode of delivery with pre eclampsia
Mode of
Delivery Normotensive % Pre eclampsia %
NVD 132 68.39 5 71.43
LSCS 60 31.09 2 28.57
IUD Term 1 0.52 0 0.00
Total 193 7
No significant correlation was established between mode of delivery and pre eclampsia
61
Fig 6
No significant correlation was established between mode of delivery and pre eclampsia.
[image:71.595.109.550.141.412.2]62
63
DISCUSSION
In the above study comprising of 200 low risk anenatal mothers at 24-34 weeks of pregnancy were enrolled in the study. They all were assessed for development of pre eclampsia by determining the CCR in the urine sample.
They were categorized into pre eclampsia and normotensive depending on the low CCR less than or equal to 0.04 +_0.04 .Out of 200 samples, 18 calcium creatinine ratio was found to be abnormal, of which 5 developed pre eclampsia and rest 13 remained normotensive throughout pregnancy, and 2 samples with normal value developed pre eclampsia showing,
64
PPV of 15.6%
Low calcium creatinine ratio has positive pearson correlation with the age, birth weight and gestational age of delivery, where as it has negative correlation with pre eclampsia.
Sheela et al , from St Jhons medical college conducted a study, Calcium creatinine and microalbuminuria in ratio in spot urine sample for prediction of pre eclampsia at 20 to 24 weeks of gestation they reported that, the sensitivity of 69.2%, specificity of 98.2%, PPV of 85.7% and NPV of 87% with statistically significant p value.
65
preeclampsia and can be recommended as a screening test for all pregnant women.
Where as in our study, we estimated only calcium creatinine ratio, and found to have sensitivity of 71%, specificity of 86% with a good NPV of 98.8% and PPV of 15.6%.
Concluding that CCR has got good NPV and better specificity but cannot be used as a routine screening method for prediction of preeclampsia, may be it can be used as more randomized trials with more sample size are needed for determining the efficacy of CCR in predicting pre eclampsia.
66
concluded that low calcium excretion can be used as predictive marker of pre eclampsia.
Preeclampsia whereas the above study shows it can be used as a screening tool, in low risk group, but can be used in the high risk group for its high negative predictive value.
Saudan 6, had reported the sensitivity of Calcium creatinine ratio of only 68% and specificity of 70% with the threshold cut off value of 0.10,compared to the study stated above the threshold value is much lesser than the above value, which shows sensitivity of 71% and specificity of 86%,NPV of 98.8% and PPV of 15%.
67
weeks, where as in the above study the gestational age is taken from 24 to 34 weeks, giving a wider range for prediction.
Kazeroomi et al and Kar et al established the efficacy of low calcium excretion in early prediction of pre eclampsia at less than or equal to 0.04 at 20-34weeks of pregnany and concluded saying that CCR can be used as a early marker of pre eclampsia.
Saudan PJ et al conducted a study in Dept of Renal Medicine, Australia.
68
as a marker of imminent preeclampsia in women at high risk for developing preeclampsia. 81 women with established hypertension in second half of pregnancy were included in the study. The CCR was determined in a urine sample at first visit.
The Patients were observed and subsequently classified according to development of preeclampsia post natally.on follow up, patients who developed pre eclampsia had low calcium excretion antenatally, compared to the population who remained normotensive. Results of statistical analyses revealed sensitivity 68% and a specificity of 70%.
69
Salako 10 has shown that urinary calcium excretion by determining CCR had a high sensitivity (88.9%) but a low PPV (22%), similar way as shown in the above study.
Estimation of CCR in a spot urine sample is a feasible test, easy to perform and hence has high patient acquiescence. It has a good NPV and hence substantiates the cost and it may be suitable to be used as a screening tool for prediction of preeclampsia.
It can therefore be suggested as a screening test for people who are high risk preeclampsia between 24-34 weeks of pregnancy.
70
71
CONCLUSION
CONCLUSION
CONCLUSION
72
CONCLUSION
A single estimation of CCR at less than or equal to 0.04 +_0.04, in a spot urine sample, in asymptomatic pregnant women between 24-34 weeks of pregnancy, may be used as a early forecaster of pre eclampsia future development of preeclampsia in asymptomatic low risk women, but with high negative predictive value it can be used as screening tool for pre eclampsia in high risk group.
73
STATISTICAL
STATISTICAL
STATISTICAL
74
STATISTICAL ANALYSIS
BIBLIOGRAPHY
1) Med J Aust. 1993 Jan 18;158 (2):98-100 Prediction of pregnancy induced hypertention by means of the urinary calcium:creatinine ratio.
(2) Aust N Z J Obstet gynaecol.1993 Aug;33(3) :280-1.Urinary calcium to creatinine ratio in prediction of preeclampsia
(3) Int J Gynaecol Obstet. 2003 Mar;80(3):279-83.Calcium to creatinine ratio in a spot sample of urine for early prediction of pre-eclampsia.
(4) Nihon Sanka Fujinka Gakkai Zasshi. 1992 Jan;44(1):28-32. Hypocalciuria in women with preeclampsia.
(5) Am J Perinatol. 1995 Sep;12(5):349-51.
(6) Am J Hypertens. 1998 Jul;11(7):839-43.
Urinary calcium/creatinine ratio as a predictor of preeclampsia. Saudan PJ, Shaw L, Brown MA.
Department of Renal Medicine, St. George Hospital, University of New South Wales, Kogarah, Australia.
(7) Int J Gynaecol Obstet. 2003 Mar;80(3):279-83.
Calcium to creatinine ratio in a spot sample of urine for early prediction of pre-eclampsia.
Kazerooni T, Hamze-Nejadi S. Shiraz University of Medical Sciences, Shiraz, Iran.
(8) Obstet Gynecol. 1991 Apr;77(4):510-3.
Calcium excretion in preeclampsia. Sanchez-Ramos L, Sandroni S, Andres FJ, Kaunitz AM.
(9) Am J Obstet Gynecol. 1988 Dec;159(6):1452-5.
Calcium/creatinine ratio and microalbuminuria in the prediction of preeclampsia. Rodriguez MH et al
Department of Obstetrics and Gynecology, University of Southern California School of Medicine, Los Angeles.
(10) Obstet Gynecol. 1991 May;77(5):685-8.
Urinary calcium as an early marker for preeclampsia.
Sanchez-Ramos L, Jones DC, Cullen MT.
Department of Obstetrics and Gynecology, University of Florida Health Science Center, Jacksonville.
11) The Journal of Obstetrics and Gynecology of India January / February 2011 pg 72 – 76. Calcium-Creatinine Ratio and Microalbuminuria in Prediction of Preeclampsia
(12) Rev Fac Cien Med Univ Nac Cordoba. 1993;51(2):15-20.
[Diagnostic value of microalbuminuria and the calcium/creatinine ratio in the early detection of preeclampsia]
(13) alhali A et al. Decreased fractional urinary calcium excretion and serum, 1,25- dihydroxyvitamin D and IGF-Ievels in preeclampsia. J Steroid Biochem Mol Biol 2007;103:803-6.
(14) Szmidt-Adjide V et al. Calciuria and preeclampsia: a case control study. Eur J Obstet Gynecol Reprod Biol 2006;125:193-8.
(15) Segovia BL, Vega IT, et al. Hypocalciuria during pregnancy as a risk factor of preeclampsia. Ginecol Obstet Mex 2004;72:570-4.
(17) Ozcan T, et al. Urinary calcium to creatinine ratio for predicting preeclampsia. Am J Perinatol 1995;12:349-51. Saudan PJ, Shaw L, Brown MA. Urinary calcium/creatinine ratio as a predictor of preeclampsia. Am J Hypertens 1998;11:839-43
(18) Izumi A, et al. Calcium-to- creatinine ratio in spot urine samples in early pregnancy and its relation to the development of preeclampsia. Metabolism 1997;46:107-8.
(19) Kazeroomi T, et al Calcium to creatinine ratio in a spot sample of urine for early prediction of pre- eclampsia. Int J Gynaecol Obstet 2003;80:279-83
(20) Kar J, et al. Role of urinary calcium creatinine ratio in prediction of pregnancy induced hypertension. J Obstet Gynaecol India 2002;52:39-42.
(22) Shaaraway M, Salem ME et al The clinical value of microtransferrinuria and microalbuminuria in the prediction of pre-eclampsia. Clin Chem Lab Med 2001;39:29-34.
(23) Chhabra S, et al Prediction of pregnancy induced hypertension / preeclampsia by detecting micro albuminuria J Obstet Gynaecol India 2002;52:56- 60.
BIBLIOGRAPHY
BIBLIOGRAPHY
BIBLIOGRAPHY
BIBLIOGRAPHY
MASTER CHART
MASTER CHART
MASTER CHART
MASTER CHART
S.No. AGE CCR GA OF
COLLECTION GA OF PIH
GA OF
DELIVERY MODE WEIGHT
1 24 0.204 26 WK 37 WK LSCS 2
2 23 0.359 24 WK 39 WK + 6D NVD 2.86
3 28 0.23 26 WK + 5 D 40 WK NVD 2.92
4 24 0.204 25 W + 6 D 37 WK LSCS 3.12
5 23 0.18 25 W + 6 D 39 WK NVD 2.89
6 27 0.374 33 WK 38 WK LSCS 2.98
7 23 0.44 26 W + 2 D 39WK + 5 D NVD 3.02
8 18 0.242 25 WK + 3 D 39 W + 4 D NVD 2.8
9 25 0.124 25WK + 6 D 39 WK + 6 D LSCS 2.34
10 28 0.522 24WK + 3 D 39 WK + 2 D LSCS 3.7
11 24 0.12 31 WKS 39 W+ 6 D LSCS 3.96
12 36 0.11 24 WK + 6 D 38 WK + 4 D LSCS 2.53
13 26 0.107 33 WKS 38 WKS NVD 3.2
14 25 0.119 26 W + 2 D 37 WKS NVD 2.7
15 27 0.18 24 WKS + 1 D 38 WKS LSCS 2.23
16 23 0.15 24 WKS 40 WK LSCS 3.4
17 28 0.159 26WK + 3 D 38 WKS NVD 3.22
18 20 0.123 24 W + 1 D 39 WKS NVD 2.96
19 18 0.035 28 WKS 38 WKS 39 WKS NVD 2.94
20 22 0.166 33W + 1D 39 WK NVD 2.98
21 21 0.169 29 WKS 40 WKS LSCS 3.07
22 20 0.137 24WKS 35 WKS NVD 1.98
23 27 0.408 24 WKS 39 WKS NVD 2.73
24 20 0.12 25 W + 1 D 39 WKS NVD 3.38
25 24 0.42 24 W + 5 D 38 WKS LSCS 2.74
26 23 0.29 27 WKS 33 WKS + 5 D NVD 2.14
27 25 0.07 25 W+ 6 D 36 WKS LSCS 1.66
28 27 0.321 32 WKS 39 WKS LSCS 3.1
29 25 0.307 30 WK + 1 D 37 WKS NVD 2.35
30 24 0.15 25 WKS 37 WKS NVD 2.8
31 27 0.116 31 WKS + 2 D 39 W + 4 D NVD 2.87
32 26 0.3 29 WKS 40 WKS NVD 2.97
33 21 0.246 26 WKS 39 WK + 3 D LSCS 2.88
34 21 0.219 24WKS 39 W+ 6 D NVD 3.25
35 22 0.118 24 W+ 1D 39 WKS LSCS 2.49
36 23 0.394 24W + 5 D 38 WKS + 2 D NVD 2.9
37 24 0.282 24 W + 4 D 38 WKS LSCS 2.96
38 25 0.311 28W + 1 D 37 WKS NVD 2.61
39 36 0.39 31 WKS + 3 D 32 WKS 38 WKS LSCS 3.08
40 26 0.17 27 W+ 2 D 38 WKS NVD 2.77
41 27 0.249 24 WKS 37 WKS NVD 2.31
42 23 0.039 24 WKS 40 WK NVD 3.14
43 26 0.161 29 WKS 39 W + 4 D NVD 3
44 31 0.56 25 WK + 3 D 38 WK NVD 2.9
46 28 0.22 28 WK + 4 D 40 W + 1D NVD 2.48
47 27 0.62 27 WKS 39 WK +6D LSCS 3.45
48 26 0.2 26 WKS 40 WK LSCS 2.97
49 24 0.151 25 WK + 5 D 39 W + 4 D LSCS 3.05
50 20 0.08 34 WKS 38 WKS +3 D NVD 2.35
51 25 0.0236 32 WKS 38 WKS + 3 D NVD 2.42
52 24 0.271 26 WKS + 3 D 40 WKS NVD 3.64
53 34 0.09 24 WKS 40 WKS NVD 3.57
54 30 0.205 28 WKS 39 W + 4 D NVD 3.2
55 20 0.04 24 WKS + 6 D 39 WKS NVD 2.96
56 24 0.11 24 WKS 38 WKS NVD 3.11
57 30 0.42 24 WKS 39 WKS + 5 D NVD 2.86
58 22 0.435 29 WKS 39 WKS + 3 D NVD 2.8
59 23 0.066 29 WKS 40 WKS NVD 2.56
60 20 0.259 26 WKS 37 WKS NVD 2.76
61 25 0.19 27 WKS 38 WKS LSCS 2.5
62 29 0.34 26 W + 2 D 38 WKS LSCS 3
63 33 0.17 25 W + 3 D 40 WKS + 2 D NVD 3.01
64 22 0.6 26 WKS + 2 D 39 WKS + 1 D NVD 2.82
65 25 0.21 29 WKS 39 WK + 4 D LSCS 3.13
66 23 0.25 28 WK + 6 D 37 WK + 6 D NVD 2.9
67 27 0.44 24 WKS + 6 D 40 WKS NVD 4.33
68 24 0.32 27 WKS + 4 D 36 WKS + 6 D NVD 3.42
69 20 0.083 27 WKS + 2 D 38 WKS + 5 D NVD 2.12
70 23 0.5 28 WKS + 4 D 40 WKS NVD 3.1
71 26 0.16 25 WKS 37 WKS NVD 2.45
72 21 0.3 28 WKS 38 WKS LSCS 2.14
73 23 0.247 27 WKS 37WKS + 5 D NVD 3.08
74 23 0.1 28 WKS 38 WKS + 3 D NVD 2.42
75 27 0.154 28 WKS 38 WK + 4 D NVD 2.9
76 21 0.095 28 WKS 39 WKS + 1 D NVD 3.12
77 21 0.07 28 WKS 40 WKS LSCS 2.9
78 26 0.17 28 WKS 40 WKS NVD 3.3
79 24 0.25 27 WKS + 2 D 40 WKS NVD 3.13
80 25 0.329 28 WKS 37 W + 2 D NVD 2.21
81 26 0.12 28 WKS 39 WKS NVD 3.33
82 23 0.192 25 WKS + 6 D 40 WKS NVD 4.05
83 29 0.122 25 WKS + 1 D 39 WKS LSCS 2.6
84 27 0.06 29 WKS 38 WKS NVD 2.63
85 33 0.047 29 WKS 38 WKS LSCS 3.3
86 34 0.011 27 WKS + 6 D 38 WKS LSCS 2.3
87 20 0.007 25 W+ 6 D 38 WKS 39 WKS + 5 D NVD 2.8
88 24 0.08 22 WKS 39 WKS + 5 D NVD 3.31
89 26 0.03 26 WKS + 1 D 35 WKS + 6 D 39 WKS LSCS 3.14
90 31 0.036 28 WKS + 3 D 30 WKS + 3 D 35WK + 1 D NVD 2.25
91 25 0.511 29 WKS 36 WKS 37 WKS NVD 2.9
92 21 0.09 28 WKS 38 WKS + 4 D NVD 2.8
94 27 0.161 24 WKS 39 W + 4 D NVD 3.2
95 21 0.19 24 WKS + 5 D 38 WKS +3 D NVD 3.1
96 22 0.176 26 WKS 40 WKS NVD 2.8
97 22 0.156 24 WK + 5 D 40 WKS + 2 D NVD 2.9
98 22 0.09 26 WKS 39 WKS + 6 D LSCS 3
99 22 0.167 26 WKS + 5 D 39 WKS + 6 D NVD 2.8
100 26 0.21 26 WKS 38 WK + 4 D NVD 2.67
101 23 0.317 24 WKS 40 WKS + 2 D LSCS 3.01
102 23 0.36 24 WKS + 4 D 40 WKS NVD 3.01
103 27 0.264 27 WKS 37 WKS + 2 D NVD 2.73
104 31 0.1 24 WKS + 5 D 40 WKS + 2 D NVD 3.03
105 27 0.8 27 WKS 40 WKS + 2 D NVD 3.1
106 27 0.109 26 W + 2 D 37 WKS + 5 D LSCS 2.42
107 28 0.18 25 WKS 37 WKS NVD 2.02
108 24 0.24 24 WKS 39 WKS + 6 D LSCS 2.19
109 26 0.3 24 WKS 39 WKS + 4 D LSCS 3.11
110 26 0.386 24 WKS 40 WKS LSCS 3.22
111 29 0.1 24 WKS 38 WKS + 4 D NVD 2.57
112 20 0.34 26 WKS + 1 D 39 WKS + 3 D NVD 2.9
113 21 0.28 29 WKS 32 WKS NVD 1.65
114 21 0.4 24 WKS 37 WKS + 3 D NVD 2.95
115 26 0.5 25 WKS 39 WKS + 6 D NVD 3.3
116 26 0.1 27 WKS 37 WKS + 3 D NVD 2.5
117 18 0.24 25 WKS 39 W+ 6 D NVD 2.9
118 22 0.33 24 WKS 40 WKS + 2 D LSCS 3.9
119 26 0.03 25 WKS 37 WKS + 2 D NVD 3.13
120 20 0.16 28 WKS 40 WKS LSCS 3.75
121 27 0.2 30 WKS 38 WKS + 4 D NVD 3.29
122 24 0.5 25 WKS 39 WKS + 4 D LSCS 2.8
123 33 0.7 28 WKS 38 WKS LSCS 3.15
124 26 0.36 24 WKS 38 WKS + 2 D LSCS 2.75
125 18 0.16 26 WKS 37 WKS + 6 D NVD 3.11
126 22 0.98 28 WKS 39 W + 4 D NVD 2.8
127 24 0.168 26 WKS + 5 D 40 WKS NVD 3.3
128 32 0.187 25 WKS 36 WKS + 4 D NVD 2.42
129 27 0.241 29 WKS 40 WKS LSCS 3.38
130 20 0.03 28 WKS 39 WKS + 3 D NVD 3
131 21 0.121 25WKS 39 WKS + 1D NVD 2.9
132 24 0.21 27 WKS 37 WKS + 6 D NVD 2.3
133 26 0.01 24 WKS + 6 D 40 WKS NVD 2.54
134 18 0.133 24 WKS 37 WKS + 6 D NVD 2.87
135 26 0.2 26 WKS 38 WKS + 5 D LSCS 2.8
136 24 0.33 24 WKS 39 WKS + 1 D NVD 3.01
137 27 0.48 25 WKS 38 WKS NVD 2.73
138 24 0.09 26 W + 2 D 39 WKS + 1 D NVD 2.8
139 23 0.3 26 WKS 39 WKS + 5 D LSCS 2.77
140 23 0.12 29 WKS 38 WKS + 4 D NVD 3.34
142 26 0.29 30 WKS 38 WKS + 1 D IUD TERM 2.6
143 19 0.24 28 WKS 37 WKS + 5 D NVD 2.8
144 28 0.2 28 WKS 39 WKS + 5 D LSCS 3.47
145 20 0.1 28 WKS 34 WKS + 6 D NVD 1.98
146 23 0.08 24 WKS 39 WKS + 1D NVD 2.98
147 32 0.2 28 WKS 37 WKS + 3 D LSCS 3
148 23 0.9 24 WKS 39 WKS + 4 D NVD 3.12
149 18 0.37 26 WKS 39 WKS NVD 2.82
150 26 0.134 27 WKS 37 WKS + 3 D NVD 2.5
151 21 O.286 29 WKS 38 WK NVD 2.8
152 28 0.615 27 WKS 39 W+ 6 D NVD 2.92
153 26 O.386 26 WKS 39 W + 4 D LSCS 3.22
154 33 0.123 30 WKS 37 WKS + 4 D LSCS 3.12
155 21 0.246 27 WKS 39 WKS LSCS 2.88
156 31 0.67 26 WKS 40 WKS NVD 2.95
157 23 0.28 29 WKS 40 WKS NVD 3.25
158 19 0.197 29 WKS 40 WKS NVD 3.5
159 18 0.16 26 WKS 37 WKS NVD 3.11
160 20 0.489 26 WKS 40 WKS + 2 D NVD 2.85
161 26 0.554 25 WKS 39WKS + 6 D NVD 3.3
162 32 0.364 28 WKS 38 WKS + 2 D LSCS 3.27
163 24 0.4 25 WKS 38 WKS +3 D NVD 2.9
164 33 0.78 28 WKS + 2D 39 WKS LSCS 3.15
165 29 0.403 28 WKS 38 WKS LSCS 2.44
166 20 0.161 29 WKS 40 WKS LSCS 3.71
167 32 0.155 27 WKS 38 WKS LSCS 3.07
168 20 0.564 26 WKS 39 WKS + 3 D NVD 2.9
169 24 0.19 26 WKS 40 WKS NVD 3.4
170 23 0.8 29 WKS 38 WKS + 1 D NVD 3.1
171 28 0.42 27 WKS 37 WKS NVD 3.12
172 24 0.036 24 WKS 38 WKS + 4 D NVD 2.8
173 23 0.07 30 WKS 38 WKS + 3 D NVD 3
174 27 0.018 28 WKS 39 W+ 6 D NVD 2.9
175 23 0.09 28 WKS 39 W + 4 D LSCS 3.6
176 18 0.54 26 W + 2 D 40 W + 1D NVD 3.1
177 25 0.3 26 W + 2 D 39WKS + 6 D NVD 3.2
178 28 0.45 25 W+ 6 D 39 WKS + 6 D LSCS 2.9
179 24 0.76 25WKS 39 WKS + 3 D NVD 2.9
180 36 0.39 24 WK + 5 D 39 WKS + 3 D NVD 3
181 26 0.23 25 WKS 39 WKS + 1D NVD 3.11
182 25 0.33 26 WKS + 1 D 37 WKS + 6 D NVD 2.86
183 27 0.3 27 WKS + 2 D 40 WKS NVD 2.8
184 23 0.09 27 WKS 37 WKS + 6 D NVD 2.56
185 28 0.06 24 WKS + 4 D 38 WKS + 5 D NVD 2.76
186 20 0.2 25 W + 3 D 39 WKS + 1 D LSCS 2.5
187 18 0.113 24 WK + 5 D 38 WKS LSCS 3
188 22 0.14 26 W + 2 D 39 WKS + 1 D NVD 3.01
190 20 0.12 25 W + 3 D 38 WKS + 4 D LSCS 3.13
191 27 0.308 25 WKS 37 WKS + 6 D NVD 2.9
192 20 0.197 28 WKS 38 WKS + 1 D NVD 4.33
193 29 0.111 26 WKS + 1 D 38 WK LSCS 3.27
194 28 0.007 27 WKS 38+3D 39 W+ 6 D NVD 2.9
195 25 0.3 27 WKS 34 WKS + 6 D NVD 3.1
196 27 0.11 28 WKS 39 WKS + 1D NVD 2.45
197 25 0.112 27 WKS + 4 D 37 WKS + 3 D LSCS 2.14
198 24 0.282 26 WKS + 5 D 39 WKS + 4 D NVD 3.11
199 26 0.34 26 W + 2 D 39 WKS NVD 2.85