PRE-MOULD PROCESSING FOR SYNTACTIC FOAMS: MODELLING,
THEORY AND EXPERIMENT
Md Mainul Islam
Centre of Excellence in Engineered Fibre Composites (CEEFC) Faculty of Engineering and Surveying
University of Southern Queensland Toowoomba, QLD 4350
Australia
and
Ho Sung Kim1
Discipline of Mechanical Engineering School of Engineering
Faculty of Engineering and Built Environment The University of Newcastle
Callaghan, NSW 2308 Australia
Phone +61 2 4921 6211 Fax +61 2 4921 6946 Email: [email protected]
ABSTRACT
Pre-mould processing for syntactic foams made of starch and ceramic hollow microspheres was studied. A statistical model to relate various parameters such as volume expansion rate (VER) of initial bulk volume of microspheres (IBVMS), microsphere size, microsphere volume fractions, minimum inter-microsphere distance (MID), and mixing ratio of microspheres was developed for theoretical relations. The statistical model consists of cubic cells which can optionally be simple cubic (SC) or face centred cubic (FCC) or body centred cubic (BCC) cells. The theoretical relations were verified with experimental/numerical data for various mixtures of microspheres and found to be capable of predicting effects of microsphere size and mixture ratio of microsphere size groups on VER under various conditions arising from starch content in binder and IBVMS.
KEYWORDS: Syntactic foam; Hollow microsphere; Gelatinisation; Buoyancy; Manufacture; Starch; Pre-mould; Mixing; MID; Microsphere size; Model; Volume expansion rate; IBVMS
INTRODUCTION
Syntactic foams, which are made of hollow microspheres and binder, can be used as various structural components including sandwich composites [1-3] and in areas where
1
low densities are required e.g. undersea/marine equipment for deep ocean current-metering, anti-submarine warfare [4-8] and others [9]. Their other uses include products in aerospace and automotive industries [9]. However, the densities of syntactic foams in the past have been relatively high compared to the traditional expandable foams, limiting their applications.
A wide range of different types of syntactic foams can be made by selecting different materials and consolidating techniques for binder and hollow microspheres. The consolidating techniques include coating microspheres [10], rotational moulding [11], extrusion [12,13], pressure infiltration [14], and ones that use inorganic binder solution and firing [15], dry resin powder for sintering [16-19], compaction [20,21], liquid resin as binder [22] for in situ reaction injection moulding, and buoyancy [1, 23-27]. The last method (buoyancy) has recently been demonstrated to be capable of control of a wide range of binder contents at low costs, widening the applicability of syntactic foams. Also it allows us to use starch as binder for manufacture of syntactic foams [25]. Starch has some advantages over other binders such as epoxies, and phenolics in some potential applications such as building interior sandwich panels. It is readily available, environmentally friendly, and an inexpensive renewable polymeric binder. However, it is dimensionally unstable during manufacturing, thereby limiting the applicability. For example, gelatinised starch binder tends to shrink significantly when it dries [25-27]. Islam and Kim [25] have studied relationships between various manufacturing parameters for starch binder and ceramic hollow microspheres. An important manufacturing parameters has been identified to be IBVMS (initial bulk volume of microspheres) expansion rate, when mixed with binder, for design of manufacturing facilities and dimensional control of syntactic foam. They demonstrated that their developed relation between IBVMS and MID (minimum inter-microsphere distance) is capable of predicting microsphere size effect. However, applicability of the relation is limited to a single size group of microspheres.
In this paper, a generalised relationship between IBVMS and MID for various mixtures consisting of different microsphere size groups is derived as part of continued previous work by Islam and Kim [25] for syntactic foam made of starch binder and ceramic hollow microspheres.
THE BUOYANCY METHOD FOR MANUFACTURING SYNTACTIC FOAMS
conducted in two different ways. One is prior to the addition of hollow microspheres to the water-starch mixture and the other is after moulding, which will be referred to as pre- and post-mould gelatinisations respectively. In this work, pre-mould gelatinisation was employed. More details are available in references [23-26].
STATISTICAL MODELS AND THEORY PROPOSED
When microspheres are mixed with the starch binder, the bulk volume of the mixture expands significantly. Therefore, the volume expansion rate (VER) should be known for the design of a manufacturing facility.
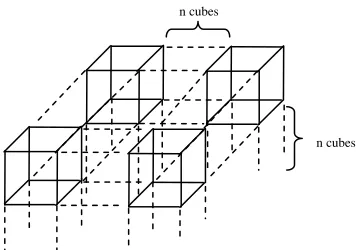
Various microsphere sizes in a group (or statistical population) of microspheres can be represented by a mean size, which is expected value for random sizes. Cubic unit cells such as SC (simple cube), FCC (face centred cube), and BCC (body centred cube) can be used as building blocks for the statistical model shown in Fig. 1. In this model each sphere represents a mean size of random-sized spheres. There can be various ways of combining cubic unit cells for modelling mixture of two different groups of microspheres. The number of unit cells of the two size groups of microspheres depends on the mixture ratio. The model is a three-dimensional arrangement of cubic cells rather than one- or two-dimensional arrangement because a mixture is a 3D entity, and spheres (large ones in one of groups of microspheres in this work) in a minority group in number are located at the middle of the model representing a mean value of the random positions. The three types of unit cells as shown in Fig. 2 and can be employed for relation derivations. The VER is defined as top phase volume divided by IBVMS and can be derived independently of unit cell type as
VER
3
0 2 1
1
+ + + =
fd r r
de
or
3
0 2 1
2 1
+ +
+ +
fd r r
MID r
r
(1)
where r1 is the mean radius of microspheres for a group of small microspheres, r2 is the
mean radius of microspheres for a group of large microspheres, d0 is the minimum
inter-microsphere distance (MID) of IBVMS as defined in Fig. 2, de is an increment of d0, so
that de = 0 for IBVMS but de ≠ 0 for MID = fd0 + de when expanded, f is a factor for
packing correction because the model does not represent the way of packing of microspheres for IBVMS.
The d0 in Equation (1) may now be found from the model consisting SC unit cells as
2 1 3
3 2 8 / 1 3 1 8 / 1 0
6
) (
r r pn
r N r n d
c
− − +
=
π
where p is a packing factor of IBVMS, nc is the total number of cubic cells, n and N are
the total number of small and large microspheres respectively, subscripts in n and N
denote volume fractions of microspheres in one unit cube (e.g. n1/8 is the total number
of 1/8th small microspheres located on corners, N1/8 is the total number of 1/8th large
spheres located on corners). The total number of cubic cells (nc) for SC is given by
8 8 / 1 8 / 1 N n nc + = (3)
and experimental mixture ratio of two size groups (or two populations) of microspheres can be related to the model using
8 / 1 8 / 1 1 1 N n N n = (4)
where n1 and N1 are the total number of small and large whole microspheres
respectively.
The d0 in Equation (1) may also be found for general cases from the model consisting
FCC unit cells as
2 1 3 3 2 2 / 1 3 2 8 / 1 3 1 2 / 1 3 1 8 / 1 0 6 ) 4 4 ( 2 1 r r pn r N r N r n r n d c − − + + + = π
. (5)
For the case given in Fig. 2 for the current work where N1/8=0, Equation (5) becomes
2 1 3 3 2 2 / 1 3 1 2 / 1 3 1 8 / 1 0 6 ) 4 4 ( 2 1 r r pn r N r n r n d c − − + + = π (6)
The total number of FCC cells (nc) for general cases is given by
14 2 / 1 8 / 1 2 / 1 8 /
1 n N N
n
nc = + + + (7)
and, for the current case where N1/8=0,
14 2 / 1 2 / 1 8 /
1 n N
n nc
+ +
= . (8)
2 / 1 8 / 1 2 / 1 8 / 1 1 1 4 4 N N n n N n + + = (9)
and for the current case where N1/8=0,
2 / 1 2 / 1 8 / 1 1 1 4 4 N n n N n +
= . (10)
For BCC, d0 in Equation (1) may also be found for general cases from the model as
2 1 3 3 2 1 3 2 8 / 1 3 1 1 3 1 8 / 1 0 6 ) 8 8 ( 2 3 r r pn r N r N r n r n d c − − + + + = π (11)
and, for the case where N1=0, Equation (11) reduces to
2 1 3 3 2 8 / 1 3 1 1 3 1 8 / 1 0 6 ) 8 ( 2 3 r r pn r N r n r n d c − − + + = π
. (12)
The total number of cubic cells (nc) for BCC for general cases is given by
9 1 8 / 1 1 8 /
1 n N N
n
nc = + + + (13)
and for the current case where N1=0, Equation (13) reduces to
9 8 / 1 1 8 /
1 n N
n nc
+ +
= . (14)
The microsphere number ratio for the general cases of BCC is given by
1 8 / 1 1 8 / 1 1 1 8 8 N N n n N n + + = (15)
and, for the current case where N1=0, Equation (15) reduces to
8 / 1 1 8 / 1 1 1 8 N n n N n +
CONSTITUENT MATERIALS EMPLOYED
Hollow microspheres and dry mixture preparation
Ceramic hollow microspheres (composed of silica 55-60%, alumina 36-40%, iron oxide 0.4-0.5% and titanium dioxide 1.4-1.6%) supplied by Envirospheres Pty Ltd, Australia were chosen. Two different size groups (or commercial grades), SL75 and SL300, were employed.
Microsphere sizes were measured using a Malvern 2600C laser particle size analyser and were found to be of approximately Gaussian distribution.
Four different types of dry mixtures (to be referred to as Mixture 1 - 4) were prepared by varying mixture ratio of SL75 to SL300 as listed in Table 1. For mixing of microspheres, a transparent plastic measuring cylinder (500 cm3, 50 mm in diameter) was used. To ensure uniformity of mixing of microspheres, the following procedure was followed: (a) after placing a predetermined mixture of two groups of microspheres in the measuring cylinder, it was turned upside down for 20 times; (b) it was hand shaken in a vertical direction for 20 times; and (c) it was horizontally hand-held and then slowly rotated 10 times clockwise and another 10 times anticlockwise. The whole procedure was repeated once again.
Particle densities and bulk densities were measured using a Beckman Air Comparison Pycnometer (Model 930, Fullerton, California) and a measuring cylinder (capacity 250 cm3) respectively. Three hundred taps were conducted for each bulk density measurement. An average of five measurements was taken and listed with the packing factor of bulk microspheres in Table 2.
Starch for binder
Potato starch (Tung Chun Soy & Canning Company, Hong Kong) was used for binder of hollow microspheres. Particle density of the potato starch was measured using a Beckman Air Comparison Pycnometer (Model 930) and an average of three measurements was found to be 1.50 g/cm3. Bulk density was also measured using a measuring cylinder with a tapping device (300 taps were conducted) and an average of five measurements was found to be 0.85 g/cm3. A gelatinisation temperature range for starch was measured to be 64-69ºC.
PHASE SEPARATION MEASUREMENT OF MIXTURE
Measurements for phase volumes were made prior to adding microspheres. Gelatinised starch (only two phases in this case) was found to settle down in 2 to 6 hours in binder, depending on starch content in binder. After adding microspheres to binder, phase separation (three phases in this case) took 3 to 8 hours in binder, depending on microsphere size and starch content in binder. Tumbling of mixture containing microspheres was conducted after sealing by turning each measuring cylinder upside-down and back up for 20 times manually. This way of tumbling intended to break up possible starch-rich area in binder efficiently [25].
NUMERICAL CALCULATION FOR MINIMUM INTER-MICROSPHERE DISTANCE (MID) IN TOP PHASE
The top phase volume in a mixing container is always larger than the initial bulk volume of microspheres in air (IBVMS) as a result of expansion of IBVMS caused by starch binder between microspheres. An MID may be an indicator of the volume expansion of IBVMS when microspheres are dispersed in the top phase. (The MID is a surface-to-surface distance.) A computer program was written in MATLAB 7.2 (R2006a) to produce 3D models for dispersion of microspheres and to find an MID for a given volume fraction of microspheres. Microspheres with random sizes but with Gaussian distribution as measured for microspheres were created first, and then randomly positioned in a 3D box with dimensions of 2000 x 2000 x 2000 µm. Mean radii corresponding to experimental values, 26.72 and 89.09 µm were nominated for SL75 and SL300 respectively, with respective standard deviations of 7.06 and 29.95 µm.
The 3D dispersion models were created by rejecting microspheres which are closer to existing microspheres than a nominated MID and otherwise accepting microspheres until a nominated volume fraction of microspheres is reached for a given mixture of microspheres. A maximum number of trials for positioning microspheres for a given MID was nominated to be 40,000 in program. Iteration was conducted to find an MID corresponding to a volume fraction of microspheres until the following condition was satisfied:
05 . 0 experiment
from
| Calculated experiment
from |
≤ −
ms
ms ms
v
v v
(17)
where vms is the volume fraction of microspheres.
RESULTS AND DISCUSSION
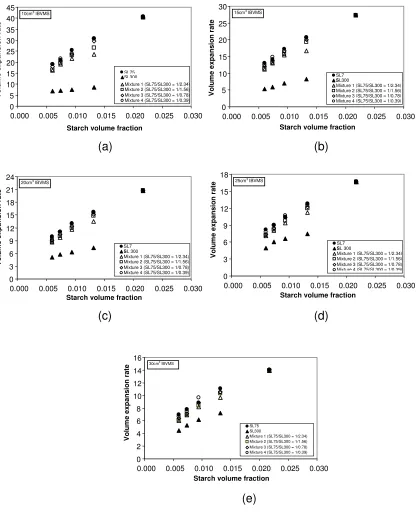
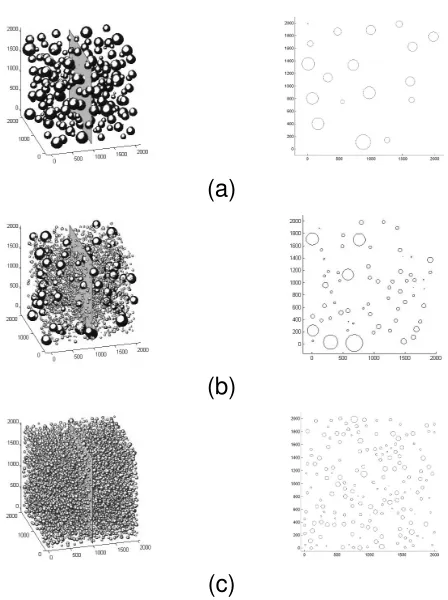
microspheres and low IBVMS but for high starch content, and high content of small microspheres (SL75) in the case of mixtures. The effect of IBVMS on the expansion rate seems to be due to the buoyant force as discussed in reference [25] because the smaller the IBVMS, the lower the buoyant force, giving a smaller squeezing force and hence larger inter-microsphere distances. Also, it is a truism that the volume expansion is caused by a distance increase between microspheres. Once microspheres are wetted with binder, their distances between microspheres would be affected by various factors such as starch content, IBVMS, volume ratio of the microspheres in the mixture, etc. The possibility that microspheres are not in contact with each other was demonstrated in reference [25]. Therefore, it was assumed for the computer modelling that an MID exists in the top phase for a given manufacturing condition. If microspheres are in contact each other, in general, it would be an equivalent MID. Also, the top phase can be assumed as being formed through random positioning of microspheres after the tumbling/stirring. Numerical calculations were conducted on the basis of these two assumptions as detailed in a previous section and some examples of 3D numerical models used for SL300, SL75 and Mixture 1 are given in Fig. 5. The experimental VER versus numerically calculated MID (= d0+de) is shown in Fig. 6 for various starch
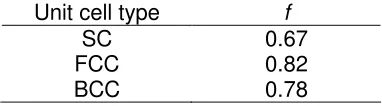
contents and IBVMS with theoretical curves generated according to Equations (2), (6) and (12) for SC, FCC and BCC respectively together with Equation (1). Not much difference between different unit cell models in predicting VER is seen although the packing correction factor (f) in Equation (1) has different values but is independent of mixture type (Table 3). It should be noted that the effect of the packing correction factor (f) on VER is negligibly small for non-mixture groups (SL75 and SL300), confirming that the relations developed here are in generalized form of the VER equation developed for single size microsphere group given in reference [25]. Thus, all the relations derived here appear to be capable of predicting not only microsphere size effect but also mixture ratio effect on VER. The various quantities used for Equations (2), (6) and (12) and values of d0 are listed in Table 4 and Table 5 respectively. Most of values for d0
given in Table 5 are negative and hence unrealistic, reflecting the statistical model does not represent the way of packing in IBVMS. However, they still appear to be valid for microsphere size and mixture ratio effects on VER.
CONCLUSIONS
• Statistical models and theoretical relations for volume expansion rate (VER) of
initial bulk volume of microspheres (IBVMS) have been developed and verified with experimental/numerical data.
• The theoretical relations are for various parameters such as microsphere mean
size, mixture ratio of different microsphere size groups, MID, volume fractions of microspheres, and VER.
ACKNOWLEDGEMENT
provided for Md Mainul Islam, the financial support from The University of Newcastle Research Associates (TUNRA). Also, the authors thank Mr Md Ashraf Ali for microsphere mixture preparation and measurements, and Mr Do-Young Lee of KAIST for computer programming, and Envirospheres Pty Ltd, Australia for supplying ceramic hollow microspheres.
REFERENCES
[1] Kim, H.S.; Plubrai P. Manufacturing and failure mechanisms of syntactic foam under compression. Composites Part A: Applied Science and Manufacturing 2004; 35(9), 1009-15.
[2] Jize, N.N.; Hiel, C.; Ishai, O. In Mechanical performance of composite sandwich beams with syntactic foam cores. Deo, R.B., Saff, C.R., Eds.; ASTM STP 1274, 1996; 125-138.
[3] English, L.K. Lighter weight and lower cost with foam-core composites. Materials Engineering, 1987, 4, 51-54.
[4] Jackson, D.; Clay, P. Syntactic foam sphere improves oceanographic mooring performance. Sea Technology, Sep 1983, 24, 29-31.
[5] Harruff, P.W.; Sandman, B.E. In Carbon/epoxy composite structures for underwater pressure hull applications. Proceedings of 28th National SAMPE Symposium, Anaheim CA, April 12-14, 1983, 40-49.
[6] Watkins, L. In Syntactic foam buoyancy for production risers. Proceedings of the Seventh International Conference on Offshore Mechanical and Artic Engineering, Houston, Texas, Feb 7-12, 1988, 403-410.
[7] Seamark, M.J. Use of syntactic foam for subsea buoyancy. Cellular Polymers, 1991, 10 (4), 308-321.
[8] Hinves, J.B.; Douglas, C.D. The development of a hybrid advanced composite-syntactic foam structural component for use in undersea vehicles. Proceedings of the Conference on Oceans, 1993, Part 3, Oct. 18-12, 468 – 472.
[9] Young, K.S. Value-adding syntactic foams gain in composites applications. Modern Plastics, 1985, 62 (4), 92-97.
[10] Narkis, M.; Gerchcovich, M.; Puterman, M.; Kenig, S. Syntactic foams III. Three-phase materials produced from resin coated microballoons. Journal of Cellular Plastics, 1982, 18 (4), 230-232.
[11] Narkis, M.; Puterman, M.; Boneh, H. Rotational molding of thermosetting three-phase syntactic foams. Polymer Engineering and Science, 1982, 22, 417-421.
[12] Lawrence, E.; Wulfsohn, D.; Pyrz, R. Microstructural characterisation of a syntactic foam. Polymers and Polymer Composites 2001, 9(7), 449-457.
[13] Lawrence, E.; Pyrz, R. Viscoelastic properties of polyethylene syntactic foam with polymer microballoons. Polymers and Polymer Composites 2001, 9(4), 227-237. [14] Rohatgi, P.K.; Kim, J.K.; Gupta, N.; Alaraj,S; Daoud, A. Compressive
[15] Verweij, H.; De With, G.; Veeneman, D. Hollow glass microsphere composites: preparation and properties. Journal of Materials Science 198, 20, 1069-1078.
[16] Narkis, M.; Puterman, M.; Kenig, S. Syntactic foams II. Preparation and characterization of three-phase systems. Journal of Cellular Plastics, 1980, 16 (6), 326-330.
[17] Puterman, M.; Narkis, M.; Kenig, S. Syntactic foams I. Preparation, structure and properties. Journal of Cellular Plastics, 1980, 16 (4), 223-229.
[18] Kenig, S.; Raiter, I.; Narkis, M. Three-phase silicone based syntactic foams. Journal of Cellular Plastics, 1984, 20 (6), 423-429.
[19] Meteer, C. Syntactic foam core material for composite structures, International patent classification: B29C, 65/00, B29D 9/00, B32B 3/26, 5/18.
[20] Kim, H.S.; Oh, H.H. Impact behaviour of syntactic foam. Proceedings of the first ACUN International Composites Meeting on Composites: Innovation and Structural Applications. Sydney, 23-25 February 1999, 83-86.
[21] Kim, H.S.; Oh, H.H. Manufacturing and Impact Behavior of Syntactic Foam. Journal of Applied Polymer Science 2000, 76, 1324-1328.
[22] te Nijenhuis, K.; Addink, R.; van der Vegt, A.K. A study on composites of nylon-6 with hollow glass microspheres. Polymer Bulletin 1989, 2, 467-474.
[23] Kim, H.S. Syntactic foam. International Publication Number: WO 03/074598 A1, International Publication Date: 12 September 2003.
[24] Kim, H.S. Cenosphere composite and method for preparing same. International Publication Number: WO 2006/005119 A1, International Publication Date: 19 January 2006.
[25] Islam, M.M.; Kim, H.S. Manufacture of syntactic foams: pre-mold processing. Materials and Manufacturing Processes 2007; 22(1), 28-36.
[26] Islam, M.M.; Kim, H.S. Manufacture of syntactic foams using starch as binder: post-mold processing. Materials and Manufacturing Processes 2006; in press.
Fig. 1. General model consisting of cubic cells.
[image:11.612.82.489.290.403.2]
(a) (b) (c)
Fig. 2. Three types of unit cells as building blocks for the general model shown in Fig. 1: (a) simple cubic (SC); (b) face centred cubic (FCC); and (c) body centred cubic (BCC) unit cells with diagonal cross sectional view. Each unit cell contains one large sphere representing a group of large microspheres.
Fig. 3. Viscosity of binder consisting of gelatinised starch and water as a function of starch content in water.
a d0
1.414a d0
d0 r1 r2
n cubes
n cubes
0 400 800 1200 1600 2000
0 5 10 15 20 25 30 35 40 45 50 55 Starch content in water (g/l)
V
is
c
o
s
it
y
(
c
e
n
ti
p
o
is
e
[image:11.612.193.417.489.638.2](a) (b)
(c) (d)
[image:12.612.81.500.114.627.2](e)
Fig. 4. Experimental volume expansion rate (VER) (= top phase volume / IBVMS) after tumbling/stirring versus initial granule starch volume fraction in binder: (a) IBVMS = 10 cm3, (b) IBVMS = 15 cm3, (c) IBVMS = 20 cm3, (d) IBVMS = 25 cm3, and (e) IBVMS = 30 cm3.
0 3 6 9 12 15 18
0.000 0.005 0.010 0.015 0.020 0.025 0.030
Starch volume fraction
V o lu m e e x p a n s io n r a te SL7 5 SL 300
Mixture 1 (SL75/SL300 = 1/2.34) Mixture 2 (SL75/SL300 = 1/1.56) Mixture 3 (SL75/SL300 = 1/0.78) Mixture 4 (SL75/SL300 = 1/0.39) 25cm3 IBVMS
0 5 10 15 20 25 30
0.000 0.005 0.010 0.015 0.020 0.025 0.030
Starch volume fraction
V o lu m e e x p a n s io n r a te SL7 5 SL300
Mixture 1 (SL75/SL300 = 1/2.34) Mixture 2 (SL75/SL300 = 1/1.56) Mixture 3 (SL75/SL300 = 1/0.78) Mixture 4 (SL75/SL300 = 1/0.39) 15cm3 IBVMS
0 2 4 6 8 10 12 14 16
0.000 0.005 0.010 0.015 0.020 0.025 0.030
Starch volume fraction
V o lu m e e x p a n s io n r a te SL75 SL300
Mixture 1 (SL75/SL300 = 1/2.34) Mixture 2 (SL75/SL300 = 1/1.56) Mixture 3 (SL75/SL300 = 1/0.78) Mixture 4 (SL75/SL300 = 1/0.39) 30cm3 IBVMS
0 3 6 9 12 15 18 21 24
0.000 0.005 0.010 0.015 0.020 0.025 0.030
Starch volume fraction
V o lu m e e x p a n s io n r a te SL7 5 SL 300
Mixture 1 (SL75/SL300 = 1/2.34) Mixture 2 (SL75/SL300 = 1/1.56) Mixture 3 (SL75/SL300 = 1/0.78) Mixture 4 (SL75/SL300 = 1/0.39) 20cm3 IBVMS
0 5 10 15 20 25 30 35 40 45
0.000 0.005 0.010 0.015 0.020 0.025 0.030
Starch volume fraction
V o lu m e e x p a n s io n r a te SL75 SL300
Mixture 1 (SL75/SL300 = 1/2.34) Mixture 2 (SL75/SL300 = 1/1.56) Mixture 3 (SL75/SL300 = 1/0.78) Mixture 4 (SL75/SL300 = 1/0.39) 10cm3
(a)
(b)
(c)
Fig. 5. Some examples of 3D models with cross sections used for a manufacturing condition with an IBVMS of 30cm3 and a water/starch mass ratio of 110/1: (a) SL300, volume fraction = 0.1240, MID = 120 µm; (b) Mixture 1, volume fractions of SL75/SL300 = 0.0268/0.0626, MID = 50 µm; and (c) SL75, volume fraction = 0.0925, MID = 34 µm. All scale units for the images are in µm.
(a) (b)
Fig. 6. Experimental and theoretical volume expansion rates (VERs) versus MID: (a) SL75 and SL300; and (b) Mixtures 1-4. The theoretical curves are based on Equation (2), Equation (6) and Equation (12) for SC, FCC and BCC respectively together with Equation (1).
0 5 10 15 20 25 30 35 40 45
0 25 50 75 100 125 150 175 200 225 250
Minimum inter-microsphere distance (µm)
V
o
lu
m
e
e
x
p
a
n
s
io
n
r
a
te
W/S = 30/1 W/S = 50/1 W/S = 70/1 W/S = 90/1 W/S = 110/1 SC Model FCC Model BCC Model
Mixture 1 Mixture 2 Mixture 3
Mixture 4
0 5 10 15 20 25 30 35 40 45
0 25 50 75 100 125 150 175 200 225 250
Minimum inter-microsphere distance (µm)
V
o
lu
m
e
e
x
p
a
n
s
io
n
r
a
te
W/S = 30/1 W/S = 50/1 W/S = 70/1 W/S = 90/1 W/S = 110/1 SC Model FCC Model BCC Model
[image:13.612.194.418.83.383.2] [image:13.612.96.518.480.645.2]Table 1. Dry microsphere mixtures of SL75 and SL300.
Mixture type Mass ratio of
SL75/SL300
Volume ratio of SL75/ SL300
Calculated microsphere number
ratio* of SL75/SL300 Mixture 1
Mixture 2 Mixture 3 Mixture 4
1/3 1/2 1/1 2/1
1/2.34 1/1.56 1/0.78 1/0.39
[image:14.612.114.496.289.406.2]15.86/1 23.79/1 47.58/1 95.15/1 *Microsphere number ratio was calculated using mean sizes of microspheres.
Table 2.Particle and bulk densities of hollow microspheres employed.
Hollow
microspheres/mixtures
Particle density
(g/cm3)
Bulk density
(g/cm3)
Packing factor of bulk microspheres SL75
SL300 Mixture 1 Mixture 2 Mixture 3 Mixture 4
0.67 0.86 0.81 0.79 0.76 0.72
0.38 0.41 0.43 0.43 0.42 0.40
0.57 0.48 0.53 0.54 0.55 0.56
Table 3. Packing correction factor (f) in Equation (1) for different unit cell types.
Unit cell type f
SC FCC BCC
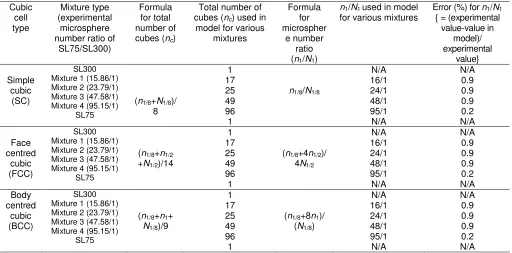
[image:14.612.209.400.458.511.2]Table 4.Various quantitiesusedin the statistical model.Here, n1/8, n1/2, and n1 are the total
numbers of one-eighth, half and whole small microspheres respectively representing SL75 in
the model, and N1/8, N1/2, N1 are total numbers of one-eighth, half and whole large microspheres
respectively representing SL300 in the model.
Cubic cell type Mixture type (experimental microsphere number ratio of
SL75/SL300)
Formula for total number of
cubes (nc)
Total number of
cubes (nc) used in
model for various mixtures Formula for microspher e number ratio
(n1/N1)
n1/N1 used in model
for various mixtures
Error (%) for n1/N1
{ = (experimental value-value in model)/ experimental value} Simple cubic (SC) SL300 Mixture 1 (15.86/1) Mixture 2 (23.79/1) Mixture 3 (47.58/1) Mixture 4 (95.15/1)
SL75
(n1/8+N1/8)/
8 1 17 25 49 96 1
n1/8/N1/8
N/A 16/1 24/1 48/1 95/1 N/A N/A 0.9 0.9 0.9 0.2 N/A Face centred cubic (FCC) SL300 Mixture 1 (15.86/1) Mixture 2 (23.79/1) Mixture 3 (47.58/1) Mixture 4 (95.15/1)
SL75
(n1/8+n1/2
+N1/2)/14
1 17 25 49 96 1
(n1/8+4n1/2)/
4N1/2
N/A 16/1 24/1 48/1 95/1 N/A N/A 0.9 0.9 0.9 0.2 N/A Body centred cubic (BCC) SL300 Mixture 1 (15.86/1) Mixture 2 (23.79/1) Mixture 3 (47.58/1) Mixture 4 (95.15/1)
SL75
(n1/8+n1+
N1/8)/9
1 17 25 49 96 1
(n1/8+8n1)/
(N1/8)
N/A 16/1 24/1 48/1 95/1 N/A N/A 0.9 0.9 0.9 0.2 N/A
Table 5. Values of d0 in Equations (2), (6) and (12).
Hollow microspheres
d0
for SC (µm)
d0
for FCC(µm)
d0
for BCC(µm)
[image:15.612.116.491.437.541.2]