Rochester Institute of Technology
RIT Scholar Works
Theses
4-2019
Effects of Ink, Substrate, and Target Line Width on
the Quality of Lines Printed Using a DMP 3000
Inkjet Printer
Mihir R. Choudhari [email protected]
Follow this and additional works at:https://scholarworks.rit.edu/theses
This Thesis is brought to you for free and open access by RIT Scholar Works. It has been accepted for inclusion in Theses by an authorized administrator of RIT Scholar Works. For more information, please [email protected].
Recommended Citation
Effects of Ink, Substrate, and Target Line Width on the Quality of Lines Printed Using a
DMP 3000 Inkjet Printer
By Mihir R Choudhari
A Thesis submitted in partial fulfillment of the requirements
for the degree of Master of Science in Print Media in the School of Media Sciences
in the College of Art and Design of the Rochester Institute of Technology
April 2019
Primary Thesis Advisor: Christine Heusner, MFA
School of Media Sciences
Rochester Institute of Technology
Rochester, New York
Certificate of Approval
Effect of Ink, Substrate, and Target Line Width on Quality of Lines Printed Using a DMP 3000
Inkjet Printer
This is to certify that the Master’s Thesis of Mihir Ravindra Choudhari
has been approved by the Thesis Committee as satisfactory for the Thesis requirement for the Master of Science in Print Media degree
at the convocation of May 2019, Thesis Committee:
Primary Thesis Advisor Professor Christine Heusner
_____________________________________________________ Secondary Thesis Advisor
Professor Robert Eller
Graduate Program Director Dr. Bruce Myers
______________________________________________________ Administrative Chair
i
Acknowledgements
I wish to express my sincere gratitude to my thesis committee: Prof. Christine Heusner
and Prof. Robert Eller. I would also like to express my sincere gratefulness to my previous
primary advisor Dr. Shu Chang. With the constant support of these people I was able to achieve
my goals. Thanks to Dr. Chang and Prof. Heusner who helped me finding the direction in my
research. My sincere thanks to Prof. Robert Eller, who willingly agreed to be part of my study
and helped throughout the process of creating methodology, data analysis and helping in the
process of reaching my conclusions.
I would also wish sincere gratitude to AMPrint center people specially to my PHD
friends Chaitanya Mahajan and Manoj Meda, these were the people who helped me
understanding the printer. I would also like to thank Dr. Bruce Kahn for allowing me to use the
printer to print my samples.
Thank you to the Printing Application Lab people, specially Dan Clark and Ken Whalen.
They helped me understanding the measuring equipment and allowed me to use it.
Thank you to the School Media Science Program Director and Administrative Chair, Dr.
Bruce Myers, for constant support and help throughout the process. A special thanks to Prof.
John Eldridge and Marcia Carroll for undivided support and providing helping hand as and when
needed. Thank you to my fellow graduate students at RIT and friends for being there for me as
and when required.
Finally, I would like to thank my parents who had constant belief and trust in me and
ii
supported me at work place and helped me balance my thesis work and office work. He had
always faith and belief in me that I could achieve my goals and targets. I would also like to thank
my previous supervisor Mr. Garfield Soman and staff at Hub Print and Postal Services for
i
Table of Contents
Acknowledgements ...i
Table of Contents ...i
List of Figures ...vi
List of Equations ... xiv
Abstract ... xv
Chapter 1 ... 1
Introduction ... 1
Background ... 2
Specialty printing. ... 3
Fine art printing. ... 4
Signage industry. ... 4
Packaging and label industry. ... 5
Production inkjet. ... 5
Specialty inks in inkjet printing. ... 6
Substrate ... 8
Problem Statement ... 9
Reason for Interest ... 9
Chapter 2 ... 11
Theoretical Basis ... 11
Print Quality ... 11
Line Quality ... 12
ISO 24790:2017 ... 13
Two-Factor Factorial Design of Experiments ... 14
ii
Conclusion ... 19
Chapter 3 ... 20
Literature Review ... 20
Print Quality for Inkjet Printing ... 20
Line Quality ... 22
Inkjet Inks ... 23
Properties. ... 25
Substrate ... 27
Inkjet Printer Technologies... 30
Conclusion ... 31
Chapter 4 ... 33
Research Objectives ... 33
Research Hypotheses ... 33
Chapter 5 ... 34
Methodology ... 34
Procedure ... 34
Preliminary testing. ... 35
Design of test target. ... 36
Design of the experiment. ... 36
Choose the experimental design. ... 37
Variable factors. ... 37
Controlled factors. ... 39
Response variables. ... 40
Sample printing. ... 40
Measurement. ... 40
iii
Data analysis. ... 41
Develop findings and conclusions... 41
Chapter 6 ... 42
Results and Data Analysis ... 42
Data Summary ... 42
Data Analysis ... 46
Results by DOE ... 47
DOE 1 results for line width conformance to specified width (63.5 μm). ... 48
Discussion of significance. ... 50
DOE 2 results for line width conformance to specified width (95.3 μm). ... 51
Discussion of significance. ... 53
DOE 3 results for line width conformance to specified width (190.5 μm). ... 54
Discussion of significance. ... 56
DOE 4 results for line width conformance to specified width (317.5 μm). ... 57
Discussion of significance. ... 59
DOE 5 results for line 1 blurriness. ... 60
Discussion of significance. ... 61
DOE 6 results for line 2 blurriness. ... 63
Discussion of significance. ... 64
DOE 7 results for line 3 blurriness. ... 66
Discussion of significance. ... 67
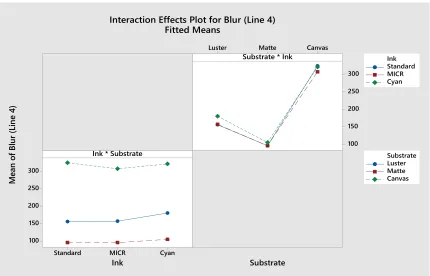
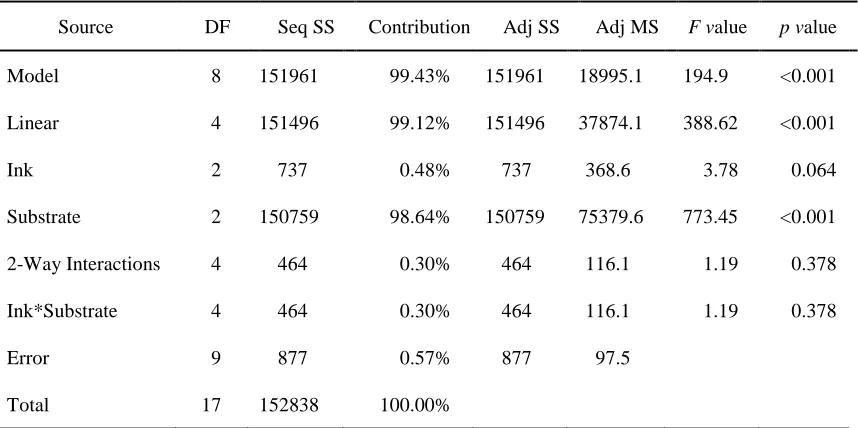
DOE 8 results for line 4 blurriness. ... 69
Discussion of significance. ... 70
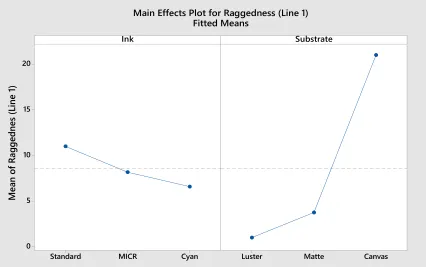
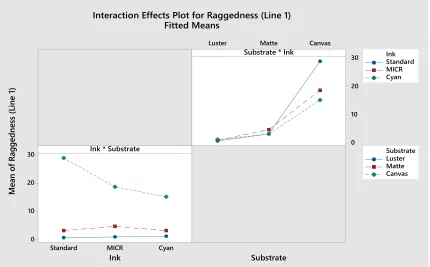
DOE 9 results for line 1 raggedness. ... 72
Discussion of significance. ... 74
DOE 10 results for line 2 raggedness. ... 75
iv
DOE 11 results for line 3 raggedness. ... 78
Discussion of significance. ... 80
DOE 12 results for line 4 raggedness. ... 81
Discussion of significance. ... 83
Conclusion ... 84
Chapter 7 ... 85
Conclusions ... 85
Research Conclusions ... 85
Effect of substrate on response variables. ... 85
Effect of ink on response variables. ... 87
Effect of line width on response variables. ... 89
Comparison to the Results of Prior Research ... 90
Implications for the Graphic Arts Industry ... 92
Bibliography ... 93
Appendix A: ... 98
SOP for designing the test target ... 98
Appendix B ... 99
Calculations for determining the Line width and Addressability of printer. ... 99
Appendix C ... 100
v List of Tables
Table 1 Test Statistics for a Full Factorial 32 Designed Experiment with Two Replicates ... 19
Table 2 Properties of Ink Used in this Research ... 38
Table 3 Properties of Substrate Used in this Research ... 39
Table 4 Line width conformance measurement for all four lines in mm ... 43
Table 5 Blurriness measurement for all four lines in mm ... 44
Table 6 Raggedness measurement for all four lines in mm ... 45
Table 7 Analysis of Variance for Conformance to Specified Width (Line 1)... 50
Table 8 Analysis of Variance for Conformance to Specified Width (Line 2)... 53
Table 9 Analysis of Variance for Conformance to Specified Width (Line 3)... 56
Table 10 Analysis of Variance for Conformance to Specified Width (Line 4)... 59
Table 11 Analysis of Variance for Blurriness (Line 1) ... 62
Table 12 Analysis of Variance for Blurriness (Line 2) ... 65
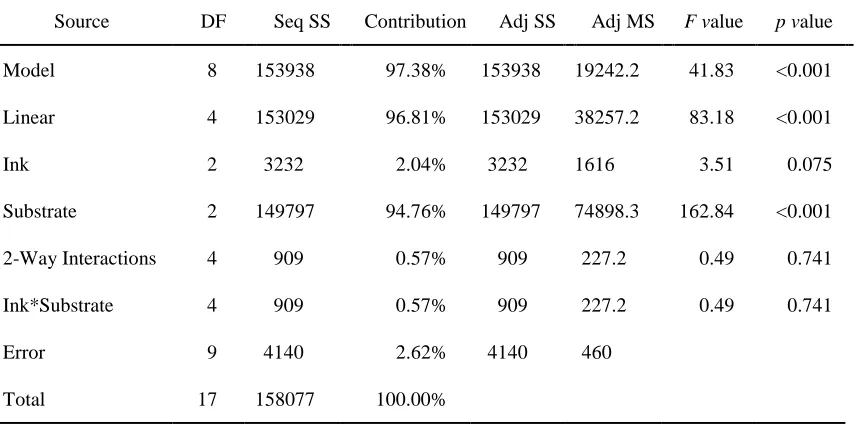
Table 13 Analysis of Variance for Blurriness (Line 3) ... 68
Table 14 Analysis of Variance for Blurriness (Line 4) ... 71
Table 15 Analysis of Variance for Raggedness (Line 1)... 74
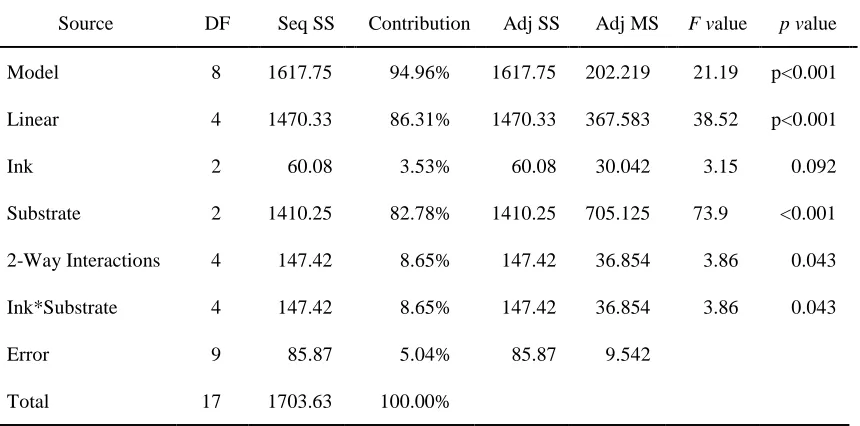
Table 16 Analysis of Variance for Raggedness (Line 2)... 77
Table 17 Analysis of Variance for Raggedness (Line 3)... 80
Table 18 Analysis of Variance for Raggedness (Line 4)... 83
Table 19 Effect of Substrate on Performance Metrics ... 86
Table 20 Effect of Ink on Performance Metrics ... 88
vi List of Figures
Figure 1. Workflow of the experimental process ... 34
Figure 2. Workflow for conducting the preliminary test. ... 35
Figure 3. Test target design ... 36
Figure 4. Main Effects Plot for Printed Width Nonconformance to Line 1 Specified Width (63.5
μm). The Main Effects chart plots observed Line nonconformance (μm) on the vertical
axis versus the levels of inks and substrates investigated on the horizontal axis. The
dashed line is the mean effect of all inks and all substrates. If the null hypothesis is true,
the observed effects will be close to this line. The greater the distance between a factor’s
effects and the mean line, the greater the likehood that a real effect is present. ... 48
Figure 5. Interaction Plot for Printed Width Non-Conformance to Line 1 Specified Width. If the
null hypothesis is true, the interaction plot will display family of three lines, all having
the same shape as the Main Effect plot for the first variable listed in the interaction. If all
three lines do not share this shape, an interaction is present. ... 49
Figure 6. Main Effects Plot for Printed Width Nonconformance to Line 2 Specified Width (95.3
μm). The Main Effects chart plots observed Line nonconformance (μm) on the vertical
axis versus the levels of inks and substrates investigated on the horizontal axis. The
dashed line is the mean effect of all inks and all substrates. If the null hypothesis is true,
the observed effects will be close to this line. The greater the distance between a factor’s
effects and the mean line, the greater the likehood that a real effect is present. ... 51
Figure 7. Interaction Plot for Printed Width Non-Conformance to Line 2 Specified Width. If the
vii
the same shape as the Main Effect plot for the first variable listed in the interaction. If all
three lines do not share this shape, an interaction is present. ... 52
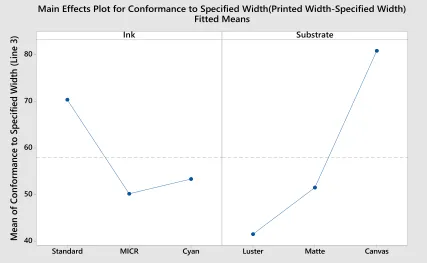
Figure 8. Main Effects Plot for Printed Width Nonconformance to Line 3 Specified Width (190.5
μm). The Main Effects chart plots observed Line nonconformance (μm) on the vertical
axis versus the levels of inks and substrates investigated on the horizontal axis. The
dashed line is the mean effect of all inks and all substrates. If the null hypothesis is true,
the observed effects will be close to this line. The greater the distance between a factor’s
effects and the mean line, the greater the likehood that a real effect is present. ... 54
Figure 9. Interaction Plot for Printed Width Non-Conformance to Line 3 Specified Width. If the
null hypothesis is true, the interaction plot will display family of three lines, all having
the same shape as the Main Effect plot for the first variable listed in the interaction. If all
three lines do not share this shape, an interaction is present. ... 55
Figure 10. Main Effects Plot for Printed Width Nonconformance to Line 4 Specified Width
(317.5 μm). The Main Effects chart plots observed Line nonconformance (μm) on the
vertical axis versus the levels of inks and substrates investigated on the horizontal axis.
The dashed line is the mean effect of all inks and all substrates. If the null hypothesis is
true, the observed effects will be close to this line. The greater the distance between a
factor’s effects and the mean line, the greater the likehood that a real effect is present. . 57
Figure 11. Interaction Plot for Printed Width Non-Conformance to Line 4 Specified Width. If the
null hypothesis is true, the interaction plot will display family of three lines, all having
the same shape as the Main Effect plot for the first variable listed in the interaction. If all
viii
Figure 12. Main Effects Plot for Blurriness Specified Line Width (63.5 μm). The Main Effects
chart plots observed Line blur (μm) on the vertical axis versus the levels of inks and
substrates investigated on the horizontal axis. The dashed line is the mean effect of all
inks and all substrates. If the null hypothesis is true, the observed effects will be close to
this line. The greater the distance between a factor’s effects and the mean line, the greater
the likehood that a real effect is present. ... 60
Figure 13. Interaction Plot for Blurriness Specified Line Width (63.5 μm). If the null hypothesis
is true, the interaction plot will display of family of three lines, all having the same shape
as the Main Effect plot for the first variable listed in the interaction. If all three lines do
not share this shape, an interaction is present. ... 61
Figure 14. Main Effects Plot for Blurriness Specified Line Width (95.3 μm). The Main Effects
chart plots observed Line blur (μm) on the vertical axis versus the levels of inks and
substrates investigated on the horizontal axis. The dashed line is the mean effect of all
inks and all substrates. If the null hypothesis is true, the observed effects will be close to
this line. The greater the distance between a factor’s effects and the mean line, the greater
the likehood that a real effect is present. ... 63
Figure 15. Interaction Plot for Blurriness Specified Line Width (95.3 μm). If the null hypothesis
is true, the interaction plot will display family of three lines, all having the same shape as
the Main Effect plot for the first variable listed in the interaction. If all three lines do not
share this shape, an interaction is present. ... 64
Figure 16. Main Effects Plot for Blurriness Specified Line Width (190.5 μm). The Main Effects
chart plots observed Line blur (μm) on the vertical axis versus the levels of inks and
ix
inks and all substrates. If the null hypothesis is true, the observed effects will be close to
this line. The greater the distance between a factor’s effects and the mean line, the greater
the likehood that a real effect is present. ... 66
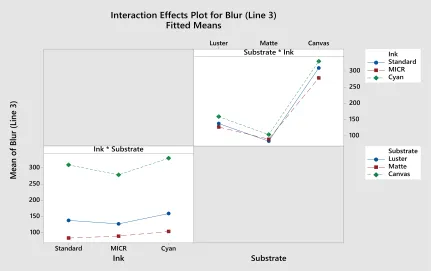
Figure 17. Interaction Plot for Blurriness Specified Line Width (190.5 μm). If the null
hypothesis is true, the interaction plot will display family of three lines, all having the
same shape as the Main Effect plot for the first variable listed in the interaction. If all
three lines do not share this shape, an interaction is present. ... 67
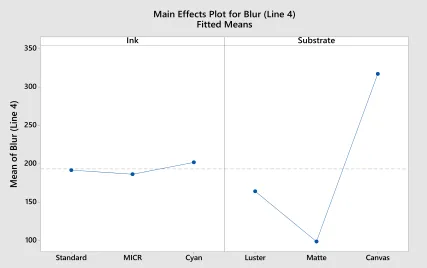
Figure 18. Main Effects Plot for Blurriness Line 4 Specified Width. The Main Effects chart plots
observed Blurriness for each level of ink and substrate on the vertical axis versus the
levels investigated on the horizontal axis. The dash line is the mean effect of all inks and
all substrates. If the null hypothesis is true, the observed effects will be close to this line.
The further an observed effect is from the mean, the greater the effect of that factor and
level on Blurriness. ... 69
Figure 19. Interaction Plot for Blurriness Specified Line Width (317.5 μm). If the null
hypothesis is true, the interaction plot will display of family of three lines, all having the
same shape as the Main Effect plot for the first variable listed in the interaction. If all
three lines do not share this shape, an interaction is present. ... 70
Figure 20. Main Effects Plot for Raggedness Specified Line Width (63.5μm). The Main Effects
chart plots observed Raggedness for each level of ink and substrate on the vertical axis
versus the levels investigated on the horizontal axis. The dash line is the mean effect of
all inks and all substrates. If the null hypothesis is true, the observed effects will be close
to this line. The greater the distance between a factor’s effects and the mean line, the
x
Figure 21. Interaction Plot for Raggedness Specified Line Width (63.5 μm). If the null
hypothesis is true, the interaction plot will display of family of three lines, all having the
same shape as the Main Effect plot for the first variable listed in the interaction. If all
three lines do not share this shape, an interaction is present. ... 73
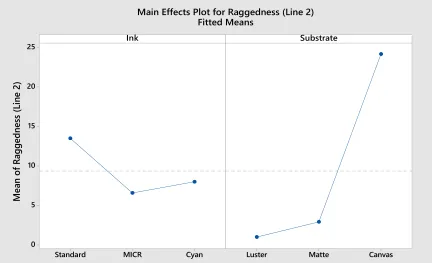
Figure 22. Main Effects Plot for Raggedness Specified Line Width (95.3μm). The Main Effects
chart plots observed Raggedness for each level of ink and substrate on the vertical axis
versus the levels investigated on the horizontal axis. The dash line is the mean effect of
all inks and all substrates. If the null hypothesis is true, the observed effects will be close
to this line. The greater the distance between a factor’s effects and the mean line, the
greater the likelihood that a real effect is present. ... 75
Figure 23. Interaction Plot for Raggedness Specified Line Width (95.3 μm). If the null
hypothesis is true, the interaction plot will display of family of three lines, all having the
same shape as the Main Effect plot for the first variable listed in the interaction. If all
three lines do not share this shape, an interaction is present. ... 76
Figure 24. Main Effects Plot for Raggedness Specified Line Width (190.5μm). The Main Effects
chart plots observed Raggedness for each level of ink and substrate on the vertical axis
versus the levels investigated on the horizontal axis. The dash line is the mean effect of
all inks and all substrates. If the null hypothesis is true, the observed effects will be close
to this line. The greater the distance between a factor’s effects and the mean line, the
greater the likelihood that a real effect is present. ... 78
Figure 25. Interaction Plot for Raggedness Specified Line Width (190.5 μm). If the null
xi
same shape as the Main Effect plot for the first variable listed in the interaction. If all
three lines do not share this shape, an interaction is present. ... 79
Figure 26. Main Effects Plot for Raggedness Specified Line Width (317.5μm). The Main Effects
chart plots observed Raggedness for each level of ink and substrate on the vertical axis
versus the levels investigated on the horizontal axis. The dash line is the mean effect of
all inks and all substrates. If the null hypothesis is true, the observed effects will be close
to this line. The greater the distance between a factor’s effects and the mean line, the
greater the likelihood that a real effect is present. ... 81
Figure 27. Interaction Plot for Raggedness Specified Line Width (317.5 μm). If the null
hypothesis is true, the interaction plot will display family of three lines, all having the
same shape as the Main Effect plot for the first variable listed in the interaction. If all
three lines do not share this shape, an interaction is present. ... 82
Figure 28. Normal Probability Plot of Residuals for printed width non-conformance to Line 1
Specified width(63.5μm). Residuals, the difference between predicted and actual values,
should be normally distributed if the model is free from biases. On this plot the straight
line shows the normal distribution best fitting the residuals. No unexpected deviations
from normality were observed. ... 100
Figure 29. Normal Probability Plot of Residuals for printed width non-conformance to Line 2
Specified width(95.3μm). Residuals, the difference between predicted and actual values,
should be normally distributed if the model is free from biases. On this plot the straight
line shows the normal distribution best fitting the residuals from normality were
xii
Figure 30. Normal Probability Plot of Residuals for printed width non-conformance to Line 3
Specified width(190.5μm). Residuals, the difference between predicted and actual values,
should be normally distributed if the model is free from biases. On this plot the straight
line shows the normal distribution best fitting the residuals from normality were
observed. ... 103
Figure 31. Normal Probability Plot of Residuals for printed width non-conformance to Line 4
Specified width(317.5μm). Residuals, the difference between predicted and actual values,
should be normally distributed if the model is free from biases. On this plot the straight
line shows the normal distribution best fitting the residuals from normality were
observed. ... 104
Figure 32. Normal Probability Plot of Residuals for Blurriness Specified Line Width (63.5μm).
Residuals, the difference between predicted and actual values, should be normally
distributed if the model is free from biases. On this plot the straight line shows the normal
distribution best fitting the residuals from normality were observed. ... 105
Figure 33. Normal Probability Plot of Residuals for Blurriness Specified Line Width (95.3μm).
Residuals, the difference between predicted and actual values, should be normally
distributed if the model is free from biases. On this plot the straight line shows the normal
distribution best fitting the residuals from normality were observed. ... 106
Figure 34. Normal Probability Plot of Residuals for Blurriness Specified Line Width (190.5μm).
Residuals, the difference between predicted and actual values, should be normally
distributed if the model is free from biases. On this plot the straight line shows the normal
xiii
Figure 35. Normal Probability Plot of Residuals for Blurriness Specified Line Width (317.5μm).
Residuals, the difference between predicted and actual values, should be normally
distributed if the model is free from biases. On this plot the straight line shows the normal
distribution best fitting the residuals from normality were observed. ... 108
Figure 36. Normal Probability Plot of Residuals for Raggedness Specified Line Width (63.5μm).
Residuals, the difference between predicted and actual values, should be normally
distributed if the model is free from biases. On this plot the straight line shows the normal
distribution best fitting the residuals from normality were observed. ... 109
Figure 37. Normal Probability Plot of Residuals for Raggedness Specified Line Width (95.3μm).
Residuals, the difference between predicted and actual values, should be normally
distributed if the model is free from biases. On this plot the straight line shows the normal
distribution best fitting the residuals from normality were observed. ... 110
Figure 38. Normal Probability Plot of Residuals for Raggedness Specified Line Width
(190.5μm). Residuals, the difference between predicted and actual values, should be
normally distributed if the model is free from biases. On this plot the straight line shows
the normal distribution best fitting the residuals from normality were observed. ... 111
Figure 39. Normal Probability Plot of Residuals for Raggedness Specified Line Width
(317.5μm). Residuals, the difference between predicted and actual values, should be
normally distributed if the model is free from biases. On this plot the straight line shows
xiv
List of Equations
(1) ... 16
(2) ... 17
(3) ... 17
(4) ... 17
(5) ... 17
(6) ... 17
(7) ... 17
(8) ... 17
(9) ... 17
(10) ... 17
(11) ... 17
xv Abstract
This thesis is concerned with the image quality analysis of inkjet lines printed on
substrates. ISO 24790 compliant lines are designed and printed on a substrate with a
drop-on-demand inkjet printer. This study analyzes three print quality attributes of line: width, blurriness,
and raggedness.
The research used cyan, magnetic and standard inks to print the same design on various
substrates having differences in gloss and texture. The chosen inks were measured using a
rheometer to determine a viscosity range. The effects of substrate structural parameters, such as
texture, finishing, weight, and ink type on line quality, are discussed. The printed lines were
measured using a charged coupled device camera. The print attributes were measured, and
statistical analysis was conducted. Based on this analysis, it was observed that substrate has
significant effect on all the response variables. The substrate which produced best result is luster
for raggedness and line width conformity and matte for blurriness. Ink has significant effect on
the line width conformity and raggedness whereas there is no significant effect of inks on
blurriness. There is no effect of increase in the line width on any of the response variables. A
design of experiment methodology was successfully implemented to determine the effect of
1 Chapter 1
Introduction
Inkjet printing is attracting the attention of various industries because of its
non-impact printing technique. This technology is breaking through into industries, such as
packaging, large format printing, decorative printing, and micro-electro-mechanical
systems (MEMs), as reported by the Marketsandmarkets.com. In one of their reports, it
was predicted that the digital printing packaging market would reach $42.11 billion by
2026, an increase from $11.42 billion in 2016 (Marketsandmarkets.com, 2016). In a later
report, it was predicted that the digital printing market would rise from US $21.08 billion
in 2016 to US $28.85 billion by 2023 (Marketsandmarkets.com, 2017a). The large format
printing industry, whose major contributor is inkjet-based printers, is predicted to
increase its market share from $8.37 billion in 2016 to about $11 billion in 2023
(Marketsandmarkets.com, 2017b). In another study conducted by Smithers Pira, it is
stated that inkjet print sales in 2015 were $57 billion, and that figure is predicted to rise to
$91.5 billion by 2021 at an average compound annual growth rate (CAGR) of 8.2%
(Smithers Pira, 2017b). Those figures indicate that the market for the inkjet-based
printers is going to only rise and will not decrease. Product development of inkjet
printing papers has accelerated greatly to meet the rapidly growing market for inkjet
printing (Lee, Joyce, & Fleming, 2005).
According to the recent study conducted by Smithers Pira, the usage of inkjet
2
(Smithers Pira, 2017c). Single pass, variable drop, and greyscale printhead developments
have taken inkjet printing into mainstream production. Due to these advancements, it is
predicted that the next generation of inkjet digital printing technology will have qualities
such as having image quality comparable to offset, compatibility with coated and
uncoated papers, high-speed printing, and variability (Smithers Pira, 2013). Inkjet
printing is a strong competitor to screen printing in the wide format printing segment.
There has been significant investment in inkjet technologies in recent years. For example,
Boer (2015) states that more than $10 billion have been invested since 2008 in inkjet
research and development (R&D). The researcher also states that in 2014 more than $1
billion was invested on non-consumer inkjet applications. Approximately 200+ inkjet
system equipment integrators are investing in inkjet development, which includes
production inkjet printing and wide-format signage (Boer, 2015).
Background
Increase in the use of inkjet technology has influenced the rise in new inkjet ink
formulations (Savastano, 2016). The requirement for ink formulations for inkjet printing
are that the ink should be able to jet through the micro holes, then settle on the substrate
(Kipphan, 2001). In a report by inkworldmagazine.com, it is said that printing companies
are working to advance inkjet inks to meet customer requirements. In the same report,
Sun Chemical Business Director Peter Saunders states,
The reality is that the inks used in all digital printing sectors are very different. In
3
must separate R&D groups working on the needs of each application. The common
factor is that all inks need to jet and function reliably, so the understanding we have
gained of the influence of ink chemistry on the physics of inkjet printing is essential
in all ink development (Savastano, 2016, para. 20).
In the same report, it is said that there would be a rise in the demand for pigment
inks for the textile market (Savastano, 2016). New inkjet ink formulations are being
devised to meet market demands (Smithers Pira, 2013).
The advancement of inkjet technology to make it compatible with specialty inks
and substrates has made it an attractive option to new printing markets (Boer, 2015).
Cahill and Taylor expressed that adoption of inkjet printing is unstoppable (Cahill &
Taylor, 2015). This technology has had a major impact on various sectors and industries.
The state-of-the-art design of an inkjet printer to jet the droplets of ink makes it one of
the favorable technology in areas such as biological printing, printed electronics, display
graphics (Singh et al., 2010). Drop-on-demand inkjet printing has gained attention
because of the simplicity of its technology, its convenience to use, and its lower expense
(Kwon et al., 2015). The printer used for this research is a drop-on-demand inkjet printer.
Specialty printing. Specialty printing is the term used to describe any special
effect during the printing. Examples of specialty printing are building wraps, billboards,
ceramic tiles, day/light backlit, vehicle graphics, window graphics, floor graphics, spot
colors, metallic inks, white inks, membrane panels, and shrink wrap (Moloney & Nate,
4
used to print a circuit on a board, usually called a printed circuit board (PCB) (Singh et
al., 2010). Specialty printing has affected certain industries; these industries can be
classified as fine art printing, the sign and label industry, and production inkjet. How
these industries are progressing and are being affected by inkjet technology is discussed
in detail below.
Fine art printing. Fine art printing is a relatively new process through which the
work of artists and designers can be reproduced. Earlier artists were dependent only on
oil paints or varnishes to create a masterpiece of their ideas. The challenge for these
artists was to re-create the same masterpiece with exact precision. Now this challenge has
been resolved to an extent where the masterpiece can be digitally re-created; this process
of re-creation of art is termed fine art printing (Romano, 2014). Romano makes analysis
of art with respect to printing and discusses different substrates. Apart from these new
innovations in the industry, people are also concerned with the quality of print. The most
primary concerns are image quality and color quality (Romano, 2014).
Signage industry. A significant increase in the usage of inkjet printing has been
seen in the sign and graphic art industries. Specialty Graphic Imaging Association
(SGIA) indicates in one of their trend reports that, for the sign and graphic art industry,
there has been a significant increase in the usage of the inkjet technology from 2012 to
2017, especially in the wide format segment. These inkjet printers are both
piezoelectric-based and thermal printers with piezoelectric being the most popular. Production inkjet is
being considered as a replacement for offset print processes, allowing shops to
5
Packaging and label industry. The packaging and label industry is adopting
inkjet printing. Digital printing is slowly making its impact on this industry, which was
worth $13.4 billion in 2017, is forecasted to hit around $22 billion by 2022 (Smithers
Pira, 2017). Another recent study conducted by Smithers Pira states that by 2022, the
increase in this industry would be to $22.4 billion with a 13% CAGR (Smithers Pira,
2017a). There is a consistent increase projected indicating that inkjet is making an impact
on this industry. The packaging industry relies heavily on flexography as its primary print
technology. Inkjet printing is slowly penetrating this industry through the channel of
hybrid printing. With the addition of digital inkjet, conventional flexography presses
become hybrid print systems. There will be a significant shift of demand for retrofitted
digital inkjet solutions over traditional flexographic printers (Pittman, 2018).
Production inkjet. Inkjet technology-based production printers are often referred
to as production inkjet. One of the reports published by SGIA found that printers
adopting the production inkjet are having many benefits like expanding their capabilities,
enabling to generate new business opportunities, reduce cost per job and deliver more
consistent job-to-job color (SGIA). One of the reports on inkjet states that, inkjet printing
is competitive with offset printing and could also be used for high-volume printing. Inkjet
printing often has better image quality, affordability, and productivity, and it is slowly
nearing offset and toner volumes (Boer, 2015; Gustavson, 2015). Developments in inkjet
printing are happening at a rapid pace and at very competitive levels as manufacturers
want to stay ahead in the competition and make a broader range of applications eligible
6
targeted lists, and multi-channel marketing in the direct mail segment. High speed, high
productivity, and low running costs are driving the adaptation of inkjet printing in
commercial sector. Inkjet printing can help reduce cost and improve operational
efficiency (Gustavson, 2015). In the same report published by SGIA it surveyed the
printers using production inkjet and found that 86% of the responses for adopting this
technology was “Very Satisfying” or “Satisfying”. Inkjet printing is slowly closing gaps
between offset and digital print crossover points. Inkjet technology has been influential
on the printing industry, especially in the segments of fine art printing, signage industry,
packaging and label industry and production inkjet. Next the variety of inkjet inks will be
discussed.
Specialty inks in inkjet printing. With the advancement in digital inkjet
technology, there has also been rise in ink R&D (Singh et al., 2010). Inks which add extra
features to the print are being continually developed. These special characteristic inks are
termed specialty inks. Examples of specialty inks are metallic, magnetic, UV invisible,
photochromic, and hydrochromic inks. The special characteristic of the ink is based on
the application and properties of the ink. As an example, hydrochromic inks change color
when they are wet. This means when the ink comes in contact with water the color of the
white ink is changed to another color. This ink consists of pigments which provide this
special feature.
These specialty inks are making their way into the market. These inks, such as
7
commercial screen printing. Screen printing can accommodate a wide range of materials
and uses higher durable inks for variety of applications like outdoor display (Macdougall,
2008). Screen printing has other challenges, including the time taken to create the screen,
to make the prints, and to clean the screen; so overall this is lengthy process and labor
intensive (Macdougall, 2008). Therefore, industries have been looking for a much faster
solution. The physical properties of screen ink differ from those of inkjet inks. Screen
printing inks are a thick paste indicating, higher viscosity and surface tension, and the
additives present in them can have a large particle size (Macdougall, 2008). Screen
printing was widely used for specialty printing, but now with the advancement in inkjet
technology, inkjet printing is being adopted for specialty printing (Cahill & Taylor,
2015).
The adoption of specialty inks for inkjet printing has its challenges. The physical
characteristics of inkjet inks are completely different from the characteristics of screen
inks. The challenge for such an ink is to maintain its extraordinary characteristics and be
able to jet through the inkjet nozzle. In addition, physical characteristics like viscosity,
particle size, and surface tension should be as low as possible. Companies such as the
Diversified Nano Solution Corp (DNSC) are producing specialty inks for inkjet printing.
These specialty inks which produce extraordinary effects can be used in a wide variety of
applications, including security printing, textiles, temperature indication, tinting, and
safety hazard indication.
8 Substrate
Any surface or material which receives a print can be termed a substrate
(Kipphan, 2001). The substrate plays an important role in non-impact printing (NIP)
printing processes such as inkjet. A report published by printing impression, interviewed
Len Lauer, CEO of Memjet, he mentioned that “Inkjet now has the fast speed, high print
quality and great vibrancy needed to produce high quality images on a range of different
substrates” (Michelson, 2018).The nature of printability is influenced by the porosity and
surface condition of the substrate. Print sharpness is one of the parameters used to
determine the characteristics of the substrate. Print sharpness is measured based on paper
properties, including roughness, gloss, pore size of coating, pore size distribution,
pigment particle size, and shape of the particles (Jing-lei et al., 2011). The surface
properties of the substrate play a key role in the print quality of inkjet printing. There are
several inkjet papers available on the market to use; thus, designers, curators, and
publishers can choose from a variety of substrate for their projects. However, these
stakeholders heavily rely on the aesthetics of print. The print is affected by the surface
properties of the substrate (Jing-lei et al., 2011).
The paper properties should be considered in the printing process to evaluate the
interaction between ink and substrate (Wu, Pekarovicova, & Fleming, 2007). In multiple
studies, it has been observed that the structure and finishing of the paper substrate
influences the print quality (Lee et al., 2005). Print quality is dependent on the surface
properties of the substrate. The substrate surface properties will be the deciding factors to
9
The fine art reproduction market is embracing inkjet technology. An art
reproduction is generally made on a fine art substrate, wherein the copy resembles the
original work. Fine art printing with digital technology is gaining recognition; researchers
have started to analyze the effects of paper properties such as porosity, texture,
roughness, gloss, whiteness, basis weight, and brightness on print quality (Gamm, Frey,
& Farnand, 2011). Substrates chosen for this study are based on the differences in the
structural properties, finish, porosity, and texture of these substrates.
Problem Statement
The use of inkjet printing is expanding because many printers have been able to
use inkjet to increase their profitability (Gustavson, 2015). However, as inkjet diversifies
to the use of unfamiliar substrates and inks, adhering to acceptable levels of print quality
is major challenge (Castrejon-Pita et al., 2013). With the diversity of requirements by
customers there is an increase in usage of inkjet in different graphic industries and an
increase in the variety of substrates and variety of inks. Therefore, it is critical to evaluate
the interaction inks and substrates. The research seeks to evaluate print quality to yield
results that analyze the interaction between inks and substrates in inkjet printing.
Reason for Interest
The number of inkjet-based applications is increasing, so there is demand for print
quality assessment. The researcher is fascinated by the influence of inkjet technology on
10
fine art. Apart from this, the researcher has a background in the engineering field which
has influenced him to pursue an objective evaluation and experimental-based study. This
study will seek to evaluate the effect of surface properties of the substrate on print quality
11 Chapter 2
Theoretical Basis
This chapter provides the theoretical basis to the research. This chapter covers
attributes effecting print quality, and it reviews the basis for analysis of line quality. The
chapter concludes with a review of Design of Experiments (DOE).
Print Quality
Print quality (PQ) is defined as quality of a hardcopy output of a printer.
ISO-13660 defined 14 print quality attributes to solve some problems related to PQ. These PQ
attributes are blurriness, raggedness, line width, character darkness, contrast, fill,
extraneous marks, character fill, character field, darkness, background haze, graininess,
mottle, background, and voids. Among these PQ attributes, three are classified as line
quality attributes, which are blurriness, raggedness and line width (Briggs, Forrest, Klein,
& Tse, 1999).
PQ is often measured using subjective evaluation methods. In these methods,
printed samples are shown to a target audience and, based on their response, an
evaluation is conducted. Two reasons often cited for this approach are the unavailability
of a certified measuring device and tradition (Streckel, et al., 2003). With the
technological advancement in image capture devices, such as flatbed scanners and the
digital camera, today objective evaluation is often used to analyze print quality. Objective
12
the help of a machine, then evaluating the results (Jiang, Xu, Liu, & Huang, 2010).
“Objective evaluation gives more accurate results than does subjective evaluation” (Jiang
et al., 2010, p. 1). The researcher has chosen an objective evaluation method to determine
print quality in this research.
Line Quality
Line quality is used to assess the line output of printers. The attributes of line
quality are line width, raggedness, and blurriness (ISO, 2017). Line quality attributes
(defined below) are important to this study.
• Blurriness: “Appearance of being hazy and indistinct in outline, a noticeable
transition of darkness from line element to background substrate whose
intended transition width is zero” (ISO, 2017, p.2).
• Raggedness: “Appearance of geometric distinction of an edge from its ideal
position” (ISO, 2017, p.4)
• Line Width: “Average stroke width, where the stroke width is measured from
edge to edge along a line normal to center line of the image element” (ISO,
2017, p.3).
Line quality attributes are independent of subjective evaluation (Dalal et al.,
1998). Dalal et al. (1998) evaluated overall image quality for printed hardcopy output and
mentioned line quality as high-level-image quality descriptor. A high-level image
13
also found that line quality helps in finding jagged lines due to printer resolution, fuzzy
lines due to ink bleed, toner splatter or poor registration, and lines with poor
discriminability (Dalal et al., 1998). Therefore, the researcher uses line quality attributes
to provide information about the ink/media interaction. Line quality has been often used
to assess the print quality of digital printers (i.e., an inkjet printer and a digital printer)
(Song, Wang, & Xu, 2013).
ISO 24790:2017
ISO 24790:2017 specifies device-independent image quality attributes,
measurement methods, and analytical procedures to describe the quality of output of
images from printers (ISO, 2017). The attributes, methods, and procedures rely on
measurable properties of printed text and graphic images. As ISO 24790:2017 is the most
recent standard, the least amount of research has been conducted using this standard. The
earlier version of the standard (i.e., ISO 13660:2001) was used widely to evaluate print
quality attributes of inkjet prints. ISO 24790:2017 defines procedures and algorithms to
conduct measurements of printed lines. Blurriness, raggedness, line width, character
darkness, contrast, and fill are some of the character and line attributes which this
standard discusses. There are a total fourteen attributes that can be used to solve problems
related to print quality (Briggs et al.,1999) according to the standard.
In ISO 24790:2107, line set is defined based on the resolution of the printer and
the intended line width. The addressability given by the standard for the line set is 800
14
have to be created in a vector software. Once the lines are created, they can be printed,
and then line attributes can be captured using a scanner or camera device (ISO, 2017).
The researcher will use ISO 24790:2017 to design the test target because line quality
attributes are defined in this standard.
Two-Factor Factorial Design of Experiments
This study will rely on Design of Experiments (DOE). This experiment has
various parameters that must be discussed, including the process parameters, target
parameters (line width), and the variability with respect to the desired line width. The
variation in the process parameters makes it important to discuss the strategy, basic
principles, and guidelines for designing experiments to fully understand the study.
DOE is a strategy for planning and analyzing experiments that assists in planning
the experiment in order to collect the required data to support statistical analysis. A
designed experiment states the research question as a hypothesis, which can then be
tested using statistical methods. It identifies the data required to support analysis using
the chosen method before the experimentation begins. This helps in collecting the
required data. The data is analyzed in accordance with the experimental plan
(Montgomery, 2013). This strategy allows the researcher to draw objective and
statistically valid conclusions.
The term DOE encompasses many methodologies for data analysis. The present
15
Factorial design experiments. Factorial design experiments are used to study the
effects of experimental factors on response variables in experiments involving two or
more factors. Factorial design estimates the effect of each factor at several levels. There
are two kinds of effects which can be investigated using this method. One is the main
effect, and the other is the interaction effect. The effect of single factor on a response
variable due to variation in the level of that factor is called a main effect. The effect of
simultaneously changing the levels of two or more factors on a response variable is called
an interaction effect (Montgomery, 2013).
Full factorial designs investigate all possible combinations of factors and levels.
These are the most efficient way to conduct experiments involving multiple factors, and
they are the only method to determine the effects of interactions (Montgomery, 2013).
The researcher will use the full factorial design to analyze various factors in the proposed
study (see also Table 1). One of the main objectives of this study is to determine if one or
more factors affect the response variables. The discussion related to this objective is
described below with basic definitions.
Definitions for important terms are listed below:
• Factors: Independent variables that could affect the response variables. Factors can
be classified in three categories (Montgomery, 2013).
• Design Factors: Factors selected for the experiment.
• Controlled factors: Factors which are held constant. This ensures that observed
effects are due to design factors; i.e., the potential effect of these factors is
16
• Uncontrolled factors: Factors outside of the researcher’s control. Model checking
detects the effects of these variable.
• Levels: Test conditions for each factor chosen by the experimenter for the DOE;
e.g., if ink is a factor, then the ink type tested is level.
• Response Variables: Provide information about the performance of the process
under the study. The motivation for most DOEs is to improve performance.
Design: Test all combinations of factors and levels. A complete set of
combinations is called a replicate. It is desirable to run two or more replicates to
estimate error. Analysis of variance (ANOVA) is used to accept or reject the null
hypothesis (H0). For a factorial design, H0 is the assumption that none of the
factors or interactions has an effect on the response variables.
The design chosen for this research is 2 factor, 3 level and two replicates (32 with
two replicates). The effects model describes the relationship between factors and
effects (Montgomery, 2013),
Yijk = μ + τi + βj + (τβ)ij + εijk for i = 1,2,3
j = 1,2,3
k=1,2
(1)
where μ = overall mean, τi = the effect of ith level of τ on the response variable Y,
βj = the effect of jth level of β on Y, (τβ)ij = effect of the interaction between the ith level
17
Null Hypothesis: In a DOE, the null hypothesis (H0) is the assumption that none
of the factors or interactions has an effect on the response variables.
H0: τi = 0 for i = 1,2,3 and (2)
βj = 0 for j = 1,2,3 and (3)
(τβ)ij = 0 for i = 1,2,3 and for j = 1,2,3. (4)
Ha: at least one main effect or interaction 0.
Mean Squares: A sum of squares (SS) adjusted for the number of degrees of
freedom associated with the variable. Equations for MSτ, MSβ, MSτβ, and MSE are shown
below (Montgomery, 2013):
MSτ = SSτ/(3-1) (5)
MSβ = SSβ/(3-1) (6)
MSτβ = SSτβ/(3-1)*(3-1) (7)
MSE = SSE/3*3*(2-1) (8)
where τ and β represent main effects, τβ represents the interaction effect
and E represents the effect due to error.
The expected values of the mean squares are shown below (Montgomery, 2013),
E(MSA) = E(SSA/(a-1)) = σ2+ (bn∑𝑎𝑖=1𝜏i2)/(a-1); (9)
E(MSB) = E(SSB/(b-1)) = σ2+ (an∑𝑏𝑗=1𝛽j2)/(b-1); (10)
18
= σ2+ (bn∑𝑎𝑖=1𝜏i2)( ∑𝑏𝑗=1𝛽j2 )/(a-1);
E(MSE) =E(SSE/ab(n-1)) = σ2; (12)
where σ2 is the overall variance.
The sum of the squares of k independent normally distributed variables is
chi-square with k degrees of freedom; thus, MSτ, MSβ, MSτβ and MSE are chi-square
variables with 2, 2, 4, and 9 degrees of freedom, respectively.
Expected values of mean squares if null hypothesis is true (Montgomery, 2013):
• If the null hypothesis is true, τ, β, and τβ have no effect on the response.
Therefore, the expected values of the mean squares of τ, β, and τβ are all σ2.
(Note: The terms associated with the real effect of these factors disappear since
the null hypothesis requires that each τi and βj equal 0).
• Since, E(MS τ) = E(MSE) = σ2, E(MSτ)/E(MSE) = 1 and MS τ/MSE can be used as
a statistic for accepting or rejecting the null hypothesis. Since MSτ/MSE is the
ratio of two χ2 distributions, it follows the F distribution with 2 and 9 degrees of
freedom, F(2,9).
• If MSτ/MSE exceeds the critical value of F(2,9) at the researcher’s chosen level of
significance (.95), we reject H0. Similar logic leads to test statistics for β and τβ.
A table summarizing all the equations discussed above, related to the full factorial
19 Table 1
Test Statistics for a Full Factorial 32 Designed Experiment with Two Replicates
Source of Variation
Sum of Squares Degrees of
Freedom
Mean Squares F0
A SSA 2 MSA = SSA/2 F0 = MSA/MSE
B SSB 2 MSB = SSB/2 F0 = MSB/MSE
Interaction SSAB 4 MSAB = SSAB/4 F0 =MSAB/MSE
Error SSE 9 MSE = SSE/9
Total SST 17
Conclusion
A test target was developed in compliance with the standard of ISO 24790:2017.
Line quality of these printed lines was conducted. The design of experiments approach
was carried out to conduct the experiment. This research uses factorial design due to
multiple factors being tested and compared at the same time. In an effort to reduce error
20 Chapter 3
Literature Review
This chapter reviews literature covering four topics which frame the present
research: print quality, inkjet inks, substrates, and inkjet printers.
Print Quality for Inkjet Printing
According to Oxford dictionary of computer science Print Quality can be defined
as:
“The characteristics of printed characters that make them acceptable for an application.
These characteristics include degree of conformity with the intended shapes of the
characters, uniformity of limb width, uniformity of print density, contrast with the paper,
amount of smudging, accuracy of location of the characters compared with their intended
positions on the paper, and amount of extraneous ink. The basic print quality requirement
is that all characters must be legible out of context. In the most demanding application,
the printed page must have all characters accurately and completely printed with uniform
density and high contrast, and no visible flaws” (Butterfield, & Ngondi, 2016, p. 428).
Two methods are used to assess print quality: objective measurement and
subjective print preference. Print quality metrics are objective measures of physical print
characteristics while print preference is an overall measure of how customers like a given
print. Print quality metrics are well-defined procedures for quantitatively measuring
21
measurement to evaluate print quality, as these metrics are reproducible and can be
expressed quantitatively. Objective measurements of print quality are key to setting
development goals and maintaining consistent manufacturing processes for inkjet media
(Dalal et al, 1998).
Print quality is a general measure of success for color printing systems and is an
important customer requirement along with other requirements like cost, productivity,
connectivity and reliability (Dalal et al, 1998). Print quality is one of the customer’s top
considerations while deciding to choose print providers (Engeldrum, 2004). In digital
printing, print quality is a critical decision factor for applications from business
communication to digital photography (Tse, 2007). Matching customer needs is the final
goal of any print quality evaluation.
Print quality analysis is one of the primary tools for evaluating print quality and
unambiguously communicating the results within an organization and between
organizations in the digital print industry. In marketing, print quality can be used in
competitive benchmarking and product positioning. In R&D, print quality is used to
make repeatable quantitative measurements for analyzing results and provides
information for product and process development. In production, print quality analysis
ensures efficient measurement and eliminates the manual errors due to operator
22 Line Quality
The objective of the present research is to study the effects of substrate
characteristics and ink properties on print quality. Previous researchers have used line
quality to investigate similar questions. Line quality is a high-level print quality
descriptor which describes the overall quality of lines in printed output (Dalal et al.,
1998). Line quality attributes include line location, line width, edge sharpness, and edge
raggedness (Briggs et al., 1999). Briggs et al. (1999) reviewed the line quality attributes,
definitions, and measurement methods that were expected to become part of the ISO
Standard ISO 13660. ISO 13660 has been superseded by ISO 24790. Line quality
attributes in ISO 24790 include blurriness, raggedness, and line width (ISO, 2017).
These attributes have been used by previous researchers to investigate the effects
of substrate and ink on print quality. For example, Song et al. (2013) compared line
quality of piezoelectric inkjet to electrophotographic laser technology and concluded that
blurriness and raggedness were affected by the substrate and ink. In another study, line
width, edge blurriness, and edge raggedness were measured to analyze the effects of
substrate properties on line quality (Park et al., 2006). In this study, polyester fabric was
used as the substrate. Since fabric was used as a substrate, the authors took into
consideration fabric properties such as fabric structure, finishing, and ink properties. It
was found that substrate, substrate coating, and ink can affect print quality (Park et al.,
2006).
Additionally, in a study conducted by Mhetre, Carr, & Radhakrishnaiah (2010),
23
quality. The study found that the uneven texture of textile surfaces caused printed line
width to exceed the input value, and that raggedness was a major factor to be examined
when conducting print quality research. These researchers used a Dimatix inkjet printer
to print the samples because it provides the option to control variables such as voltage,
frequency, waveform editor, and temperature.
Based on the literature just reviewed, line quality is an important metric for
investigating the effects of substrates and ink on print quality. Since this matches the
focus of the present research, line quality will be used as the response variable for
answering the research question.
Inkjet Inks
Inkjet inks are the inks which are compatible with inkjet technologies. Inkjet inks
are broadly classified based on the ink vehicle contained in them or the type of curing
method applied to the specific ink (Magdassi, 2010). Inks can be classified based on the
types of solvents and colorants they contain. Inks could be water-based, solvent-based,
UV-curable, pigment ink, and dye inks Some of the physical attributes related to various
kinds of inks is mentioned below.
Water-based inkjet ink uses water as its primary solvent. The rate at which the
drops are jetted out of each nozzle is 10,000 to 30,000 drops per second. The diameter of
the jetting nozzle can be anywhere between 10μm to 50μm. Generally, the ink viscosity
of water-based inkjet inks is around 1-5 centipoise. The ink surface tension should be
24
system. For example, if ink viscosity is too great, then nozzle firing frequency must be
reduced in order to accommodate a decrease in chamber refill rate (Magdassi, 2010).
The colorants used in drop on demand (DOD) solvent-based inks are typically
dispersed pigments. These inks also contain a solvent, binder and additives. Solvent is the
largest component of these inks. Binders are required to provide adhesion, increase
resistance to physical abuse, and add chemical resistance to the print. Additives are
components added in small amounts, based on the intended usage of the ink (Kipphan,
2001; Magdassi, 2010).
There are certain requirements that an ink must satisfy to jet through the microjet
nozzles of inkjet printers. These factors are:
1. The ink must be stable in the print head.
2. The viscosity and surface tension must be controlled to jet the ink through a
nozzle which has a typical diameter of 10–30 microns.
3. The particle size of the ink components, particularly pigments, should be
small.
4. The ink should adhere to the substrate after jetting.
5. The ink should dry quickly.
25
Properties. Physical properties of ink affect ink behavior. Viscosity, surface
tension, and fluid density are ink properties that significantly impact the behavior of an
ink in an inkjet printer (Magdassi, 2010).
• Viscosity is a measure of a liquid’s resistance flow. A thick liquid that does
not flow easily has high viscosity; a thin liquid that readily flows has low
viscosity. The viscosity of ink strongly affects how it behaves in the printer
and how it is ultimately transferred to the substrate (Kipphan, 2001).
• Surface tension is the elastic tendency of a fluid surface which causes it to
assume a shape that minimizes surface area relative to fluid volume (Kipphan,
2001).
• The density of a fluid is defined as the mass of a standard fluid volume
(Kipphan, 2001).
In addition to the aforementioned physical characteristics of inks, the size of
colorant and additive particles influence the behavior of specialty inks (Magdassi &
Kamyshny, 2017). In one study, pigment-based ink was used to study the influence of
textile surface structure on print quality. The authors studied the various aspects of print
quality, including line quality, drop spreading, and the influence of yarns on the drop
spread (Mhetre, Carr, & Radhakrishnaiah, 2010). Theyinvestigated the influence of
droplet formation characteristics (e.g. viscosity, surface tension, etc.) on textile substrates
with a specialty water and pigment-based ink.
In another study, the size of colorant particles in inkjet ink and their effect on
26
size of the colorant was varied in formulated inks that were subsequently printed on two
substrates having different textures. The image quality attributes analyzed were optical
density, color gamut, and gloss. It was found that these image quality metrics were not
affected by different particle sizes (Bugner & Bermel, 1997).
In a study conducted by Kiatkamjornwong, Putthimai, and Noguchi (2005), the
researchers compared the print quality of inkjet printing to screen printing on cotton. The
rheological properties of both the inks were modified to meet jetting requirements. Color
gamut and tone reproduction were analyzed using a spectrophotometer. A four-color print
process was used for the study. It was observed that inkjet inks have to be overprinted
three times in order to meet the ink density of screen prints (Kiatkamjornwong,
Putthimai, & Noguchi, 2005). The researchers stored the ink for two months and found
that there were no signs of agglomeration nor was there an increase in the particle size.
Inkjet inks can be used as alternative to screen printing inks if the ink formulation is able
to give the required printed ink density in a single pass (Kiatkamjornwong, Putthimai, &
Noguchi, 2005).
Ink-media interactions are the most significant determining print quality
(Auslander et al., 1999). Line quality attributes were used by Auslander et al. (1999) to
study printing inks of various physical properties on four different envelopes. The study
showed that substrate selection affects print quality. The dynamics of a droplet hitting a
substrate and spreading on the substrate can be described as three different steps: initial
spreading, absorption, and evaporation of liquid (Desie et al., 2004). In order to develop
27
mechanisms between pigment inks and microporous receivers (Desie et al., 2004). A
study was conducted to compare the performance of dye-based and pigment-based inks
when printed on a microporous substrate and found that chide of pigments influences rub
resistance of the print and reduced the absorption time (Desie et al., 2004).
In summary, the literature provides examples of ink properties (e.g. viscosity,
particle size, etc.) that affect print quality. Based on this observation, inks with a wide
range of viscosities were chosen for this research.
Substrate
Any surface or material which receives print can be termed a substrate (Kipphan,
2001). The substrate plays an important role in non-impact printing (NIP) processes such
as inkjet. The nature of printability is influenced by the porosity and surface condition of
the substrate. Porosity determines the capacity of substrate to absorb ink (Kipphan,
2001). Porosity allows the surface finish of a substrates to be classified as glossy,
non-glossy, matte, or luster. The surface of a substrate is also characterized by parameters
such as smoothness, roughness, and surface energy (Kipphan, 2001).
Most inkjet inks have low viscosity and low surface tension, so the print quality is
highly dependent on paper surface properties( Jurič, Karlović, & Tomić,
2013).Bandyopadhyay (2001) also concluded that print quality is highly dependent on
paper properties such as smoothness and absorption characteristics. Other paper
properties such as roughness, gloss, surface wettability, and whiteness influence dot
28
examine the effect of paper composition on inkjet print quality. In this study, nine pilot
papers were created and compared to eight commercially available papers (Lundberg et
al., 2009). Wu, Pekarovicova, and Fleming (2007) conducted a digital proofing
colorimetric study. They studied six substrates having a variety of textures and analyzed
the output from two digital printers with respect to color properties of inks printed on
these substrates. It was found that paper properties such as roughness, porosity, pore size,
formation, brightness, whiteness, opacity, and gloss influence color reproduction for
publication papers (Wu, Pekarovicova, & Fleming, 2007).
Among the factors that influence substrate choice are sheet thickness, basis
weight (also called grammage), roughness, and texture of the substrate. A study of
roughness for commercially available inkjet paper was conducted in order to evaluate the
influence of paper roughness on a print gloss ( Xu, Fleming, Pekarovicova, & Bliznyuk,
2005). A study conducted by Xu et al., studied the correlation of paper roughness, paper
gloss, and print gloss. In this study, the researchers used three Epson printers and five
substrates of differing textures. Of the five substrates, two had glossy textures, one had
satin, one had luster, and the other had a matte finish. It was found that print gloss is
affected by the substrate being used. The surface of Epson glossy paper was smoothest
while Epson matte had the roughest surface. Pigment ink films had rougher surfaces than
dye based ink films (Xu et al., 2005).
The interaction between inks and print surfaces affects print quality in inkjet
printing (Örtegren, Alfthan, & Hägglund, 2012). The researchers created nine pilot