Crystal and Solution Structures of the Helicase-binding Domain of
Escherichia coli
Primase*
□
SReceived for publication, November 8, 2004, and in revised form, December 22, 2004 Published, JBC Papers in Press, January 12, 2005, DOI 10.1074/jbc.M412645200
Aaron J. Oakley‡§¶, Karin V. Loscha‡¶储, Patrick M. Schaeffer‡¶, Edvards Liepinsh¶**, Guido Pintacuda‡**, Matthew C. J. Wilce§, Gottfried Otting‡, and Nicholas E. Dixon‡ ‡‡
From the‡Research School of Chemistry, Australian National University, Canberra, Australian Capital Territory 0200, Australia, the§School of Medicine and Pharmacology and School of Biomedical and Chemical Sciences,
University of Western Australia, Nedlands, Western Australia 6907, Australia, and the**Department of Medical Biochemistry and Biophysics, Karolinska Institutet, S-171 77 Stockholm, Sweden
During bacterial DNA replication, the DnaG primase interacts with the hexameric DnaB helicase to synthe-size RNA primers for extension by DNA polymerase. In Escherichia coli, this occurs by transient interaction of primase with the helicase. Here we demonstrate directly by surface plasmon resonance that the C-terminal do-main of primase is responsible for interaction with
DnaB6. Determination of the 2.8-Å crystal structure of
the C-terminal domain of primase revealed an asymmet-ric dimer. The monomers have an N-terminal helix bun-dle similar to the N-terminal domain of DnaB, followed by a long helix that connects to a C-terminal helix hair-pin. The connecting helix is interrupted differently in the two monomers. Solution studies using NMR showed that an equilibrium exists between a monomeric species with an intact, extended but naked, connecting helix and a dimer in which this helix is interrupted in the same way as in one of the crystal conformers. The other conformer is not significantly populated in solution, and its presence in the crystal is due largely to crystal pack-ing forces. It is proposed that the connectpack-ing helix con-tributes necessary structural flexibility in the primase-helicase complex at replication forks.
All organisms replicate DNA in a semidiscontinuous fashion (1). At each replication fork, one of the parental strands is the template for synthesis of an uninterrupted leading strand. The
other strand is replicated as short Okazaki fragments that are later joined to generate a contiguous lagging strand (2). In prokaryotes, synthesis of both the Okazaki fragments and the nascent leading strand are initiated from primers generated by a specialist single-stranded DNA (ssDNA)1-dependent RNA
polymerase called primase. The Escherichia coli primase is encoded by thednaGgene (3), and its RNA polymerase domain is highly conserved in prokaryotic genomes (4).
In bacteria, strand separation at replication forks is carried out by the hexameric DnaB helicase (DnaB6), which uses the energy of ATP hydrolysis to translocate along the lagging strand in the 5⬘–3⬘direction (5). Electron microscopy revealed that DnaB6 is a ring-shaped molecule (6) that can exist in
different quaternary states with eitherC3(trimer of dimers) or
C6symmetry, depending on conditions (7, 8). The DNA strand
on which it translocates passes through its central channel, whereas the other is excluded (9, 10). It is generally thought that each subunit of DnaB is composed of two domains con-nected by a hinge region (11). Although there is no high reso-lution structure reported for the intact hexameric DnaB, the structure of its smaller N-terminal domain has been deter-mined both by NMR spectroscopy (12) and x-ray crystallogra-phy (13). These structures were recently used in conjunction with the known crystal structure of the helicase domain of the related hexameric bacteriophage T7 gp4 helicase-primase (14) to model structures into electron density maps of DnaB6 pro-duced by image reconstruction from negative stain electron microscopy data (15). It is generally accepted that the C-termi-nal face of DnaB6 is directed into the replication fork and
contains the site of strand separation, whereas the N-terminal face points away from the fork where it would be appropriately placed to interact with the DnaG primase (16, 17).
Priming of Okazaki fragment synthesis on the lagging strand requires helicase-primase interaction. AlthoughE. coli
primase appears to be repeatedly recruited to the lagging strand by transient interaction with the helicase (18), the in-teraction between theBacillus stearothermophilushomologs is sufficiently stable that a complex of the helicase with two or three molecules of primase can be isolated (19, 20).
Primase is composed of an N-terminal zinc-binding domain that mediates interaction with the ssDNA template (21, 22), a larger central domain responsible for primer synthesis (4), and * This work was supported by research grants from the Australian
Research Council, an Australian Postoctoral Fellowship (to A. J. O.) and a Federation Fellowship (to G. O.). Data collection at the Advanced Photon Source, Chicago, was supported by the United States Depart-ment of Energy, Basic Energy Sciences, Office of Science, under con-tract W-31-109-Eng-38. Use of the BioCARS Sector 14 was supported by the National Institutes of Health, National Center for Research Re-sources, under Grant RR07707. The costs of publication of this article were defrayed in part by the payment of page charges. This article must therefore be hereby marked “advertisement” in accordance with 18 U.S.C. Section 1734 solely to indicate this fact.
The atomic coordinates and structure factors (code 1T3W) have been deposited in the Protein Data Bank, Research Collaboratory for Struc-tural Bioinformatics, Rutgers University, New Brunswick, NJ (http://www.rcsb.org/).
The NMR chemical shifts of amide protons (code 6284) have been deposited in the BioMagResBank, University of Wisconsin, Madison WI (http://www.bmrb.wisc.edu).
□S The on-line version of this article (available at http://www.jbc.org) contains Supplemental Data, including an additional figure.
¶These authors contributed equally to this work.
储Supported by a scholarship from the Deutscher Akademischer Austauschdienst.
‡‡ To whom correspondence should be addressed. Tel.: 61-2-61254391; Fax: 61-2-61250750; E-mail: [email protected].
1The abbreviations used are: ssDNA, single-stranded DNA; AMP-PNP, adenosine-5⬘-(,␥-imido)triphosphate; DnaG-C, the C-terminal domain (residues 434 –581) ofE. coliDnaG primase; HSQC, hetero-nuclear single quantum coherence; NOE, hetero-nuclear Overhauser effect; NOESY, two-dimensional NOE spectroscopy; SPR, surface plasmon resonance (BIAcore); TOCSY, total correlation spectroscopy; RU, re-sponse unit(s); MES, 2-morpholinoethanesulfonic acid.
© 2005 by The American Society for Biochemistry and Molecular Biology, Inc. Printed in U.S.A.
This paper is available on line at http://www.jbc.org
11495
at JAMES COOK UNIVERSITY, on September 29, 2009
www.jbc.org
a C-terminal domain (residues 434 –581) that interacts with DnaB6 (23, 24). Although high resolution structures of the zinc-binding domain ofB. stearothermophilusprimase (25) and the central catalytic core domain of theE. colienzyme (16, 26) have been published, the structure of the C-terminal domain (also termed p16, and here designated DnaG-C) has not previ-ously been reported.
Studies of the structure and function of the DnaG-C domain have been restricted due to difficulty in expressing it inE. coli, presumably because it binds (and thus inactivates) DnaB in competition with the full-length primase (18, 23). Mutations in the extreme C-terminal 16 residues of primase led to defects in its function in DnaB-dependentin vitroreplication reactions, suggesting that this region, at least, makes contacts with the helicase (23, 27). Whereas previous studies showed that a glu-tathioneS-transferase-DnaG-C fusion protein is capable alone of interacting with DnaB6 (24), there has been no physical
demonstration that this interaction is mediated solely by the C-terminal domain of primase.
Here we report thermodynamic parameters and stoichiome-try, determined by surface plasmon resonance (SPR) measure-ments, for the association of DnaG-C with DnaB6. The data
demonstrate that the C-terminal domain is largely, if not com-pletely, responsible for primase-helicase interactions and that up to three DnaG-C molecules are able to bind noncoopera-tively to the helicase hexamer. The crystal structure of DnaG-C, determined at 2.8-Å resolution, shows that the pro-tein is an elongated molecule composed of two globular subdo-mains connected by a long helix. It exists in the crystalline state as an asymmetric dimer of subunits with two different conformations resulting from bending of the connecting helix at different positions, indicating that this helix is rather flexible. NMR spectroscopy was used to demonstrate in solution that a monomer-dimer equilibrium exists at high concentrations, that the connecting helix persists and appears to be straight in the monomer, and that one of the crystal conformers is most highly populated in the dimer. Thus, the other crystal conformer ap-pears to be trapped in the solid state by crystal packing forces.
EXPERIMENTAL PROCEDURES
Protein Purification—Overproduction of DnaG, DnaG-(1– 433), and DnaG-C was achieved inE. colistrains containing plasmid derivatives of vector pCE30, pMA200U (28), or pND706 (29), respectively, with appropriately constructed genes under control of thermoinducible tan-dem bacteriophage pR andpLpromoters. Construction of pPL195 (dnaG⫹) (21) and pKL1176 (dnaG-C⫹) (30) have been described. To prepare plasmid pCP806 (dnaG-(1– 433)⫹), thednaGgene from pPL195
was transferred to the phagemid vector pMA200U, and the single-stranded form was used as template for oligonucleotide-directed mu-tagenesis (31) to replace codon 434 ofdnaGwith a TAA stop codon followed by an EcoRI site. Deletion of an EcoRI fragment downstream of the coding region in pCP806 yielded pCP807, which was used for overproduction of DnaG-(1– 433) (see Supplemental Data for details).
Unlabeled, uniformly13C,15N-labeled, and selenomethionine-substi-tuted DnaG-C were purified as described (30). To avoid the possibility of heterogeneity at the C terminus of the protein, DnaG primase was expressed in a suppressor-free host strain (cf.Ref. 30). Details of pro-cedures for purification of primase and DnaG-(1– 433), along with ver-ification of their purity by SDS-PAGE, are given in detail in the Sup-plemental Data. Concentrations of primase, DnaG-(1– 433), and DnaG-C were determined spectrophotometrically at 280 nm, using cal-culated values of⑀280of 43,240, 30,580, and 12,660M⫺
1 cm⫺1
, respec-tively (32).
DnaB6 was purified using strain AN1459/pPS562 (6). Plasmid pPS562 contains a syntheticdnaCBoperon under transcriptional con-trol of the tandempRandpLpromoters and directs high level over-production of equimolar amounts of DnaB and DnaC proteins. Concen-trations of DnaB6were determined by the method of Bradford (33), using bovine serum albumin as standard.
SPR Measurements—A BIAcore 2000 instrument (Biacore AB, Upp-sala, Sweden) was used to study the interactions of DnaB with DnaG as
well as its N- and C-terminal domains. All studies were carried out at 20 °C at a flow rate of 5l/min. For immobilization onto a CM5 sensor chip (Biacore), proteins were diluted into 10 mMMES (pH 6.0) (for wild-type DnaG) or a mixture of 2 volumes of 10 mMMES (pH 6.0) with 3 volumes of 10 mMHEPES (pH 7.4) (for DnaG-(1– 433)). All flow cells were activated with a 7-min injection of a freshly prepared aqueous solution of 50 mMN-hydroxysuccinimide and 200 mM 1-ethyl-3-(3-dim-ethylaminopropyl) carbodiimide. DnaG was immobilized onto two flow cells to yield increases in response units (RU) of 742 and 1472. DnaG-(1– 433) (1220 RU) was immobilized on a third flow cell, and one flow cell served as a control surface (CM5 chip I). All flow cells were then deactivated with 1Methanolamine (pH 8.5). The surface of a second CM5 sensor chip (CM5 chip II) was treated similarly to immobilize wild-type DnaG at a low level (380 RU). Wild-type DnaB6in 10 mM HEPES (pH 7.4), 10 mMMgCl2, 150 mMNaCl, 1 mMdithiothreitol, and 0.005% surfactant P20 (BIAcore buffer) at concentrations between 0.21 and 2.11M(as subunits) was made to flow during 2 min over the immobilized DnaG on CM5 chip II. Elution was allowed to proceed in the same buffer for 10 min. The flow cells were regenerated by injec-tions (2 min) of 10 mMHEPES (pH 7.4).
The streptavidin-coated sensor chip (SA chip; Biacore) was activated with three sequential injections of 1MNaCl, 50 mMNaOH (1 min each). A solution (2 nM) of a 3⬘-biotinylated oligonucleotide comprising 35 thymidine residues (3⬘Bio-(dT)35) in BIAcore buffer was used to yield an increase of 61 RU (6 min) on one flow cell. Another flow cell was unmodified and served as a control. DnaB6was diluted in BIAcore buffer containing 0.1 mMAMP-PNP to 2.11M, and 1000 RU were immobilized (10 min) onto 3⬘Bio-(dT)35. After allowing DnaB to stabilize on 3⬘Bio-(dT)35for a further 9.5 min, DnaG was injected over the flow cells during 1 min. After 5 min of dissociation, the flow cells were regenerated by injection of 1 M NaCl, 50 mMNaOH (1 min). This removed DnaB6, which was then reloaded onto the chip for a new cycle. Solutions of increasing concentrations of DnaG primase were tested in this way.
The same flow cell was used to investigate the interaction of DnaG-C with ssDNA-bound DnaB6. The binding signal was increased by raising the level of immobilized 3⬘Bio-(dT)35to 133 RU. The interaction was monitored as described above, except that 1900 RU of DnaB6(8.4 min) were immobilized onto the chip, and DnaG-C was injected at various concentrations.
The equilibrium dissociation constants (KD) of all complexes were
derived from raw data by use of the BIAevaluation software (version 3.2; Biacore). Steady-state data were used to calculate the KD of a
complex. Before fitting, binding data were corrected by subtraction of the control response due to simple refractive index change. The RU values of DnaB6bound onto the 3⬘Bio-(dT)35 derivatized SA surface were normalized to 1000 RU for DnaG binding or 1900 RU for DnaG-C. The curve of equilibrium responseversus[analyte] was fitted to a 1:1 Langmuir binding model. The experimental errors in determined pa-rameters are S.E. values calculated by BIAevaluation.
Crystal Structure Determination—Crystals of selenomethionine-sub-stituted DnaG-C were grown by vapor diffusion in hanging drops (2l) as described (30). Protein solutions (⬃4 mg/ml), initially in 0.05 M
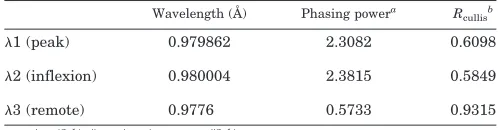
sodium acetate buffer (pH 4.6) with 2.5% polyethylene glycol 4000 and 0.1 Mammonium sulfate, were equilibrated at 4 °C over reservoirs containing the same components at twice these concentrations. X-ray data sets were collected at three wavelengths suitable for phasing based on selenium anomalous dispersion as described previously (30). Statis-tics for anomalous scattering in these data are given in Table I. Since the native protein crystals did not yield useful diffraction, one of the MAD data sets (1, 2.8-Å resolution) was used as the reference data set for structure refinement. Initial phase and solvent flattening calcula-tions were conducted in CNS (34). Arp/wARP (35) was used for further phase improvement. All model building was performed manually in O (36), with model refinement performed by REFMAC (37). Maximum
TABLE I
MAD phasing statistics (resolution range 50 to 2.8 Å)
Wavelength (Å) Phasing powera R
cullis
b
1 (peak) 0.979862 2.3082 0.6098
2 (inflexion) 0.980004 2.3815 0.5849
3 (remote) 0.9776 0.5733 0.9315
a具兩F H兩
2典1⁄2/具储F
PH兩⫺兩FP⫹FH储
2典1⁄2.
b具储
FPH兩⫺兩FP⫹FH储
2典1⁄2/具储F
PH兩⫺兩FP储
2典1⁄2.
at JAMES COOK UNIVERSITY, on September 29, 2009
www.jbc.org
[image:2.603.306.555.72.137.2]likelihood-weighted phases from REFMAC were used for 2mFo⫺dFc
and mFo⫺dFcelectron density map calculations. Structure similarity
searches were performed using the SSM server (38).
NMR Measurements—A 0.60 mMsolution of uniformly15N/13 C-la-beled DnaG-C in 10 mMsodium phosphate (pH 6.07), 0.1MNaCl, 1 mM
dithiothreitol, 0.1% (w/v) NaN3in 90% H2O, 10% D2O (30) was used for NMR experiments. Spectra were recorded at 25 °C using a Bruker DMX-600 NMR spectrometer equipped with a triple resonance cryo-probe operating at a1H NMR frequency of 600 MHz. The backbone resonance assignments were obtained from three-dimensional HNCA, HNCO, (HCA)CONH, CBCA(CO)NH, HNCACB, HN(CA)HA, TOCSY-15N-HSQC, and NOESY-15N-HSQC spectra. {1H}15N-NOE data were recorded on a Varian Inova 600 NMR spectrometer.
RESULTS
SPR Analysis of DnaB6Binding to Immobilized DnaG and
DnaG-(1– 433)—The interactions of DnaB6 with immobilized full-length DnaG (65,572 Da) and a truncated form lacking the C-terminal domain (DnaG-(1– 433), 48889 Da; also termed p49) were first analyzed by SPR (BIAcore). DnaB6was observed to
bind only to surfaces with immobilized DnaG; no response was observed with DnaG-(1– 433) even at the highest concentration (2.11M, as monomer) of DnaB (Fig. 1A). An equilibrium
bind-ing isotherm for the interaction of DnaB6 with immobilized
DnaG was obtained using a second sensor chip with a lesser loading of DnaG (Fig. 1B). It gave a good fit to a Langmuir binding model for a 1:1 interaction, with a dissociation constant
KDof the DnaB6-DnaG complex of 1.4⫾0.1M(with [DnaB]
expressed as concentration of subunits, assuming there are six potential binding sites in the hexamer). The maximum re-sponse (Rmax) for DnaB6binding to this surface indicated that only about 3% of the immobilized DnaG molecules were capable of binding DnaB hexamers. Similarly inefficient and weak binding has been reported previously in a similar experiment (39). The association and dissociation phases were fast, and a large mass transport effect due to the large size of DnaB6(314 kDa) was expected. Because most of the immobilized primase was inactive, presumably because the DnaB6-binding site was
occluded during covalent immobilization, it was not possible to determine the stoichiometry of the complex with this surface. Nevertheless, the interaction appeared to be a specific one, since the addition of 3Mprimase as competitor with 0.21M
DnaB6as analyte reduced the SPR response by⬃50%.
More-over, the interaction was observed to be absolutely dependent on the presence of Mg2⫹. Since hexamerization of DnaB at the concentrations used here is dependent on Mg2⫹(40), this also suggests that only the hexamer is capable of binding primase.
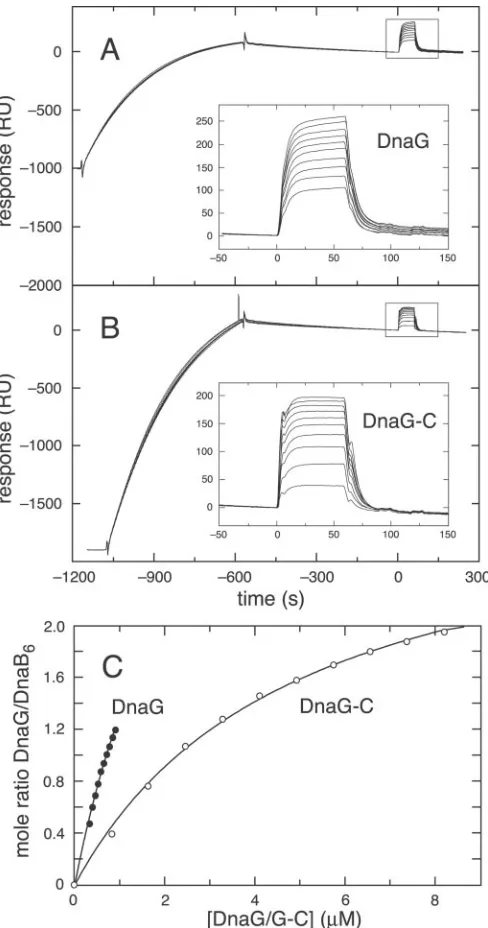
Binding of DnaG and DnaG-C to 3⬘Bio-(dT)35-immobilized
DnaB6—The influence of interaction of DnaB6with ssDNA on
its association with primase has not previously been examined directly. For this purpose, we used a 3⬘-biotinylated oligonu-cleotide (3⬘Bio-(dT)35) long enough that it should bind well
within the central channel of the helicase but not projecting so far that it could simultaneously interact with DnaB6-bound
primase. The helicase was thus immobilized via its interaction with 3⬘Bio-(dT)35 that had previously been bound to the
streptavidin-coated surface of a Biacore SA chip. DnaB6uses
the energy of ATP hydrolysis to move in the 5⬘–3⬘direction on ssDNA. It was found to bind quite stably onto immobilized 3⬘Bio-(dT)35in the presence of Mg2⫹and the nonhydrolyzable
ATP analog, AMP-PNP (Fig. 2, A and B). After the DnaB surfaces had been prepared, analyte solutions containing a range of concentrations of DnaG, DnaG-C, or DnaG-(1– 433) were made to flow over them until equilibrium had been reached.
Although no binding of DnaG-(1– 433) was observed even at a concentration as high as 3.7M, both DnaG and DnaG-C were
found to interact with ssDNA-bound DnaB6in a concentration-dependent manner (Fig. 2). No major artifacts like mass trans-fer limitations were noted, probably because the sizes of the analytes were relatively small. Although some surface degra-dation occurred due to slow release of DnaB6, it was negligible in the time frame of the experiments. The binding and disso-ciation phases for both proteins were complete in⬍10 s (Fig. 2,
AandB), confirming the transience of the DnaB6-DnaG
inter-action (18) but rendering it impossible to determine accurate kinetic parameters.
The equilibrium binding isotherm for binding of DnaG-C (Fig. 2C) fit well to a 1:1 binding model, withKD⫽4.9⫾0.3M
andRmaxthat corresponded to binding of 3.14⫾0.08 molecules
of DnaG-C per hexamer of DnaB at saturation. There was no evidence of cooperativity among the three sites. The data for DnaG were limited by the accessible range of concentrations, and there was evidence of some nonspecific interaction of pri-mase with the chip surface (Fig. 2A). Nevertheless, the binding isotherm still fit reasonably to a 1:1 Langmuir model withKD⫽
2.8⫾0.4M(Fig. 2C).
Crystal Structure of DnaG-C—Previously, we reported crys-tallization of selenomethionine-substituted DnaG-C and data collection at a synchrotron source (30). The structure was
FIG. 1. Comparison of BIAcore data for the interaction of
DnaB6helicase with immobilized DnaG and DnaG-(1– 433).A,
DnaB6(2.11M, as subunits) was injected over CM5 chip I (see “Ex-perimental Procedures”). The flow cells were derivatized with 1472 and 742 RU of DnaG and 1220 RU of DnaG-(1– 433). DnaG-(1– 433) does not interact with DnaB.B, steady-state data for the interaction of DnaB6 with immobilized DnaG (380 RU) on CM5 chip II. Equilibrium RUeq values are plotted versus[DnaB monomer]. The fit for a 1:1 binding model is shown as asolid line, calculated usingKD⫽1.4M,Rmax⫽ 60 RU.
at JAMES COOK UNIVERSITY, on September 29, 2009
www.jbc.org
solved at 2.8-Å resolution using phases derived from MAD data sets. Four selenium sites in the asymmetric unit were identi-fied by Patterson search methods, using CNS (34). After refine-ment of their initial positions, the overall figure of merit was 0.57. This was improved to 0.75 by solvent flattening density modification. The map resulting from these phase data re-vealed electron density of a mainly helical protein. Interpreta-tion of the electron density maps indicated that the four sele-nium sites corresponded to two buried selenomethionine residues in each of two DnaG-C monomers. A model consisting of 207 residues was built into these maps. TheRcryst(Rfree) of
this model reduced from 49.9 (48.7%) to 38.3 (42.7%) after 10 cycles of refinement. This reduced to 27.5 (33.0%) after another cycle of manual model building and refinement. After three more cycles of model building and refinement, the final model hadRcryst⫽26.8%,Rfree⫽30.8%. Statistics for this model are
given in Table II.
Despite the limited resolution of the x-ray data, the electron density maps were readily interpretable (Fig. 3). The final model contains two DnaG-C monomers (I and II) in close in-teraction with each other, forming an asymmetric dimer (Fig. 4B). The N-terminal 14 residues were not visible in electron density for either monomer and were not included in the model; this is consistent with the flexibility of these residues demon-strated previously by NMR (30). The C-terminal lysine residue in monomer II was also invisible. The solvent content of the crystals was 82%, corresponding to a Matthews’ coefficient of 7.22 Å3/Da.
Each monomer consists of an N-terminal bundle of␣- and 310-helices (␣1, 3102, ␣3, and ␣4; Fig. 4), followed by long central (␣5) and C-terminal helices (␣6) that together form a helical hairpin. Although the helical bundle is similar in both monomers, the long helix␣5 is kinked in a different place in each of them (Fig. 4, A and C). This could be explained by relative flexibility of helix␣5 and its consequent susceptibility to perturbation by the local crystal-packing environment.
Remarkably, the helical bundle is structurally similar to the N-terminal domain of the DnaB helicase (13), despite the se-quence identity being only 16% (Fig. 5). These structurally conserved domains could therefore have descended from a com-mon ancestor of mixed function. Although each DnaG-C com- mon-omer is missing the C-terminal helix (␣7) of DnaB-N, it is replaced by helix ␣5 of the other monomer in the DnaG-C dimer. Both DnaB-N and DnaG-C exist as dimers in the crys-talline state, and NMR studies (see below and Ref. 12) show that they both form (symmetric) dimers in solution at high concentrations. Nevertheless, the dimerization interfaces in-volve different regions of the molecular surfaces. For DnaG-C, the extended helix␣5 of one monomer interacts with helices␣1 and 3102 and the loop following 3102 in the other. In DnaB-N, dimerization occurs via an interface involving residues from helices␣4 and␣6 (12, 13). Although the dimerization interface of DnaG-C is extensive, it may have no biological significance. Earlier studies showed that both DnaG (21) and DnaG-C (30) are monomers in solution at low concentrations as would occur intracellularly, and the 3:6 stoichiometry of the DnaG-DnaB interaction makes it difficult to conceive a biochemical role for dimerization of full-length DnaG during its interaction with DnaB6or during primer synthesis.
Solution Conformation of the DnaG-C Monomer—The obser-vation of two different conformations of DnaG-C in the crystal
FIG. 2.BIAcore data for the interaction of DnaG and DnaG-C
with DnaB6immobilized via 3ⴕBio-(dT)35on a Biacore SA chip.
DnaB was immobilized onto a 3⬘Bio-(dT)35derivatized SA chip surface, and DnaG (A) or DnaG-C (B) was injected 9.5 min later (see “Experi-mental Procedures”). Thecurvesshown ininset Aare at [DnaG] from 0.32 to 0.90M, andcurvesinBare with [DnaG-C] from 0.82 to 8.20M.
C, binding isotherms for the interaction of DnaG and DnaG-C with immobilized DnaB6. Mole ratios of bound DnaG or DnaG-C to immobi-lized DnaB6,n⫽((RUeqof DnaG/G-C) * (Mrof DnaB6))/((Mrof DnaG) * (RU of DnaB6)). Thesolid curves were calculated for a 1:1 binding model, with values ofKD⫽2.8M,nmax⫽4.97 (for DnaG),KD⫽4.9M, nmax⫽3.14 (for DnaG-C).
TABLE II
Statistics of the final X-ray structure of DnaG-C
Parameters Values
Rcryst(%)
a 28.0 (32.6)b
Rfree(%)
a
31.6 (38.7)b
Root mean square deviations from ideal geometry
Bond lengths (Å) 0.012
Bond angles (degrees) 1.498 Torsion angles (degrees) 5.374 Chiral volumes (Å3) 0.109
Planar groups (Å) 0.004
Ramachandran plot statistics
Residues in favorable regions (%) 88.0 Residues in allowed regions (%) 98.4
ar⫽ 兺
hkl兩Fo(hkl)⫺Fc(hkl)兩/兺hkl兩Fo(hkl)兩.
bFigures in parentheses correspond to the highest resolution bin
(2.87 to 2.80 Å).
at JAMES COOK UNIVERSITY, on September 29, 2009
www.jbc.org
[image:4.603.52.296.52.516.2]at pH 4.6 (Fig. 4C) raised questions about its structure in solution at higher pH and, in particular, about the existence in the monomeric state of the long naked helix (␣5) between the N-terminal globular subdomain and the C-terminal helix hair-pin. This helix is reminiscent of that connecting the two glob-ular domains of ribosomal protein L9 (41) and of calmodulin;
the latter shows a variety of conformations in the crystalline state and in solution (summarized in Ref. 42). Consequently, structural studies of DnaG-C were carried out in aqueous so-lution (at pH 6.1) by NMR spectroscopy, which also allowed assessment by solution data of the minor structural variability observed for the globular subdomain and the helical hairpin.
FIG. 3.Stereodiagram of a 2mFoⴚ
dFcelectron density map of DnaG-C.
Phases were calculated from the final model, shown instick form. The map is contoured at 1.
FIG. 4.Crystal structure of the DnaG-C dimer.A, helical regions in the two monomers I and II;␣- and 310-helices are identified byredand
cyan bars, respectively, and every 10th residue is marked by anasterisk. Thesolid boxes underthe sequence represent residues conserved among primases from 12 bacterial species, andopen boxesdenote conservation of residue type (30).B, stereo view of a schematic representation of the dimer, displaying the conformers I and II inredandblue, respectively. Their N and C termini are identified.C, stereodiagram showing the structures of the two monomers, with the N-terminal helix bundles superimposed. The secondary structure elements and termini are labeled. The figure was drawn using VMD (53).
at JAMES COOK UNIVERSITY, on September 29, 2009
www.jbc.org
The resonances of all backbone and side chain amide protons could be observed and assigned (Fig. 6). 1H{15N}NOEs
indi-cated increased mobility on a subnanosecond time scale for the 16 N-terminal and three C-terminal residues of DnaG-C, in agreement with the absence of electron density for the first 14 residues in both crystal conformers and for the C-terminal residue in conformer II. All other residues showed uniformly similar1H{15N}NOE values within the uncertainty of the
ex-periment. In particular, there was no evidence for increased mobility of the long connecting helix␣5 (data not shown).
Since helix␣5 is interrupted by nonhelical segments at dif-ferent locations in the two crystal conformers (Fig. 4), it could plausibly form a single long helix in solution, spanning resi-dues 513–558. As expected for an␣-helix, NOEs between the amide protons of sequentially neighboring residues,dNN, were
indeed observed for all nonoverlapping residues of this peptide segment in a three-dimensional NOESY-15N-HSQC spectrum.
For Trp-522, Ala-526, and Asp-527, however, the sequential NOEs between the ␣-protons and the amide protons of the following residues, d␣N, were much more intense than the corresponding dNN connectivities. This indicates that these
residues predominantly sample more extended conformations than expected for an␣-helix, in agreement with the bend ob-served in this segment in conformer I. In contrast, the kink near Met-542 in conformer II was not supported by a strong
d␣NNOE, and an extensive set ofd␣N(i,i⫹3) NOEs observed for the segment between Asn-529 and Glu-558 indicated␣ -hel-ical conformation. This identifies this kink as a crystallization artifact. In solution, the ␣-helix thus appears to be regular except for the segment between residues 522 and 527, as ob-served for crystal conformer I.
DnaG-C Dimerizes at High Concentrations in Solution—
Closer inspection of the three-dimensional NOESY-15N-HSQC
and two-dimensional NOESY spectra revealed several NOEs that could only be interpreted as intermolecular NOEs in a homodimer. Sizeable NOEs were identified between the aro-matic ring of Phe-535 and the methyl groups of Leu-454 and Leu-464, which were also involved in weak NOEs with the amide proton of Phe-535. Furthermore, a weak NOE was ob-served for the amide proton of Glu-532, which could only be explained as an interaction with a methyl group of Leu-464. These NOEs are in agreement with the dimer interface ob-served in the crystal structure, indicating that this interface in solution is similar to that in the crystal.
The asymmetry of the DnaG-C dimer in the crystal structure suggests a nonrigid interface, and the interaction between monomers is relatively weak. Gel filtration experiments indi-cated monomeric protein at lower concentrations (30), and sed-imentation equilibrium experiments failed to detect a mono-mer-dimer equilibrium at concentrations up to 5 mg/ml (data not shown). Furthermore, studies of the concentration depend-ence of15N-HSQC spectra (see below) suggest a dimerization
constant in the low millimolar range.
Transient Existence of Different Conformational States in Solution—Since the NMR data yielded only a single set of resonances, the dimer in solution is either symmetric or the averaging among different conformations is rapid on the NMR time scale (ms). The observation ofdNNNOEs in the presence
of strongd␣NNOEs in the segment between Trp-522 and
Asp-527 is difficult to explain by a single conformation but is com-patible with an equilibrium between a straight helix␣5 and a disrupted helix as in conformer I. The crystal structure shows that burial of the side chain of Phe-535 in the hydrophobic pocket of the globular N-terminal subdomain of the other mon-omer of DnaG-C can be achieved simultaneously for both mono-mers in the dimer by bending the␣5 helix. Straightening of␣5 would, however, disrupt the intermolecular interaction of Phe-535 for at least one of the monomers. Existence of an equilib-rium between a straight and a disrupted helix provides the most plausible interpretation of the NOEs observed in solution. The transient existence of different conformational states is supported by the solvent protection of exchangeable amide protons. The three-dimensional NOESY-15N-HSQC spectrum
displayed cross-peaks between the water and the amide pro-tons of DnaG-C arising from amide proton exchange with the water or by exchange-relayed NOEs with hydroxyl protons of serine, threonine, or tyrosine residues. The crystal structure revealed no cavities that could enclose tightly bound water molecules, so the possibility of strong intermolecular NOEs with water can be disregarded (43). Intense exchange cross-peaks were observed for the unstructured N-terminal segment and the loop regions between the helices (Fig. 7). Relatively intense cross-peaks were also observed for some of the solvent-exposed amide protons at the amino-terminal ends of the hel-ices. With few exceptions, however, the helices were character-ized by slow amide-proton exchange rates as expected for hydrogen-bonded protons. The crystal structure showed that, in general, the side chain hydroxyl groups of serine and thre-onine in the␣-helices were close to the amide protons of the following amino acid residues, establishing a pathway for ex-change-relayed NOEs. The remaining cross-peaks suggested that helix ␣4 is less stable than helices ␣1 and 3102; this is consistent with it being␣-helical in only one of the two crystal conformers (Fig. 4). The exchange cross-peaks of Asp-523 and the following residues support the presence of a structural irregularity in this part of helix␣5 but do not indicate as high solvent exposure as expected for the crystal conformer I. Like the NOEs discussed above, the relatively high, yet incomplete protection from solvent access observed in this region supports the existence of an equilibrium between a bent and a straight ␣5 helix. Similarly, the absence of a significant exchange cross-peak for Phe-543 supports the NOE data, indicating that the helix bend observed in this region in conformer II is not signif-icantly populated in solution. The cross-peak of Gln-533 over-lapped with the extremely strong cross-peak of Ser-440 and thus could not be interpreted. The exchange cross-peaks ob-served for helix␣5, however, suggested that this helix is less stable than the N-terminal helices.
Different peak intensities in the15N-HSQC spectrum (Fig. 6)
are indicative of different transverse relaxation times for
dif-FIG. 5.The structure of DnaG-C resembles that of the
N-termi-nal domain of DnaB.Monomers I (red) and II (blue) of DnaG-C are
superimposed on DnaB-N (yellow). Elements of secondary structure are shown inblack and white(DnaG) andmagenta(DnaB). Comparison of the crystal structures give average root mean square deviations of 1.87 Å (over 48 C␣atom positions) and 1.57 Å (51 C␣atoms) for DnaG-C monomers I and II, respectively. The figure was drawn using VMD (53).
at JAMES COOK UNIVERSITY, on September 29, 2009
www.jbc.org
ferent residues. Judging the peak intensities by the number of contour lines in the15N-HSQC spectrum, the weakest
cross-peaks were observed for residues Met-451, Asn-511, Ile-530, Met-542, Arg-559, Ser-564, and Asn-565. The last three of these are in the loop structure of the C-terminal helix hairpin, and their resonances could be broadened by conformational exchange or attenuated by chemical exchange with water pro-tons. Similarly, Asn-511 is located in a loop region of high solvent exposure. Most interestingly, however, Met-451, Ile-530, and Met-542 are located near the dimer interface. Their weak peak intensities suggest that the dimer interface is dy-namic on a microsecond to millisecond time scale. This notion is supported by the fact that a large number of residues for which relatively weak cross-peaks were observed in the 15N-HSQC
spectrum are located near the interface (Fig. 8).
In the situation of fast chemical exchange between mono-meric and dimono-meric forms of the protein, one would expect that the exchange-broadened signals narrow upon dilution of the protein. This was investigated by recording15N-HSQC spectra
at protein concentrations of 0.4, 0.04, and 0.004 mM(data not
shown). Only minor chemical shift changes were observed.
A⬎15% increase in the relative peak intensities observed for Asp-524, Ala-526, Ala-531, and Phe-535 at 0.04versus0.4 mM
supported the notion that the proportion of monomer increased upon dilution. The peak intensities did not grow further upon dilution to 0.004 mM, suggesting that insignificant amounts of dimer were left at 0.04 mM. That changes in chemical shifts
were minor indicates that the monomeric species is predomi-nant also at high concentrations, consistently with a dimeriza-tion constant of⬎1 mM.
A⬎15% increase in the relative peak intensities was also observed for residues 556, 558, 559, 561, 562, 564, and 565 at 0.04versus0.4 mM. These residues are located in the loop of the
C-terminal helix hairpin, far from the dimerization interface. This may be explained by some nonspecific protein aggregation at the higher concentration.
Further Evidence That Crystal Conformer I Is Most Highly Populated in Solution—Conformers I and II also show struc-tural differences in the globular N-terminal subdomain. For ex-ample, Asn-473 has positive and negativeangles in conformers I and II, respectively. A positiveangle is indicated in solution, since the NOEs between Asn-473 HNand the␣protons of
Asn-FIG. 6.15N-HSQC NMR spectrum of
uniformly 15N/13C-labeled DnaG-C.
The spectrum was recorded at 25 °C and a 1H NMR frequency of 600 MHz, using a 0.6 mM solution of labeled DnaG-C in 90% H2O/10% D2O at pH 6.07. The cross-peaks of the backbone amide pro-tons are assigned with the one-letter amino acid symbols and residue num-bers as in Fig. 4. Cross-peaks with a1H chemical shift of⬎10 ppm are from the side chains from Trp-522 and Trp-572. Cross-peaks from side chain amides are connected byhorizontal lines.
FIG. 7. Water-protein cross-peaks
versusamino acid sequence.The hor-izontal boxesdelineate the helices identi-fied in the crystal structure of monomers I and II (Fig. 4). The peak heights of the cross-peaks between water and amide protons observed in the three-dimen-sional NOESY-15
N-HSQC spectrum are plotted. Thefilledandgray bars, respec-tively, correspond to resolved and over-lapped cross-peaks. Theopen bars iden-tify serine and threonine residues. The
vertical scaleis an approximate measure of the magnetization transfer rates be-tween water and protein protons due to chemical exchange, NOE, and exchange-relayed NOE. The scale was calibrated by comparing the cross-peak and diagonal peak intensities of Gly-438, using the ini-tial rate approximation.
at JAMES COOK UNIVERSITY, on September 29, 2009
www.jbc.org
473 and Glu-472 were much stronger than the NOE with Glu-472 HN. Glu-472 is involved in crystal contacts in conformer II.
Sec-ond, Thr-510 assumes very differentangles in conformers I and II. Again, the observation of intense HN-HNNOEs between
Gly-509 and Thr-510 but not between Asn-511 and Asn-512 is in agreement with conformer I but opposite to expectations for conformer II. In the crystal structure, residues Asn-511 and Asn-512 in monomer II and the entire loop from His-506 to Asn-511 in monomer I are engaged in crystal contacts.
Both conformers have very similar backbone conformations in the helix hairpin at their C termini, except that theangle of His-561 is negative in conformer I and positive in II, resulting in its amide proton being oriented in an almost opposite direction. The set of NOEs observed between His-561 HNand other
back-bone protons again agreed closely with conformer I but not with II. In particular, there was no strong intraresidual H␣-HNNOE
indicative of a positiveangle for His-561. This observation may be explained by the presence of extensive crystal contacts involv-ing this residue in monomer II. In monomer I, there is only a single 3.4-Å hydrogen bond between His-561 oxygen and the symmetry-related Ser-564 nitrogen atom.
In conclusion, the NMR data show that the structure of DnaG-C in solution is similar to the x-ray conformer I, whereas the structure of conformer II seems to be distorted by crystal contacts. In particular, the subdomain structure with a globu-lar domain at the N terminus and a helix hairpin at the C terminus of DnaG-C is confirmed, including the long helical section connecting the two subdomains. There is evidence for a dynamic monomer-dimer equilibrium in solution at the concen-tration used for NMR, where helix␣5 appears to be straight in the monomer and bent in the segment of residues Trp-522 to Asp-527 in the dimer.
DISCUSSION
DnaG-C Contains All Determinants for Helicase Binding—
The similarity of the independently determined values ofKD
from SPR experiments with DnaG and DnaG-C (Figs. 1 and 2) and the lack of observable interaction of DnaB6with
immobi-lized DnaG-(1– 433) (Fig. 1A) indicate that all of the contacts involved in interaction of DnaG with DnaB6are localized in the
C-terminal domain. The data confirm earlier suggestions (18) that primase-helicase interactions inE. coliare rather tran-sient, showing fast on and off rates, and are weak, with values ofKDin the micromolar range (24, 39). It should be noted that
in the replisome, full-length DnaG would be expected to bind simultaneously via its C-terminal domain to DnaB6and via its zinc-binding domain and catalytic domains to the extended ssDNA template produced by helicase action. In this context, the helicase-primase interaction might be expected to be con-siderably stronger. Nevertheless, the similarity of values ofKD
for binding of DnaB6to covalently immobilized primase (Fig.
1B) and for interaction of primase with DnaB6that had been immobilized via its interaction with a short ssDNA indicates that interaction of DnaB6 with ssDNA in its central channel
(Fig. 2C) does not significantly influence its interaction with DnaG.
We found (Fig. 2C) that a maximum of three molecules of DnaG-C bind to the DnaB hexamer and that there was no evi-dence of strong cooperativity. This is consistent with previous results obtained with full-length DnaG from E. coli (44) and
B. stearothermophilus (19, 20) and supports a model wherein DnaB6acts at some stages as a trimer of dimers (C3symmetry).
The helicase has been shown to have three sites for binding (dimers) of its loading partner, DnaC (45), and nucleotides (46). Although our data with the full-length DnaG (Fig. 2C) might suggest that DnaB6is capable of binding more than three mole-cules of primase, they are far less reliable because they necessar-ily cover a very limited portion of the binding isotherm.
Functional Significance of DnaG-C Dimerization—The crys-tal structure of DnaG-C reveals a highly elongated protein with a structure related to that of the N-terminal domain of DnaB (Fig. 5). Like DnaB-N, DnaG-C exists in the crystalline state as a dimer, although in this case at least one of the monomers is trapped by crystal packing forces in a conformation that is not significantly populated in solution (Fig. 4). NMR spectroscopy
FIG. 8.Stereo view of the crystal structure of DnaG-C highlighting sites of exchange broadening identified in the15
N-HSQC NMR
spectrum.The backbones of conformers I and II are drawn inmagentaandgreen, respectively. The heavy atoms of the amino acid side chains
are drawn in the colors:yellowfor hydrophobic (Ala, Cys, Ile, Leu, Met, Phe, Pro, Trp, and Val),grayfor uncharged hydrophilic (Asn, Gln, Ser, Thr, and Tyr),redfor negatively charged (Asp and Glu), andbluefor positively charged (Arg, His, and Lys) residues.Gray spheresidentify backbone amide protons for which broadened cross-peaks were observed in the15
N-HSQC spectrum.Largeandsmall spherescorrespond to two and three contour levels, respectively, observed in Fig. 6. The figure was drawn using MOLMOL (54). at JAMES COOK UNIVERSITY, on September 29, 2009
www.jbc.org
was used to show that a dimer also exists in solution at high concentrations, where the predominant structure of the indi-vidual protein molecules resembles crystal conformer I (Fig. 4). Given that both DnaG and DnaG-C are monomers at physio-logical concentrations (21, 30), that there is now ample evi-dence that DnaB6contains an odd number of (i.e.three) bind-ing sites for primase (see also Refs. 20 and 44), and that the weakness of interactions between the E. coliproteins should ensure that no more than one primase monomer would bind DnaB6 at any one time during their interaction in vivo in priming Okazaki fragment synthesis, the biological signifi-cance of the existence of DnaG-C dimers is uncertain.
Nevertheless, some residues at the dimer interface have been conserved during evolution. Although the DnaG-C domain is more variable among bacterial species than is the central RNA polymerase domain (4), there are now at least 11 species in which overall sequence identity with theE. coliprotein is⬎30% (30). Many of the most conserved residues (Fig. 4A) are observed in the crystal structure to pack in the hydrophobic cores of the globular subdomains, and, as might be expected, exposed regions of the connecting helix are poorly conserved. Exceptions to this are Phe-535 and Leu-539, the side chains of which pack in the dimer against a conserved hydrophobic patch on the surface of the N-terminal subdomain in the other monomer (e.g.454, Leu-457, and Leu-467). This suggests either that dimerization of primase is involved in some aspect of its function (other than interaction with DnaB6) or that these residues form hydrophobic
surfaces for interaction with another protein. Another protein that has been shown to interact with primase is SSB, the ssDNA-binding protein. This interaction involves a single molecule of primase remaining associated with a completed primer while contacting SSB bound on the following ssDNA template (47). It seems plausible that the SSB-primase interaction might also be mediated via the DnaG-C domain, but this is apparently yet to be examined experimentally.
Functional Significance of Flexibility of DnaG-C—A remark-able aspect of the structure of DnaG-C is the high degree of flexibility of the central helix (␣5), which is interrupted in different places in the two crystal conformers (Fig. 4) but ap-pears to be mostly intact in solution. Previous work with ver-sions of primase with mutations in the C-terminal helix hairpin has shown this region (at least) to be involved in interaction with DnaB6(23, 27), and conserved surface residues (Fig. 4A) that might be important for this interaction include Arg-559 and Glu-567. If all sites of interaction with DnaB6are indeed located in this C-terminal subdomain, then the flexibility of␣5 could allow the remainder of DnaG to search a larger confor-mational space to help it locate priming sites on the single strand of DNA emerging from the central channel of DnaB6.
Site of Interaction of DnaG-C within DnaB6—There is
cur-rently debate concerning the site of interaction of primase in DnaB6(20). As determined originally by NMR studies of larger
N-terminal fragments of E. coli DnaB, the folded portion of DnaB-N comprises residues 24 –136 (48), and some mutations within this domain have been observed to affect the interaction between DnaB6and primase (49). However, by itself,
DnaB-N-(24 –136) is an unstable protein that is partly unfolded at 37 °C (50), which probably means that the structure of this part of DnaB6is very easy to destabilize by mutagenesis.
These mutational data contrast with those from two other studies that suggest involvement in primase binding of regions in the interdomain hinge (residues 136 to ⬃170) and the C-terminal domain of DnaB. Stordal and Maurer (51) presented data on the I135N, I141T, and L156P mutants that were con-sistent with the hinge being a site for interaction with DnaG, and Luet al.(24) used deletion analysis to map an interaction
site to the region in the C-terminal domain between Tyr-210 and Val-255. On the other hand,B. stearothermophilusDnaB6 forms a stable complex with bothB. stearothermophilusDnaG and its C-terminal domain, and although neither the N- or C-terminal domains of B. stearothermophilus DnaB interact separately with DnaG (19), mutagenesis of conserved residues in the interdomain hinge of DnaB (corresponding to Ile-135 and Ile-141 in theE. coliprotein) did compromise its interaction with theB. stearothermophilusprimase (20).
Although there is evidence, therefore, for interaction of DnaG-C with the hinge in DnaB6, we were unable to detect any
sign of interaction of DnaG-C with 2H(70%)/13C/15N-labeled
DnaB-N-(1–161) (52) by NMR spectroscopy at concentrations near 0.5 mM, where very weak interactions would have been
detected (data not shown). DnaB-N-(1–161) contains 25 resi-dues from the hinge region that are unstructured in solution (48), and it includes Ile-135, Ile-141, and Leu-156. There are two possible explanations. It could be that in intact DnaB6, but not in DnaB-N-(1–161), the hinge region is structured and recognizable by primase. A second possibility is that mutations in residues in the hinge (and also destabilizing mutations within DnaB-N) affect the capacity of the N-domain to dimerize (12, 13) and that dimerization of DnaB-N in DnaB6is required
to generate the primase binding site. This would be consistent with the maximum capacity of the DnaB hexamer to bind three molecules of DnaG-C (Fig. 2) and the observation ofC3 sym-metry in the complex of the intact B. stearothermophilus
proteins (20).
Acknowledgments—We are grateful to Subhash Vasudevan and Chris Penington for construction of plasmids expressing DnaG-(1– 433), Max Keniry and Bogdan Bancia for NMR relaxation studies, and Simon Bennett for electrospray ionization mass spectrometry measurements.
REFERENCES
1. Kornberg, A., and Baker, T. A. (1992)DNA Replication, 2nd Ed., W. H. Free-man & Co., New York
2. Ogawa, T., and Okazaki, T. (1980)Annu. Rev. Biochem.49,421– 457 3. Bouche´, J. P., Zechel, K., and Kornberg, A. (1975)J. Biol. Chem. 250,
5995– 6001
4. Aravind, L., Leipe, D. D., and Koonin, E. V. (1998)Nucleic Acids Res.26,
4205– 4213
5. LeBowitz, J. H., and McMacken, R. (1986)J. Biol. Chem.261,4738 – 4748 6. San Martin, M. C., Stamford, N. P. J., Dammerova, N., Dixon, N. E., and
Carazo, J. M. (1995)J. Struct. Biol.114,167–176
7. Yu, X., Jezewska, M. J., Bujalowski, W., and Egelman, E. H. (1996)J. Mol. Biol.259,7–14
8. Donate, L. E., Llorca, O´ ., Ba´rcena, M., Brown, S. E., Dixon, N. E., and Carazo, J. M. (2000)J. Mol. Biol.303,383–393
9. Jezewska, M. J., Rajendran, S., Bujalowska, D., and Bujalowski, W. (1998)
J. Biol. Chem.273,10515–10529
10. Kaplan, D. L. (2000)J. Mol. Biol.301,285–299
11. Nakayama, N., Arai, N., Kaziro, Y., and Arai, K. (1984)J. Biol. Chem.259,
88 –96
12. Weigelt, J., Brown, S. E., Miles, C. S., Dixon, N. E., and Otting, G. (1999)
Structure7,681– 690
13. Fass, D., Bogden, C. E., and Berger, J. M. (1999)Structure7,691– 698 14. Sawaya, M. R., Guo, S., Tabor, S., Richardson, C. C., and Ellenberger, T. (1999)
Cell99,167–177
15. Yang, S., Yu, X., VanLoock, M. S., Jezewska, M. J., Bujalowski, W., and Egelman, E. H. (2002)J. Mol. Biol.321,839 – 849
16. Keck, J. L., Roche, D. D., Lynch, A. S., and Berger, J. M. (2000)Science287,
2482–2486
17. Frick, D. N., and Richardson, C. C. (2001)Annu. Rev. Biochem.70,39 – 80 18. Tougu, K., Peng, H., and Marians, K. J. (1994)J. Biol. Chem.269,4675– 4682 19. Bird, L. E., Pan, H., Soultanas, P., and Wigley, D. B. (2000)Biochemistry39,
171–182
20. Thirlway, J., Turner, I. J., Gibson, C. T., Gardiner, L., Brady, K., Allen, S., Roberts, C. J., and Soultanas, P. (2004)Nucleic Acids Res.31,2977–2986 21. Stamford, N. P. J., Lilley, P. E., and Dixon, N. E. (1992)Biochim. Biophys. Acta
1132,17–25
22. Kusakabe, T., and Richardson, C. C. (1996)J. Biol. Chem.271,19563–19570 23. Tougu, K., and Marians, K. J. (1996)J. Biol. Chem.271,21391–21397 24. Lu, Y.-B., Ratnakar, P. V. A. L., Mohanty, B. K., and Bastia, D. (1996)Proc.
Natl. Acad. Sci. U. S. A.93,12902–12907 25. Pan, H., and Wigley, D. B. (2000)Structure8,231–239
26. Podobnik, M., McInerney, P., O’Donnell, M., and Kuriyan, J. (2000)J. Mol. Biol.300,353–362
27. Tougu, K., and Marians, K. J. (1996)J. Biol. Chem.271,21398 –21405 28. Elvin, C. M., Thompson, P. R., Argall, M. E., Hendry, P., Stamford, N. P. J.,
at JAMES COOK UNIVERSITY, on September 29, 2009
www.jbc.org
Lilley, P. E., and Dixon, N. E. (1990)Gene(Amst.)87,123–126 29. Love, C. A., Lilley, P. E., and Dixon, N. E. (1996)Gene(Amst.)176,49 –53 30. Loscha, K., Oakley, A. J., Bancia, B., Schaeffer, P. M., Prosselkov, P., Otting,
G., Wilce, M. C. J., and Dixon, N. E., (2004)Protein Expression Purif.33,
304 –310
31. Kunkel, T. A., Bebenek, K., and McClary, J. (1991)Methods Enzymol.204,
125–139
32. Gill, S. C., and von Hippel, P. H. (1989)Anal. Biochem.182,319 –326 33. Bradford, M. M. (1976)Anal. Biochem.72,248 –254
34. Bru¨nger, A. T., Adams, P. D., Clore, G. M., DeLano, W. L., Gros, P., Grosse-Kunstleve, R. W., Jiang, J. S., Kuszewski, J., Nilges, M., Pannu, N. S., Read, R. J., Rice, L. M., Simonson, T., and Warren, G. L. (1998)Acta Crystallogr. Sect. D54,905–921
35. Perrakis, A., Sixma, T. K., Wilson, K. S., and Lamzin, V. S. (1997)Acta Crystallogr. Sect. D53,448 – 455
36. Jones, T. A., Zou, J. Y., Cowan, S. W., and Kleldgaard, M. (1991)Acta Crys-tallogr. Sect. A47,110 –119
37. Winn, M. D., Isupov, M. N., and Murshudov, G. N. (2001)Acta Crystallogr. Sect. D57,122–133
38. Krissinel, E., and Henrick, K. (2004)Acta Crystallogr. Sect. D.60,2256 –2268 39. Yuzhakov, A., Turner, J., and O’Donnell, M. (1996)Cell86,877– 886 40. Bujalowski, W., Klonowska, M. M., and Jezewska, M. J. (1994)J. Biol. Chem.
269,31350 –31358
41. Hoffman, D. W., Cameron, C. S., Davies, C., White, S. W., and Ramakrishnan, V. (1996)J. Mol. Biol.264,1058 –1071
42. Fallon, J. L., and Quiocho, F. A. (2003)Structure11,1303–1307 43. Otting, G. (1997)Prog. NMR Spectr.31,259 –285
44. Mitkova, A. V., Khopde, S. M., and Biswas, S. B. (2003)J. Biol. Chem.278,
52253–52261
45. Ba´rcena, M., Ruiz, T., Donate, L. E., Brown, S. E., Dixon, N. E., Radermacher, M, and Carazo, J. M. (2001)EMBO J.20,1462–1468
46. Jezewska, M. J., and Bujalowski, W. (1996)J. Biol. Chem.271,4261– 4265 47. Yuzhakov, A., Kelman, Z., and O’Donnell, M. (1999)Cell96,153–163 48. Miles, C. S., Weigelt, J., Stamford, N. P. J., Dammerova, N., Otting, G., and
Dixon, N. E. (1997)Biochem. Biophys. Res. Commun.231,126 –130 49. Chang, P., and Marians, K. J. (2000)J. Biol. Chem.275,26187–26195 50. Williams, N. K., Prosselkov, P., Liepinsh, E., Line, I., Sharipo, A., Littler, D. R.,
Curmi, P. M. G., Otting, G., and Dixon, N. E., (2002)J. Biol. Chem.277,
7790 –7798
51. Stordal, L., and Maurer, R. (1996)J. Bacteriol.178,4620 – 4627
52. Weigelt, J., Miles, C. S., Dixon N. E., and Otting, G. (1998)J. Biomol. NMR11,
233–234
53. Humphrey, W., Dalke, A., and Schulten, K. (1996)J. Mol. Graphics14,33–38 54. Koradi, R., Billeter, M., and Wu¨ thrich, K. (1996)J. Mol. Graphics14,51–55
at JAMES COOK UNIVERSITY, on September 29, 2009
www.jbc.org