Examining the Relationship Between Visual Imagery
and Spatial Ability Tests
Lorelle J. Burton
The University of Southern Queensland
Word count: 3763
Mailing Address: Dr Lorelle J. Burton
Department of Psychology
The University of Southern Queensland
Toowoomba Queensland 4350
Australia
Burton, Lorelle J. (2003) Examining the relation between visual imagery and spatial ability tests. International Journal of Testing, 3 (3). pp. 277-291. ISSN 1532-7574
Abstract
Research evidence indicates that self-report imagery ability is psychometrically distinct from objective, spatial test measures. One hypothesis put forward in the literature to explain this finding is that the nature of the stimulus is important. The aim of this paper was to examine the relationship between spatial abilities and measures of visual imagery obtained using different types of stimulus material. The main finding was that imagery tasks that required the mental synthesis and/or
transformation of visual forms such as alphanumeric characters and simple geometric shapes correlated strongly with tests of spatial ability. In contrast, images of familiar items retrieved from long-term memory did not correlate with spatial test
Examining the Relationship Between Visual Imagery and Spatial Ability Tests
Psychometric research has indicated that certain factors in the spatial domain represent combinations of the ability to create, maintain, and transform abstract, visual images (El Koussy, 1935; Griffitts, 1927; Lohman, 1979; Smith, 1964). Interpretations of several major spatial factors refer to the use of visual imagery to solve particular spatial problems (Carroll, 1993; Lohman, Pellegrino, Alderton, & Regian, 1987). For example, the Spatial Relations (SR) factor reflects efficiency of the image rotation process, while the Visualisation (VZ) factor involves multiple transformations (e.g., synthesis, transposition, and rotation processes) of images (Lohman, 1988). However, a relationship between visual imagery measures and tests of spatial ability has been assumed despite the lack of empirical evidence.
Two principal arguments support the assumption that visual imagery is a central component of spatial test performance: (a) introspective reports from
participants (e.g., Barratt, 1953); and (b) an intuitive view that imagery is important (Poltrock & Agnoli, 1986). Thus, despite a lack of theoretical justification, spatial tests became accepted as “objective” imagery tests. This was largely because participants reported that they could form a vivid image and manipulate it when solving spatial tests (Ernest, 1977).
Self-report measures of vividness and control remain the most common technique for assessing individual differences in visual imagery ability. There are two main questionnaires used by imagery researchers. First, there are more than 150 reports of the Marks (1973) Vividness of Visual Imagery Questionnaire (VVIQ) being used (Marks, 1989a, 1989b). The VVIQ is based on imagining familiar scenes such as a relative or a friend, the sun, or a country scene. Second, Gordon's (1949) Test of Visual Imagery Control (TVIC) is commonly used to measure the ability to control and manipulate visual images. The TVIC also requires participants to visualise familiar scenes such as a car.
Empirical evidence, however, suggests that subjective qualities of imagery are unrelated to spatial test performance (Kosslyn, Brunn, Cave, & Wallach, 1984; Poltrock & Agnoli, 1986; Poltrock & Brown, 1984). More recent investigations with VVIQ data have established that self-report vividness of imagery is unrelated to spatial task performance (McKelvie, 1995a, 1995b; Worth & Burton, 2000). Factor analytic studies indicate that self-report techniques tap facets of imagery distinct from those processes that underlie spatial ability (e.g., Di Vesta, Ingersoll, & Sunshine, 1971; Richardson, 1977, 1994). Such findings dispute the tendency to interpret spatial test performance as an index of imagery ability.
The lack of a definite correlation between subjective measures and spatial ability tests has led to a disregard for the self-report technique as a measure of visual imagery ability. However, new measures designed to tap a wider range of properties and qualities of images have been shown to correlate with performance on spatial tests (see Burton & Fogarty, in press). Firstly, the Dean and Morris (1991)
The main aim of the Burton and Fogarty (in press) study was to investigate whether visual imagery can be regarded as a separable component of psychometric spatial ability. They used a wide range of visual imagery measures to test this proposition, including the Dean and Morris (1991) imagery questionnaire and the Finke et al. (1989) creative imagery tasks. This paper, in contrast, focussed
specifically on the relationship between subjective and objective measures of visual imagery ability. The main aim was to examine the relationship between introspective reports of imagery and spatial tests that are presumed to require imagery. To this end, measures of well-replicated spatial primary abilities, including VZ, SR,
Perceptual Speed (P), Flexibility of Closure (CF), Speed of Closure (CS), and Visual Memory (MV) abilities, were included in the test battery. Additionally, self-report questionnaires that make use of objective, spatial stimuli were included along with purely subjective measures (e.g., VVIQ and TVIC). It was hypothesised that self-report measures that were more stimulus-based would better correlate with measures of spatial ability.
Method Participants
A total of 213 participants (114 females) took part. Half were recruited from the adult population of the regional city of Toowoomba. The rest were undergraduate psychology students from the University of Southern Queensland who participated to gain credit in their course. The average age was 26.32 years with a standard deviation of 8.91 years. The mean age of the females was 24.58 years, with a range from 17 to 54 years. The males had a mean age of 28.33 years, with a range from 17 to 59 years.
Materials
Spatial ability tests.
A total of 18 marker tests were included in the battery for the following first-order factors from the domain of visual perception: VZ, SR, CS, CF, P, and MV. The following reference tests are from the Ekstrom, French, Harman, and Dermen (1976) kit of factor-referenced cognitive tests, except where indicated. The dependent variable for each reference test was the number correct.
The P factor reflects speed in comparing figures or symbols. The following three tests were used to demarcate P ability:
1. Finding A’s (P1).
2. Number Comparison (P2).
3. Identical Pictures (P3).
The SR factor reflects the ability to perceive an object from different
positions. It is usually defined by speeded tests involving rotations and/or reflections (Lohman, 1988). The following tests were included as markers for the SR factor:
4. Card Rotations (SR1).
5. Cube Comparisons (SR2).
6. Spatial Relations (SR3; Thurstone & Thurstone, 1965).
The VZ factor reflects the ability to apprehend a spatial form and rotate it in two or three dimensions before matching it with another spatial form. The following tests were used to demarcate VZ ability:
7. Paper Form Board (VZ1).
8. Paper Folding (VZ2).
9. Surface Development (VZ3).
10. Hidden Patterns (CF2).
11. Copying (CF3).
Due to time constraints, participants were given only 6 minutes to complete the first 9 items in the Hidden Figures (CF1) test. This test was later dropped from analyses because of poor reliability.
The CS factor reflects the “ability to identify quickly an incomplete or distorted picture” (Lohman et al., 1987, p. 266). The following three tests were used to mark for CS ability:
12. Gestalt Completion (CS1).
13. Concealed Words (CS2).
14. Snowy Pictures (CS3).
The MV factor reflects the ability to form and retain a mental image so as to locate the orientation of figural material (Carroll, 1993). The following three tests were used to mark for the MV factor:
15. Shape Memory (MV1).
16. Building Memory (MV2).
17. Map Memory (MV3).
Due to time constraints, for the Shape Memory and Building Memory tests, participants were allowed 3 minutes for memorising, and a further 3 minutes to complete the items, rather than the recommended 4 minutes for each section.
Creative imagery task measures.
Two sets of creative imagery tasks were developed, based on findings obtained by Finke et al. (1989). First, the Emergent Forms task measured the ability to mentally detect emergent patterns in a synthesised image. Second, the
Transformation task measured the ability to identify a final pattern after transforming a mental image in specified ways. Instructions were verbally presented through headphones. A 3 s pause was provided between each step to allow participants enough time to form the image required. However, participants could press the pause button if they required more time to complete each step. Participants also received a paper copy of the initial task instructions. A brief description of each task follows.
18. Emergent Forms Task (Emergent). In this 6-item task, participants were
required to imagine superimposing pairs of letters, numbers, or basic alphanumeric forms and to report any geometric or symbolic forms they could "detect" by mentally inspecting their image. For example, as shown in Figure 1: “Imagine the letter E. (Pause) Now imagine the letter P. (Pause) I want you to place the letter E directly beside the letter P so that all end points or edges match up” (Finke et al., 1989, p. 56). Participants were instructed to write down as many of the emergent forms they were able to detect. They were told not to draw the image until they had written down everything they could see in their image. In the above example, emergent forms detected might include two rectangles and a silo shape on its side. Upon drawing the final pattern imagined, participants were requested to report any additional emergent forms that they could now detect, but that they had not previously seen in their image. The dependent variable was the total number of emergent forms (both symbolic and geometric forms) detected from imagery.
--- Insert Figure 1 about here ---
19. Transformation Task (Transform). In this 12-item task, participants were
shown in Figure 2: "Imagine the letter Y. (Pause) Put a small circle at the bottom of it. (Pause) Add a horizontal line halfway up. (Pause) Now rotate the figure 180 degrees" (Finke et al., 1989, p. 62). In this case, a correct identification would be a stick figure. For each item, participants were instructed to indicate whether they were able to correctly guess the identity of the final pattern at any stage prior to the final transformation step. At the end of each set of instructions, participants were required to write down the description of the identified final pattern on the response sheet provided. Finally, participants were asked to draw the final pattern imagined and to try to identify it from their drawing if they had not done so during imagery.
Participants were also required to report any difficulties they may have had when transforming their image. A measure of participants' transformation ability was computed by totaling the number of correct pattern identifications made from imagery.
--- Insert Figure 2 about here ---
Self-report measures.
The imagery questionnaire developed by Dean and Morris (1991) was adapted for inclusion in this study. Participants were required to imagine two spatial shapes (see Figure 3). The first shape was two-dimensional, and chosen from the
Comprehensive Ability Battery - Spatial (CAB-S, Hakstian & Cattell, 1975) test of mental rotation. The second shape was three-dimensional, and selected from the Vandenberg and Kuse (1978) test of mental rotation.
--- Insert Figure 3 about here ---
For both the CAB-S and Vandenberg shapes, participants were asked to rate each of the following 13 properties separately, and independently of the other shape. They were first asked to rate the image of the static shape on eight parameters: (a) ease of evocation, (b) detail, (c) clarity, (d) ease of maintenance, (e) detail change, (f) clarity change, (g) proportion, and (h) vividness. Participants were then required to imagine the shape rotating and to rate the image according to the following five properties: (a) ease of rotation, (b) detail during rotation, (c) clarity during rotation, (d) proportion during rotation, and (e) vividness during rotation. All item ratings were made on a scale of 1 to 9 (1 = very poor, 9 = very good). Additionally, participants
were required to mark on the different shapes what parts they had imagined when the image was static and, similarly, the parts they imagined during rotation. Total scale scores for each participant were computed for the following spatial shapes:
20.The CAB-S Questionnaire (CABSqnre). 21.Vandenberg Questionnaire (Vandqnre).
Participants also completed the following questionnaires:
22. Test of Visual Imagery Control (TVIC). The TVIC is a 12-item
questionnaire designed to measure the ease with which individuals can control and/or manipulate the visual image of a car (Richardson, 1969). Participants had to indicate their degree of imagery control according to the 3-point scale (yes, no, and unsure).
23. Vividness of Visual Imagery Questionnaire (VVIQ). The VVIQ was
“know” that you are thinking of an object). Each of the 16 items in the scale was
rated twice, once with the eyes open and once with them closed.
Procedure
The spatial tests, self-report questionnaires, and creative imagery tasks examined in this paper were completed as part of a large-scale study described in Burton and Fogarty (in press). The total testing time was about 5 hours, broken into two 2.5 hour sessions. The first session involved the timed test battery of
psychometric tests primarily taken from the Ekstrom et al. (1976) kit: General Fluid (Gf), General Crystallised (Gc), P, SR, VZ, CF, CS, and MV. The second session included the self-report imagery questionnaires and the creative imagery tasks. A maximum of 12 people was present in the first session and 5 during the second. Testing was carried out over a 6-month period. Participants received feedback on their imagery ability at the completion.
Results
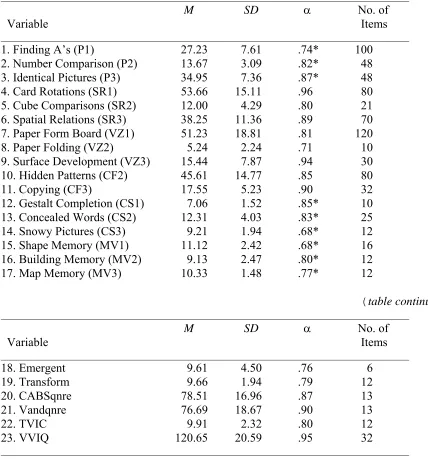
Table 1 presents the summary statistics for all visual imagery and spatial test variables examined. As shown, the internal consistency estimates for the different total scale measures were reasonable (e.g., McKelvie, 1994).
--- Insert Table 1 about here ---
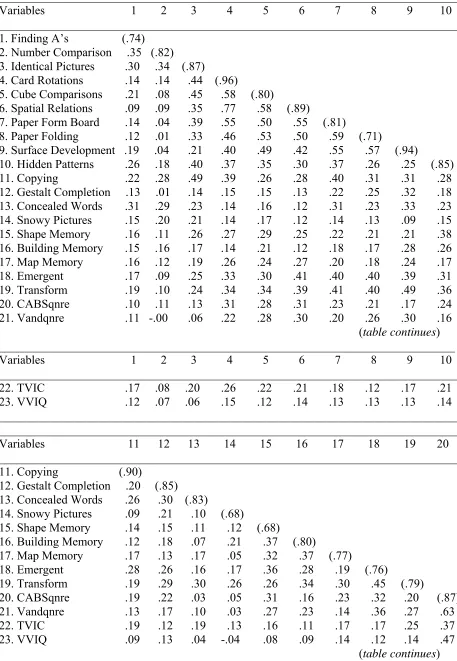
Table 2 presents the correlations obtained among all 23 variables reported in Table 1. The reliability estimates (Cronbach’s α) are printed in parentheses along the diagonal of the correlation matrix. As expected, significant correlations were evident among most of the spatial test marker variables. Moderate to high correlations were also observed among the Emergent and Transform variables derived from the Finke et al. (1989) creative imagery tasks and the majority of the spatial test variables,
especially the VZ marker tests (r > .40, p < .01). For example, the Transform variable
was significantly correlated with the SR measures (r > .34, p < .01), indicating that
similar processes were in operation during respective task performances. This is in line with expectations, as both tasks aimed to measure the ability to mentally rotate and/or reflect a stimulus object. Moderate to high correlations were also evident among the various self-report imagery measures. Interestingly, the CABSqnre and Vandqnre variables derived from the new-format imagery questionnaire showed significant correlations with the SR, VZ, and MV marker variables (.14 < r < .31, p <
.05). In contrast, the self-report measure of imagery vividness for non-spatial shapes (i.e., VVIQ) failed to correlate with the other, more objective, measurement
techniques. However, the self-report measure of imagery control (i.e., TVIC) shared some variance with the tests of spatial ability (.11 < r < .26, p < .05).
--- Insert Table 2 about here ---
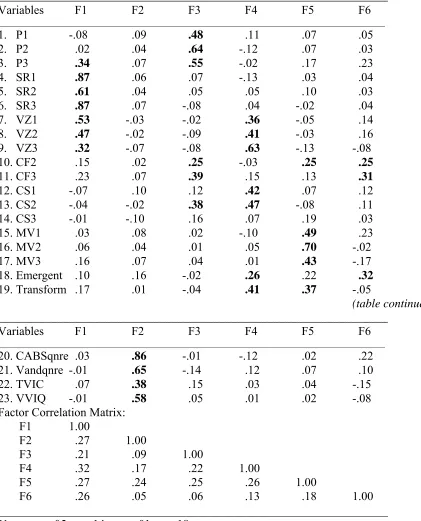
An exploratory factor analysis using Principal Axis Factoring with oblique rotation was used to investigate the underlying factor structure of the visual imagery and spatial test variables. Cattell’s (1966) scree test indicated that six factors should be extracted. Table 3 presents the pattern matrix for this six-factor solution, with all loadings greater than or equal to 0.25 in bold font to facilitate interpretation.
---
As shown in Table 3, the more objective measures of spatial-imagery abilities loaded together to define the same dimension, distinct from those processes tapped by the self-report questionnaires of imagery ability. The first factor was defined as SR ability, dominated by loadings from the three SR marker tests. The VZ marker tests also showed significant loadings on this first factor. In contrast, the second factor was defined by the four self-report visual imagery measures. The third factor was defined as P, with the three P marker tests loading most highly on this factor. The fourth factor was defined by the three VZ marker tests and by two CS marker tests. Interestingly, the Emergent and Transform variables also showed significant loadings on this factor. The fifth factor was defined as MV ability, dominated by loadings from the three MV marker tests. Finally, the sixth factor was defined by the two CF marker tests. The Emergent variable also showed a substantial loading on this final factor. It was reasonable to expect this finding, given that the Emergent forms task was included as a measure of participants’ ability to mentally detect emergent patterns in a synthesised image.
The factor correlation matrix is presented in the lower part of Table 3. Interestingly, although the Self-Report Imagery factor emerged distinct from the other spatial factors, moderate correlations (r > .24, p < .05) were evident between
this factor and the SR and MV factors, respectively. This finding indicated that self-report imagery is a separate dimension of imagery ability, but correlated with spatial ability, especially when common, well-structured stimuli are used.
Discussion
This study concentrated on the relationship between visual imagery and spatial ability tests. It was argued that including spatial figures as stimuli to be imagined on the imagery questionnaires would produce correlations with measures of spatial ability, as those stimuli are similar to those found on visual perception tests. Several noteworthy findings emerged. Firstly, the relationship between self-report imagery questionnaires and spatial tests is partly dependent on the type of stimuli used. Self-ratings of images of spatial shapes are more closely related to the processes tapped by conventional spatial tasks (.23 < r <.32) than are self-ratings of familiar objects
recalled from long-term memory (-.05 < r < .15). The more similar the stimuli, the
stronger the correlation between self-report visual imagery measures and conventional spatial tests. This might also explain the strong relationship between the measures derived from the Finke et al. (1989) creative imagery tasks and tests of spatial ability. These tasks require the mental synthesis of alphanumeric characters and simple geometric shapes and are closely linked to Lohman’s (1988) proposition that imagery is central to spatial test performance.
Thus, an important finding of this study is that while the literature often reports no correlation between introspective measures of imagery and spatial tests (e.g., Di Vesta et al., 1971; Richardson, 1977), this may be overcome by asking participants to imagine spatial shapes. It is mainly the difference in item type that results in the failure of traditional self-report imagery questionnaires to correlate with spatial tests. The CABSqnre and Vandqnre variables significantly correlate with the psychometric measures of spatial ability (p < .05). Thus, the new-format self-report
imagery questionnaire by Dean and Morris creates favourable conditions for tapping a wider range of imagery processes that are related to those processes used to solve spatial problems. Importantly, self-report measures of imagery for spatial shapes are more likely to correlate with spatial tests than questionnaires that use non-spatial shapes as stimuli. In contrast, ratings of familiar items on imagery questionnaires show little correlation with the spatial tests.
The factor analytic results of the present study support the stability of self-report imagery as an individual differences variable. The traditional self-self-report imagery questionnaires (e.g., VVIQ and TVIC) loaded together with the new-format questionnaire by Dean and Morris (1991) to define a separate factor of visual imagery ability. Measures of imagery based on self-report techniques are different from, but not necessarily less reliable than, measures based on more objective methodologies. The questionnaire format is appropriate to the measurement of individual differences in imagery ability because visual imagery is essentially an introspective field of study. In contrast, the correlations among the Emergent and Transform variables and the spatial test scores were as robust as any of the correlations among the spatial primaries themselves. The implication is that all visual imagery measures, apart from the self-report imagery questionnaires, might best be envisaged as being additional indicators of VZ or MV abilities. Thus, although these measures have been referred to as “imagery” markers here, the Finke et al. tasks can act just like another set of spatial measures when more objectivity is introduced into the measurement process.
The present findings highlight the importance of the informational content (i.e., stimuli type) of the image. The most relevant stimuli to compare with data from spatial tests are abstract, geometric shapes rather than items of familiar scenes that are retrieved from long-term memory. The more geometrically structured the stimulus to be imagined, the more objective the measure of imagery and the better the indicator of spatial ability. Future research should manipulate the stimuli included in spatial tests so that they approximate the stimuli on visual imagery questionnaires.
Manipulating the stimuli this way will help to tap imagery processes similar to those that play a functional role in spatial test performance and thus provide more objective tests of visual imagery ability. This is currently under investigation.
References
Barratt, E. S. (1953). An analysis of verbal reports of solving spatial problems as an aid in defining spatial factors. Journal of Psychology, 36, 17-25.
Burton, L. J., & Fogarty, G. J. (in press).The factor structure of visual imagery and spatial abilities. Intelligence, 153.
Carroll, J. B. (1993). Human cognitive abilities: A survey of factor-analytic studies.
USA: Cambridge University Press.
Cattell, R. B. (1966). The scree test for the number of factors. Multivariate Behavioural Research, 1, 245-276.
introspective reports predict performance. In R. H. Logie & M. Denis (Eds.),
Mental images in human cognition (pp. 331-347). North-Holland: Elsevier Science.
Di Vesta, F. I., Ingersoll, G., & Sunshine, P. A. (1971). A factor analysis of
imagery tests. Journal of Verbal Learning and Verbal Behaviour, 10, 471-479.
Ekstrom, R. B., French, J. W., & Harman, H. H., & Dermen, D. (1976). Manual for kit of factor-referenced cognitive tests. Princeton, NJ: Educational Testing Service.
El Koussy, A. A. (1935). An investigation into the factors in tests involving the
visual perception of space. British Journal of Psychology Monograph Supplement
(Whole No. 20).
Ernest, C. H. (1977). Mental imagery and cognition: A critical review. Journal of Mental Imagery, 1, 181-216.
Finke, R. A., Pinker, S., & Farah, M. J. (1989). Reinterpreting visual patterns in mental imagery. Cognitive Science, 13, 51-78.
Gordon, R. (1949). An investigation into some of the factors that favour the
formation of stereotyped images. British Journal of Psychology, 39, 156-167.
Griffitts, C. H. (1927). Individual differences in imagery. Psychological Monographs, 37 (Whole No. 172).
Hakstian, A. R., & Cattell, R. B. (1975). Comprehensive ability battery.
Champaign, IL: Institute for Personality and Ability Testing.
Kosslyn, S. M., Brunn, J., Cave, K. R., & Wallach, R. W. (1984). Individual
differences in mental imagery ability: A computational analysis. Cognition, 18,
195-243.
Lohman, D. F. (1979). Spatial ability: A review and re-analysis of the correlational literature (Technical Rep. No. 8). Stanford, CA: Aptitudes Research Project,
School of Education, Stanford University.
Lohman, D. F. (1988). Spatial abilities as traits, processes, and knowledge. In R. J.
Sternberg (Ed.), Advances in the psychology of human intelligence: Vol. 4 (pp.
181-248). Hillsdale, NJ: Erlbaum.
Lohman, D. F., Pellegrino, J. W., Alderton, D. L., & Regian, J. W. (1987).
Dimensions and components of individual differences in spatial abilities. In S. H. Irvine & S. N. Newstead (Eds.), Intelligence and cognition: Contemporary frames of reference (pp. 253-312). Dordrecht, Netherlands: Nijhoff.
Marks, D. F. (1973). Visual imagery differences in the recall of pictures. British Journal of Psychology, 64(1), 17-24.
Marks, D. F. (1989a). Bibliography of research utilising the Vividness of Visual Imagery Questionnaire. Perceptual and Motor Skills, 69, 707-718.
Marks, D. F. (1989b). Construct validity of the Vividness of Visual Imagery Questionnaire. Perceptual and Motor Skills, 69, 459-465.
McKelvie, S. J. (1994). Guidelines for judging psychometric properties of imagery questionnaires as research instruments: A quantitative proposal. Perceptual and Motor Skills, 79, 1219-1231.
McKelvie, S. J. (1995a). The VVIQ and beyond: Vividness and its measurement.
Journal of Mental Imagery, 19(3-4), 197-252.
McKelvie, S. J. (1995b). The VVIQ as a psychometric test of individual differences in visual imagery vividness: A critical quantitative review and plea for direction.
Journal of Mental Imagery, 19(3-4), 1-106.
Poltrock, S. E., & Agnoli, F. (1986). Are spatial visualisation ability and visual
imagery ability equivalent? In R. J. Sternberg (Ed.), Advances in the psychology of human intelligence: Vol. 3 (pp. 255-296). Hillsdale, NJ: Lawrence Erlbaum.
spatial ability. Intelligence, 8, 93-138.
Richardson, A. (1977). The meaning and measurement of memory imagery.
British Journal of Psychology, 68, 29-43.
Richardson, A. (1994). Individual differences in imaging: Their measurement, origins, and consequences. Amityville, NY: Baywood Publishing Co.
Smith, I. M. (1964). Spatial ability: Its educational and social significance.
London: University of London Press.
Thurstone, L. L., & Thurstone, T. G. (1965). Primary mental abilities. Chicago, IL:
Science Research Associates.
Vandenberg, S. G., & Kuse, A. R. (1978). Mental rotations, a group test of three- dimensional spatial visualisation. Perceptual and Motor Skills, 47, 599-604.
Worth, E., & Burton, L. J. (2000). The criterion related validity of the Revised Vividness of Visual Imagery Questionnaire. Poster session presented at the 35th Annual
Table 1
Summary Statistics for Visual Imagery and Spatial Test Variables
_________________________________________________________________________________ M SD α No. of
Variable Items
_________________________________________________________________________________ 1. Finding A’s (P1) 27.23 7.61 .74* 100
2. Number Comparison (P2) 13.67 3.09 .82* 48 3. Identical Pictures (P3) 34.95 7.36 .87* 48 4. Card Rotations (SR1) 53.66 15.11 .96 80 5. Cube Comparisons (SR2) 12.00 4.29 .80 21 6. Spatial Relations (SR3) 38.25 11.36 .89 70 7. Paper Form Board (VZ1) 51.23 18.81 .81 120 8. Paper Folding (VZ2) 5.24 2.24 .71 10 9. Surface Development (VZ3) 15.44 7.87 .94 30 10. Hidden Patterns (CF2) 45.61 14.77 .85 80 11. Copying (CF3) 17.55 5.23 .90 32 12. Gestalt Completion (CS1) 7.06 1.52 .85* 10 13. Concealed Words (CS2) 12.31 4.03 .83* 25 14. Snowy Pictures (CS3) 9.21 1.94 .68* 12 15. Shape Memory (MV1) 11.12 2.42 .68* 16 16. Building Memory (MV2) 9.13 2.47 .80* 12 17. Map Memory (MV3) 10.33 1.48 .77* 12
(table continues)
_________________________________________________________________________________ M SD α No. of
Variable Items
_________________________________________________________________________________ 18. Emergent 9.61 4.50 .76 6
19. Transform 9.66 1.94 .79 12 20. CABSqnre 78.51 16.96 .87 13 21. Vandqnre 76.69 18.67 .90 13 22. TVIC 9.91 2.32 .80 12 23. VVIQ 120.65 20.59 .95 32
_________________________________________________________________________________
Table 2
Correlations Between the Visual Imagery and Spatial Test Variables
_____________________________________________________________________________ Variables 1 2 3 4 5 6 7 8 9 10 _____________________________________________________________________________ 1. Finding A’s (.74)
2. Number Comparison .35 (.82) 3. Identical Pictures .30 .34 (.87) 4. Card Rotations .14 .14 .44 (.96)
5. Cube Comparisons .21 .08 .45 .58 (.80)
6. Spatial Relations .09 .09 .35 .77 .58 (.89)
7. Paper Form Board .14 .04 .39 .55 .50 .55 (.81)
8. Paper Folding .12 .01 .33 .46 .53 .50 .59 (.71)
9. Surface Development .19 .04 .21 .40 .49 .42 .55 .57 (.94)
10. Hidden Patterns .26 .18 .40 .37 .35 .30 .37 .26 .25 (.85) 11. Copying .22 .28 .49 .39 .26 .28 .40 .31 .31 .28 12. Gestalt Completion .13 .01 .14 .15 .15 .13 .22 .25 .32 .18 13. Concealed Words .31 .29 .23 .14 .16 .12 .31 .23 .33 .23 14. Snowy Pictures .15 .20 .21 .14 .17 .12 .14 .13 .09 .15 15. Shape Memory .16 .11 .26 .27 .29 .25 .22 .21 .21 .38 16. Building Memory .15 .16 .17 .14 .21 .12 .18 .17 .28 .26 17. Map Memory .16 .12 .19 .26 .24 .27 .20 .18 .24 .17 18. Emergent .17 .09 .25 .33 .30 .41 .40 .40 .39 .31 19. Transform .19 .10 .24 .34 .34 .39 .41 .40 .49 .36 20. CABSqnre .10 .11 .13 .31 .28 .31 .23 .21 .17 .24 21. Vandqnre .11 -.00 .06 .22 .28 .30 .20 .26 .30 .16
(table continues)
____________________________________________________________________________ Variables 1 2 3 4 5 6 7 8 9 10 _____________________________________________________________________________ 22. TVIC .17 .08 .20 .26 .22 .21 .18 .12 .17 .21 23. VVIQ .12 .07 .06 .15 .12 .14 .13 .13 .13 .14 _____________________________________________________________________________ _____________________________________________________________________________ Variables 11 12 13 14 15 16 17 18 19 20 _____________________________________________________________________________ 11. Copying (.90)
12. Gestalt Completion .20 (.85) 13. Concealed Words .26 .30 (.83)
14. Snowy Pictures .09 .21 .10 (.68)
15. Shape Memory .14 .15 .11 .12 (.68)
16. Building Memory .12 .18 .07 .21 .37 (.80)
17. Map Memory .17 .13 .17 .05 .32 .37 (.77)
18. Emergent .28 .26 .16 .17 .36 .28 .19 (.76)
19. Transform .19 .29 .30 .26 .26 .34 .30 .45 (.79)
20. CABSqnre .19 .22 .03 .05 .31 .16 .23 .32 .20 (.87) 21. Vandqnre .13 .17 .10 .03 .27 .23 .14 .36 .27 .63 22. TVIC .19 .12 .19 .13 .16 .11 .17 .17 .25 .37 23. VVIQ .09 .13 .04 -.04 .08 .09 .14 .12 .14 .47
_____________________________________________________________________________
Variables 21 22 23
_____________________________________________________________________________ 21. Vandqnre (.90)
22. TVIC .32 (.80)
23. VVIQ .34 .32 (.95)
[image:14.595.92.513.219.740.2]_____________________________________________________________________________ Note. p < .05, r = .14. p < .01, r = .18. Table 3 Pattern Matrix: Visual Imagery and Spatial Test Variables _________________________________________________________________ Variables F1 F2 F3 F4 F5 F6 ______________________________________________________________________________________ 1. P1 -.08 .09 .48 .11 .07 .05
2. P2 .02 .04 .64 -.12 .07 .03
3. P3 .34 .07 .55 -.02 .17 .23
4. SR1 .87 .06 .07 -.13 .03 .04
5. SR2 .61 .04 .05 .05 .10 .03
6. SR3 .87 .07 -.08 .04 -.02 .04
7. VZ1 .53 -.03 -.02 .36 -.05 .14
8. VZ2 .47 -.02 -.09 .41 -.03 .16
9. VZ3 .32 -.07 -.08 .63 -.13 -.08
10. CF2 .15 .02 .25 -.03 .25 .25
11. CF3 .23 .07 .39 .15 .13 .31
12. CS1 -.07 .10 .12 .42 .07 .12
13. CS2 -.04 -.02 .38 .47 -.08 .11
14. CS3 -.01 -.10 .16 .07 .19 .03
15. MV1 .03 .08 .02 -.10 .49 .23
16. MV2 .06 .04 .01 .05 .70 -.02
17. MV3 .16 .07 .04 .01 .43 -.17
18. Emergent .10 .16 -.02 .26 .22 .32
19. Transform .17 .01 -.04 .41 .37 -.05
(table continues) _________________________________________________________________ Variables F1 F2 F3 F4 F5 F6 ______________________________________________________________________________________ 20. CABSqnre .03 .86 -.01 -.12 .02 .22
21. Vandqnre -.01 .65 -.14 .12 .07 .10
22. TVIC .07 .38 .15 .03 .04 -.15
23. VVIQ -.01 .58 .05 .01 .02 -.08
Factor Correlation Matrix: F1 1.00
F2 .27 1.00
F3 .21 .09 1.00
F4 .32 .17 .22 1.00
F5 .27 .24 .25 .26 1.00
F6 .26 .05 .06 .13 .18 1.00 _________________________________________________________________
Figure Captions
Figure 1. An example item from the Emergent Forms task. Participants were required
to mentally synthesise the letter E with the letter P.
Figure 2. An example item from the Transformation task. Participants were required
to generate and manipulate an image of the letter Y and a small circle.
Figure 3. A two-dimensional CAB-S shape and a three-dimensional Vandenberg