A CASE CONTROL STUDY ON FACTORS
CONTRIBUTING TO OBESITY/OVERWEIGHT
AMONG SCHOOL CHILDREN AT SELECTED
SCHOOLS, KUMBAKONAM, THANJAVUR
DISTRICT.
BY 301317101
A DISSERTATION SUBMITTED TO THE TAMILNADU
Dr.M.G.R. MEDICAL UNIVERSITY, CHENNAI,
IN PARTIAL FULFILMENT OF THE REQUIREMENT
FOR THE AWARD OF THE DEGREE OF
MASTER OF SCIENCE IN NURSING
A CASE CONTROL STUDY ON FACTORS
CONTRIBUTING TO OBESITY/OVERWEIGHT
AMONG SCHOOL CHILDREN AT SELECTED
SCHOOLS, KUMBAKONAM, THANJAVUR DISTRICT.
BY 301317101
Research Advisor & Clinical Specialty Guide:
PROF.MRS.M.KAVIMANI, RN, RM, MN,Ph.d PRINCIPAL, HOD.PEDIATRICS NURSING SPMIHS,
PALAYAKOTTAI, TIRUPUR DIST.
SUBMITTED IN PARTIAL FULFILMENT OF THE
REQUIREMENT FOR THE AWARD OF THE DEGREE OF MASTER OF SCIENCE IN NURSING FROM THE TAMILNADU Dr.M.G.R. MEDICAL UNIVERSITY, CHENNAI.
DECLARATION
This is to certify that the dissertation entitled “A CASE CONTROL STUDY ON FACTORS CONTRIBUTING TO OBESITY/OVERWEIGHT
AMONG SCHOOL CHILDREN AT SELECTED SCHOOLS,
KUMBAKONAM, THANJAVUR DISTRICT” is a bonafide work done by Mrs.ANITHA.S, Shivparvathi Mandradiar Institute of Health Sciences, College of Nursing in partial fulfillment of the university rules and regulations for award of Master of Science in Nursing under my guidance and supervision during the year of October 2015.
Name & Signature of the Guide, HOD & Principal:
PROF.MRS.M.KAVIMANI, RN, RM, MN, Ph.d PRINCIPAL, HOD.PEDIATRICS NURSING SPMIHS,
DECLARATION
I hereby declare that the present dissertation titled, “A CASE
CONTROL STUDY ON FACTORS CONTRIBUTING TO
OBESITY/OVERWEIGHT AMONG SCHOOL CHILDREN AT SELECTED SCHOOLS, KUMBAKONAM, THANJAVUR DISTRICT” outcome of the original research work undertaken and carried out by me, under the guidance of Research guide Prof. Mrs. KAVIMANI, R.N, R.M, M.N, Principal, Shivparvathi Mandradiar Institute of Health Sciences, College of Nursing.
I hereby declare that the material of this has not found in anyway, the basis for the award of any degree/ diploma in this University or any other University.
By
CERTIFIED THAT THIS IS THE BONAFIDE WORK OF 301317101
AT THE SHIVPARVATHI MANDRADIAR INSTITUTE OF HEALTH SCIENCE, COLLEGE OF NURSING
SUBMITTED IN PARTIAL FULFILMENT OF THE
REQUIREMENT FOR THE AWARD OF THE DEGREE OF MASTER OF NURSING FROM THE TAMILNADU Dr.M.G.R. MEDICAL UNIVERSITY, CHENNAI.
Examiners:
1. _________________________
2. __________________________
ACKNOWLEDGEMENT
I praise and thank God Almighty for giving me the real treasure of
courage, endurance and abundant blessings throughout my career and personal life.
Apart from the effort of me, the success of my study comes from every soul who encouraged and guides me in all the aspects. I, the Investigator take the opportunity to express my gratitude to the successful completion of this project.
It is my privilege to remember and express my special thanks to Late
Mr.Shivakumar Mandradiar, Heartfelt thanks to Mr.Naveen Mandradiar,
Secretary, Mrs.Mano Mandradiar Correspondent, Mrs.Pallavi Mandradiar
Trustee, andMr.Balasubramanian, Manager, SPMIHS, Palayakottai, for their
constant encouragement and support to complete this study.
It is my privilege to owe my sincere indebtedness and humble regards to
I am deeply indebted toMs.Suganthi.M.Sc (N), Lecturer, SPMIHS and
Ms.Henis Rebina.M.Sc (N), Lecturer, SPMIHS, for their guidance and constant supervision as well as for providing necessary information regarding the project and also for their support in completing the project.
I owe my profound gratitude and exclusive thanks to the panel of
experts namelyDr.SambasivamMD (Pediatrics),Mrs.M.Kiruthika M.Sc(N),
Lecturer, St.Xavier College Of Nursing,Mrs.S.Rajeshwari,M.Sc(N), Reader,
Sacred heart College Of Nursing, Ms.K.Sangeetha M.Sc (N), Asst.professor,
Sacred heart college of Nursing, Ms.Suganthi M.Sc (N), Lecturer, SPMIHS
for validating the tool amidst their busy schedule and providing valuable suggestions.
I am indeed thankful toProf. Dr. Dhanapal, Bio-statistician, SPMIHS,
Palayakottai, for his guidance in carrying out the necessary statistical analysis and presentation of the data in the study.
Heartfelt thanks to all the teaching staff and non teaching staff of SPMIHS, for their contribution during my course of study.
A memorable note of gratitude toMs.Vanithalibrarian SPMIHS for the
I extend my warm and heartfelt thanks to all the participants, who have willingly shared their precious time during the process of data collection. Without their kind cooperation it is impossible for me to go ahead with this study.
Words are beyond expression for the meticulous ,I express my love and
gratitude to my beloved husband Mr.Francis Moses, sister in law
Mrs.Margretchandra, Mrs.Ranjaniprema, Ms.Rajakumari, Father
Mr.Srinivasan, Mother Mrs.vasuki, Father in law Mr.Rajappa, Mother in law Mrs.Gnanasundhari and my brotherMr.Balamuruganfor their endless love ,continuous support, inspiration and prayers throughout my course of the study and life.
I express my profound thanks to all my friendsMs.Sivagamasundari,
Mrs.JoshiTerencia, Ms Mugeshwari ,Ms.HenisRebina , MS.Dhanalakshmi
supporting me in many ways during the study and I thank all the well wishers for their unconditional love and support in every step of the project.
TABLE OF CONTENTS
CHAPTER
NO. CONTENTS
PAGE NO.
I INTRODUCTION
Background of the study 1
Need for the study 7
Statement of the Problem 11
Objectives of the Study 12
Hypothesis 12
Operational Definitions 13
Assumptions 16
Delimitations 16
Conceptual Frame work 17
II REVIEW OF LITERATURE
Studies related to prevalence of overweight/obesity 23
Studies related to factors contributing to
overweight/obesity 29
III METHODOLOGY
Research Approach 39
Settings 44
Population 45
Sample size 46
Sample 47
Sampling Technique 48
Sampling Criteria 48
Development of the tool 49
Description of the tool 49
Validity 51
Reliability 52
Pilot study 52
Data collection procedure 53
Plan for data analysis 55
Ethical consideration 56
IV DATA ANALYSIS AND INTERPRETATION
Data on demographic variables of the school children
in cases and controls. 58
Data on level of factors contributing to obesity among
school children in cases and controls. 65
Data on Comparison of factors contributing to obesity
among school children between cases and controls. 73
Data on association of level of factors contributing to
V SUMMARY, FINDINGS, DISCUSSION, IMPLICATIONS, RECOMMENDATIONS AND CONCLUSION
Summary 83
Findings 86
Discussion 88
Implications 92
Limitations 95
Recommendations 95
Conclusion 96
REFERENCES
Text Books 97
Journals 99
Electronic Sources 100
LIST OF TABLES
TABLE
NO. TITLE
PAGE NO.
1. Frequency and percentage distribution of
demographic variables of school children in the cases and controls.
58
2. Level of factors contributing to obesity among
school children in the cases.
65
3. Level of factors contributing to obesity among
school children in the controls.
68
4 Mean and standard deviation of factors score
contributing to obesity among school children in cases and controls.
71
5 Comparison of factors contributing to obesity
among school children between the cases and controls.
73
6 Association of level of factors contributing to
obesity among school children with their selected demographic variables in the cases
77
7 Data on association of level of factors
contributing to obesity among school children with their selected demographic variables in the controls
LIST OF FIGURES
FIG.
NO. TITLE
PAGE NO.
1. Conceptual framework 21
2. Research design 42
3. Percentage distribution of educational status of father
among school children
64
4. Percentage distribution of level of factors contributing
to obesity among school children in the cases group
67
5. Percentage distribution of level of factors contributing
to obesity among school children in the control group
[image:13.612.130.517.100.406.2]LIST OF APPENDICES
S.
NO CONTENT
PAGE NO.
1. Letter seeking permission to conduct the main study i
2. Letter requesting suggestion for establishing content
validity
ii
3. Content validity certificate iii
4. Letter granting permission iv
5. List of experts vi
6. Informed written consent form – English & Tamil vii
7. Tool-English ix
LIST OF ABBREVIATIONS
SHORT FORMS ABBREVIATION
SPMIHS
BMI
QI
Fig
H1
MSC (N)
N
No
P
Freq
%
2
SD
SPSS
Shivparvathi Mandradiar Institute of Health Sciences
Body mass index
Qutelet index
Figure
Research hypothesis
Master of science in nursing
Total number of samples
Number
Probability
Frequency
Percentage
Chi-square test
Standard deviation
[image:15.612.132.510.81.627.2]ABSTRACT
A Case Control study on factors contributing to obesity / overweight among school children at selected schools, Kumbakonam was done by 301317101 as a partial fulfillment of the requirement of the degree of Master of Science in Nursing at Shivparvathi Mandradiar Institute of Health Science, under the Tamil Nadu Dr. MGR Medical University, Chennai, - 2015.
OBJECTIVES
1. To determine the selected factors contributing to obesity among obese school children.
2. To find out the association between the selected factors contributing to obesity among cases and control groups.
3. To find out the association between the selected factors contributing obesity and demographic variables among cases and controls.
HYPOTHESIS
H1: There is a significant association between the selected factors
H2: There is a significant association between the selected
factors contributing to obesity and their demographic variables among school children in cases and controls.
The present study was aimed at determining the factors contributing to obesity among obese and non obese school children aged between 10-14 years.. The conceptual frame work was developed based upon three main issues, school age, background data of obese and normal school children. The conceptual frame work of the present study was based on web causation theory .
The data collection tool was validated by a pediatrician and four nursing experts. Reliability was established by test–retest method (r= 0.84).Pilot study was done at Sri Madha Matriculation Higher secondary school.The main study was conducted in selected 2 schools in kumbakonam namely St.Antony's Matriculation Hr.Sec.School and Sri Kumaraguruparar Matriculation Hr.Sec.School. The data collected were edited, tabulated, analyzed and interpreted by SPSS version .16. The findings revealed that The overall level of factors contributing to obesity among school children revealed that majority 30(60%) children had moderate level of contribution, 17(34%) children had high level of contribution and only 3(6%) children had low level
of contribution to obesity in the cases group. It was inferred that majority
CHAPTER – I
INTRODUCTION
"Children are the wealth of tomorrow,
Take care of them if you wish to
Have a strong India,
Ever ready to meet various challenges"
- Jawaharlal Nehru.
BACKGROUND OF THE STUDY
high in calories, making adolescents escapes obesity and ill health. Eating well, exercising regularly, encourage families to make healthful food choices is very important for school children.
Especially during the last few decades the prevalence rate of childhood over weight and obesity has reached epidemic proportions worldwide. Obese children face difficulties in their social life and run a substantially increased risk of becoming our future generation of obese, chronically diseased adolescents and adults.
Childhood obesity is a serious medical condition that affects the children and adolescents. It occurs when a child is well above the normal weight for his or her age and height. Childhood obesity is particularly troubling because the extra pounds often start children on the path to health problems that were once confined to adults such as diabetes, high blood pressure and high cholesterol. Childhood obesity can also leads to poor self esteem and depression.
Children learn a lot from school, environment and more from experience. Whether a child is a member of our family or not, it is our responsibility help the child to grow in a healthy way. Today's children are tomorrow's citizen. Good health is everyone's right. As parents, teachers and much more as care givers, we have great privilege and responsibility in
bringing up children with adequate knowledge and understanding.
Understanding about obesity causes, treatment and prevention is one of the best things that you can do for yourself. Over the course of last several decades, America has suffered from an increase in obesity due to variety of factor. With more people eating fast food regularly and not getting enough exercise, it’s no wonder that obesity has become a real epidemic.
A bad diet is not only thing that cause obesity. If you eat food that contains things like fructose corny syrup regularly you are putting your body at risk for obesity. In addition if you don't get enough exercise on regular basis, obesity may be in your future. There are some diseases like hypothyroidism that can impact your weight.
Obesity in general is defined as the presence of excess adipose tissue in the body to such a degree that it may lead to health hazard (Prentice et al. 2001; Rossner 2002). Obesity is not a single disorder but a heterogeneous group of conditions with multiple causes. Body weight is determined by an interaction between genetic, environmental, psychological factors acting through the physiological mediators of energy intake and expenditure. Even in India, malnutrition has attracted the focus of health workers, as childhood obesity was rarely observed. But over the fast few years, childhood obesity is increasingly being observed with the changing lifestyle of the family with increased purchasing power, increasing hours of inactivity, due to addiction television, videogames and computer which have replaced outdoor games and other social activities (singh and sharma 2010).
Many people today, especially young people, are now living a hectic and stressful lifestyle. Because they live this kind of life, they tend to eat comfort food to get rid of stress. Stress can make the person feel hungry even though just ate. Because of this, they will tend to eat more portions over the past two decades. Stress has increased in an alarming rate studies also found that along with increase of stress, obesity also followed closely.
The term obesity is derived from the Latin word "Obesus" which means having "eaten until fat". It is usually defined as an excess of body fat and is often seen as an imbalance between energy intake and expenditure. Obesity is a state in which there is generalized accumulation of excess fat in the body leading to the body weight more than 20% of the required weight where as overweight is a state in which there is generalized accumulation of excess fat in the body leading to the body weight of more than 10% of required weight.
Obesity is the consequence of a long term imbalance between energy
intake and energy expenditure determined by food intake, physical activity
possible. For establishing effective intervention, it is important to identify major determinants in the early stage of life.
Childhood obesity is a global phenomena affecting all socio-economic groups, irrespective of age, sex or ethnicity. Aetiopathogenesis of childhood obesity is multifactorial and includes genetic, neuroendocrine, metobolic, psychological, environmental and socio-cultural factors. The treatment of overweight and obesity requires a multidisciplinary, multi phase approach, which include dietary management, physical activity enhancement, restriction of sedentary behaviour, pharmacotheraphy and bariatric surgery.
NEED FOR THE STUDY
Obesity is among the easiest medical condition to recognize, but most difficult to treat.The health consequences of obesity will have considerable effect on future burden on health cost and services.
The prevalence of childhood obesity is increasing rapidly worldwide. It is associated with several risk factors for later heart disease and other chronic illness including hyper lipidaemia, hyper insulinaemia, hypertension and early atherosclerosis. There risk factors may operate through the association between child and adult obesity, but they may also act independently.
Worldwide it is estimated that more than 22 million children under five year old are obese or overweight, and more than 17 million of them are in developing countries. Each of the children are at increased risk of developing type 2 diabetes, say the World Health Organization and International Diabetes Federation.
nations. The prevalence has increased at an alarming rate. Globally in 2020 the number of overweight, under the age of five is estimated to be over 42 million. Close to 35 million of these are living in developing nations. Overweight as well as obesity are largely preventable .Therefore Prevention of childhood obesity needs high priority.
According to WHO, it is estimated that 300 million obese people
worldwide and the data from 79 developing countries and a number of industrialized countries suggest that about 22 million under five children are overweight. There is also evidence that this problem is increasing in the USA, the percentage of overweight children aged 5-14 years has doubled in the last 20 years from 15 % to 32%.
In India studies shown that there is 50% of the increase in prevalence of childhood obesity in two years with the highest incidence in boys.
Obesity rates are generally highest in communities with high levels of poverty and low levels of income. Low income communities are often undeserved to grocery stores and frequently have fewer places that are safe to play. A higher prevalence of obesity seen in urban areas in developing countries is associated with the change from rural to urban life style causing decreased levels of physical activity and increased intake of energy dense diet.
Many countries in South East Asia including India are going through an economic and nutrition transition. The nutrition transition is associated with a change in dietary habits, decreasing physical activity and rising prevalence of obesity. Obesity in children and adolescents is gradually becoming a major health problem in many developing countries, including India.
consumption in school snacks should be explored as interventional measure to prevent overweight and obesity in Cuenca school children.
Baby (2010), study results showed that there was a significant association between prevalence of obesity(overweight and educational status of
mother X2 =7.28 (2), family income X2 =14.35(2), family history of obesity
X2=26.1(2), area of residence X2=8.2(2) and age of onset of weaning X2=11.78(2) at 0.05 level of significance.
Bhatia et. al (2007), study shows that over all incidence of obesity in the study group was 3.4% with no significant difference between boys and girls. A significantly greater number of boys (15%) as compared to girls(10.2%)were overweight more than half of the adolescents in the study group, 57.2% of boys and 52.8% of girls, spent 4 hours / day viewing TV or sitting at the computer out of the total obese children significant percentage 82.3% were non vegetarian where as only8.8% of vegetarians and non vegetarians were obese. The prevalence of obesity and overweight was 3.4% and 12.7% respectively in affluent adolescent from Ludhiana.
Mozaffari et al.(2007), studies about the factors contributing to obesity in comparison of obese and non-obese school children and conducted that factors associated with obesity and age, more hours of TV watching, low physical activity and low level maternal education. The tendency towards a sedentary life style such as lack of physical activity and TV watching was evident in the study. The importance of education, especially maternal education, as a risk factor for childhood obesity.
In worldwide controversy is going on regarding childhood obesity. Obesity is reportedly increasing in India. The investigator had been seen many
overweight and obese children among all the income group peoples and
wonder about the causes of obesity among them.so the investigator impressed on the topic and interested to do this research in Kumbakonam as it was my native place.
STATEMENT OF THE PROBLEM
A Case control study on selected factors contributing to
OBJECTIVES
• To determine the selected factors contributing to overweight/obesity
among school children.
• To find out the association between the selected factors contributing to
overweight/obesity among cases and control groups.
• To find out the association between the selected factors contributing
overweight/obesity and demographic variables among cases and controls.
HYPOTHESIS
H1: There is a significant association between the selected factors
contributing to overweight /obesity among school children in cases and controls.
H2: There is a significant association between the selected
OPERATIONAL DEFINITIONS
OVERWEIGHT/OBESITY
The term overweight/obesity refers to when the BMI exceeds 25 and BMI between 18 to 24 was considered as normal. Body Mass Index was calculated by using Quetelet’s index.
QUETELET’S INDEX
Weight in kg
QI= –––––––––––––––
INTERPRETATION:
BMI RESULTS
less than 18.5 Underweight
18.5-24.9 Healthy
25-29.9 Overweight
more than 30 Obese
SCHOOL CHILDREN
SELECTED FACTORS CONTRIBUTING TO OBESITY
In the present study factors contributing to obesity refers to the elements
which cause the effect of becoming obese in children. In the present study
factors contributing to obesity includes Nutritional factors, Genetic
predisposition, Medical factors, Physical activity, Leisure activity and Psychological factors.
SELECTED BACKGROUND FACTORS
It refers those issues even which one thought influence the obesity such as age, sex, birth order, type of family, residential area, religion, education of father, education of mother, employment status of father, employment status of mother and economic status of the family.
CASES
CONTROLS
In this study control refers to school children who were without obese.
ASSUMPTION
i) Children cooperate with the investigator
ii) Children provide information about their true risk factors of obesity.
DELIMITATIONS
¾ Children who are present on the day of data collection
¾ Children studying in V to IX th Std or chosen for the study in the age
group of 10 to 14 years only.
¾ Children selected by non random method only.
¾ Measures only factors of obesity
CONCEPTUAL FRAMEWORK
The conceptual frame work is on organized phenomena which deals with the concepts that are assembled by virtue of their relevance to a common theme. Conceptual schemes use concepts as building blocks. Conceptual frame work can serve to guide research which will further support theory development. The conceptual models attempt to represent reality with its minimal use of words.
The conceptual framework is based on Web of Causation Theory.
The web of causation considers all the predisposing factors of any type and their complex inter relationship with each other. The basic tenet of epidemiology is to study the clusters of causes and combination of effects and how they are related to each other.
SCHOOL CHILDREN
In this study school children refers to male and female children between 10-14 years of age studying in selected schools at Kumbakonam and who were available during data collection.
The following characteristics of school children were measured such as Age, Sex, Order of the child, Type of family, Residential area, Religion, Education of father, Education of mother, employment status of mother, employment status of father and Economic status of the family.
SELECTED CONTRIBUTING FACTORS
It referred as causative or influencing issues related to obesity. The presence or absence was measured. The factors considered were,
2. Physical Activity involving bodily contact or activity. Such as
playing indoor games, outdoor games and regular time duration of
playing.
3. Leisure Activity refers spend more time for relaxation such as viewing television, playing video games for more than 2 hours / day.
4. Nutritional Factors refers to the process of taking in and absorbing nutrient .In this study it referred to often taking fast food, milk products like creams, condensed milk, sugary items, deep fried foods and non vegetarian.
5. Medical factors refers to any illness of child because of that illness the child took medication which cause overweight in the children.
6. Psychological factors refers on stress can make the person to feel hungry even though just ate. Because of this reason, they will tend to eat more portions. In this study it referred to satisfaction level and stress.
OBESITY
25. BMI between 18-24 were considered to be normal. The children were screened for height and weight then they were classified as obese or non obese children based on BMI.
QUETELET INDEX:
Weight (Kg) QI =–––––––––––––
Height (m2)
INTERPRETATION OF RESULTS
BMI less than 18.5 Underweight
BMI 18.5-24.9 Healthy
CHAPTER-II
REVIEW OF LITERATURE
Polit (2012) states that literature review is a critical summary of research on a topic of interest, often prepared to put a research problem in context. Review of relevant literature serves as an essential background for any research. Critical examination of previous studies will help researcher to formulate and delimit the problem, to minimize the possibility of research, to suggest theoretical framework for the study, to learn from the reported experience of others about its feasibility to critically evaluate the various methods used by others and choose the most appropriate design for the investigation.
Research and literature were received and organized under the following headings.
• Studies related to prevalence of overweight/ obesity
1) Studies related to prevalence of overweight/ obesity
Lianping (2014)conducted a cross sectional study to collect the routine health screening data for primary school children in Wannan area, China. Overweight and obesity status were determined using the International Obesity Task Force standard (IOTF) BMI cutoff points. A total of 67956 subjects (36664 male and 31292 female) aged 514 years were recruited in this study. Depending on the references used (IOTF), the overall prevalence of overweight, including obesity of the subjects was 17.85% , the prevalence of overweight, including obesity was 22.9% in male subjects and 11.9% in female subjects, respectively. The overall prevalence of obesity was3.7%, the prevalence of obesity was 5.2 % in male subjects and 1.8% in female subjects, respectively. An interesting observation made was that the prevalence of overweight was high in male subjects.
Andrew Rundle (2012)conducted cross-sectional analyses of data from 624,204 public school children (kindergarten through 12th grade) who took part in the 2007–2008 New York City Fitness Program. The overall prevalence of obesity was 20.3%, and the prevalence of overweight was 17.6%. In multivariate models, the odds of being obese as compared with normal weight were higher for boys versus girls (odds ratio (OR) = 1.39, 95% confidence interval (CI): 1.36, 1.42), for black (OR = 1.11, 95% CI: 1.07, 1.15) and Hispanic (OR = 1.48, 95% CI: 1.43, 1.53) children as compared with white children, for children receiving reduced-price (OR = 1.17, 95% CI: 1.13, 1.21) or free (OR = 1.12, 95% CI: 1.09, 1.15) school lunches as compared with those paying full price, and for US-born students (OR = 1.54, 95% CI: 1.50, 1.58) as compared with foreign-born students. After adjustment for individual-level factors, obesity was associated with the percentage of students who were US-born (across interquartile range (75th percentile vs. 25th), OR = 1.10, 95% CI: 1.07, 1.14) and the percentage of students who received free or reduced-price lunches (across interquartile range, OR = 1.13, 95% CI: 1.10, 1.18).
Taheri (2012) conducted a cross sectional study on 1541 elementary school children, i.e. 851girls and 690 boys, selected from Birjand elementary schools through multiplecluster sampling in 2012. In order to determine overweight and obesity the percentile of CDC was used, so that, 859 5th percentile were taken as overweight and >95th percentile was defined as obese with respect to age and sex. For determination of central obesity, waist
circumference and the WK SHUFHQWLOH ZHUHXVHG UHJDUGLQJ DJH DQGVH[ 7KH
obtained data was analyzed by means of SPSS software (V: 15) using t and chisquare statistical tests at the 0.05 significant level. Out of the studied children, 9.6% (11% of boys and 8.3% of girls) were overweight and 9.2% of children (i.e. 10.9% of boys and 7.9% of girls) were obese. About 15.7% of children (i.e. 20.3% of boys and 12% of girls) had central obesity.
Lee PY (2012)conducted a cross-sectional study involving 311 children aged 11-13 years from primary schools in Kuching, Sarawak. Self-esteem and health related quality of life (HRQOL) was measured using the Lawrence Self-esteem Questionnaire (LAWSEQ) questionnaire and the Paediatric Quality of Life Inventory (PedsQL), respectively. Body weight and height were taken and body mass index for age calculated. The prevalence of overweight and obesity among the children were 18.2% and 15.2% respectively. Parent-proxy and child self-reported PedsQL scores were higher for normal weight children compared to thin and obese children, but lower than overweight children. At the subscale level, only parent-proxy PedsQL scores in psychosocial health and emotional component were significantly different between overweight and
obese children (p=0.019, p=0.02). The Self-esteem score was significantly
group. Overweight and obesity did affect quality of life and self-esteem of children in this study, particularly in the areas of psychosocial and emotional health.
Mahejan PB (2011)childhood obesity among school children in Union Territory conducted a study to assess the prevalence of obesity and overweight among school children in Puducherry with an objective to identify any variation as per age, gender, place of residence and type of school. Secondary data analysis of school based cross sectional study in all the four regions of Puducherry. Children between 6 and 12 were sampled with multistage random
sampling with population proportionate to size from 30 clusters.
Anthropometric data BMI was analyzed using CDC growth charts. Data was analyzed using SPSS, BMI (CDC) Calculator, CI Calculator and OR calculation. The prevalence of overweight among children was 4.41% and prevalence of obesity was 2.12 % mahe region had the higher prevalence of overweight and obesity female children from private schools and Urban areas were at high risk of being overweight and obese. Childhood obesity is a problem in Puducherry and requires timely intervention for its control.
Univariate analysis was performed first to compare the distribution of risk factors between cases and controls. Conditional logistic regression analysis was used to assess independent risk factors of obesity. The results showed that the overall prevalence of obesity among school-aged children was 4.11% (4.63% for males and 3.57% for females). A total of 516 subjects (258 pairs of cases and controls) were included in the final analysis. High maternal education and a longer sleeping time were shown to be protective factors against obesity (odds ratio [OR] 0.148, 95% confidence interval [CI] 0.074–0.296 and OR 0.472, 95% CI 0.342–0.652, respectively). Whereas family history of diabetes (OR 5.498, 95% CI 2.606–11.600), parental overweight (OR 3.720, 95% CI 2.068–6.689), and watching television, playing video games, and using computers (OR 1.564, 95% CI 1.133–2.159) were associated with a higher obesity risk.
Geraldinemoreno (2011) conducted a study to assess the Prevalence and Prediction of Overweight and Obesity Among Elementary School Students Height and weight measurements were collected on 2317 elementary school children in 1 school district. BMI was calculated using the Centers for Disease Control and Prevention’s NutStat program. Child characteristics included gender, age, eligibility for free and reduced lunch (proxy for socioeconomic status [SES]), school, grade, and ethnicity/race. Children were grouped into 2
BMI categories, <85th percentile or WK SHUFHQWLOH RYHUZHLJKWREHVLW\
Logistic regression was used to examine potential predictors of
overweight/obesity. Prevalence ofWKSHUFHQWLOHZDV
36.4%, 37.1%, and 44.5% for K-5, respectively. Prevalence ofWKSHUFHQWLOH
was highest among Hispanic children. Ethnicity was the strongest predictor of
Amanuel Kidane Andegiorgish (2011) the prevalence and determinants of overweight and obesity among school children and adolescents (7–18 years), a cross-sectional study was conducted in Tianjin City of Northeast China. The prevalence of overweight and obesity was found to be 12.5% and 15.7%, respectively. Logistic regression analysis (overweight compared with normal weight) showed that, overweight in children was
significantly associated with male gender, parental obesity, parental
educational level, mother’s history of gestational diabetes, high birth weight, less hours of physical activity per day, urban residence, motorized transportation, and eating food not prepared at home. After adjusting for parental obesity, the odds ratio of overweight children was increased by urban residence (rural as a reference, 2.68, 2.16–3.32), positive gestational diabetes (2.76, 1.37–4.50), and fast-food/restaurant food service (2.03, 1.34–3.07). Children who walked to school and participated in outdoor activities were 54% and 63% less likely to be overweight respectively.
2. Studies related to factors of overweight/ obesity
Jigna Samir (2014) conducted a study to assess the prevalence of overweight and obesity and to determine their associated factors among school children aged 10-12 years in Mehsana district in India. A single centric epidemiological study was conducted among 200 school children selected at random in Mehsana district school in the period from July 2011 to September 2011. Overweight and obesity were assessed using height, weight, waist circumference and hip circumference of each student in the class. A predesigned and pretested questionnaire was used to interview the students to elicit the information on family characteristics such as number of family members, education and occupation of parents, their usual physical activity, habit of watching TV and time spent with computer and for sleeping as well as the pattern of dietary intake. Significant difference in body mass index for boys (P < 0.0010) as well as girls (P < 0.0123) was observed in all the three underweight, overweight and obese groups when compared to the normal group. Risk of overweight and obesity was significantly higher in children who spent time in television viewing and/or with computer.
of India and globally. The study also showed that the socio-economic factor like income of the family, family system, residential area and birth order of the child are positively associated with prevalence of obesity. In short the study showed that life style pattern like family history, minimum physical activity, snacking during screen time, dining outside very frequently and sleep pattern of child contribute to childhood obesity. Dietary habits like frequent consumption of deep fat fried fleshy foods, fast food consumption and self drink consumption plays a vital role in increasing the number of obese children.
Michiyo Yamekarva (2013) conducted a study to examine the association of breastfeeding with overweight and obesity among school children in Japan. A nationwide longitudinal survey on going from 2001-2009 all over Japan. A total of 43,367 singleton children who were born after 37 gestational weeks and had information on their feeding during infantly. In multinomial logistic regression models with adjustment for children's factors and maternal factors exclusive breast feeding at 6-7 months of age was
associated with decreased risk of overweight and obesity compared with
formula feeding. The adjusted 0dds ratios were 0.85 and 0.55 for overweight and obesity respectively. Breastfeeding is associated with decreased risk of overweight and obesity among school children in Japan.
obesity were 26% and 10.6% respectively. There were no difference between sexes but the prevalence of overweight and obesity was 1.5 to 2 fold higher is 9 year old then in 6 year old children. Multivariate models demonstrated that higher BMI were significantly related to low physical activity and non poverty. Eating breakfast and eating more than 3 meal /day were not related to prevalence of overweight and obesity. The high prevalence of overweight and obesity in school children was associated with insufficient physical activity and non poverty promoting physical activity and fruit consumption in school snacks should be explored as intervention measures to prevent overweight and obesity in cuenca school children.
Premalata Prakash (2013) conducted a non experimental study on obesity among children in Punjab to assess the parental role and identify the deficit area among children leading to obesity and to prepare the guidelines for the parents regarding promotion of health of their children. The study population consisted of parents of the children aged 9-17 years studying in the 6 to 10+2 of C.F.C Public school at Ludhiana Punjab .Samples were selected
by purposive sampling method. Data were collected by structured
Julice (2012) conducted a comparative study to assess the eating behavior among obese and non obese children in selected schools at Ernakulum, Kerala. 200 school children (100 obese and 100 non obese) were selected by purposive non proportionate quota sampling method. Body Mass index was calculated by quetlet Index. Children in the age group of 11-14 years were included in the study. A semi structured questionnaire was used to assess the eating behavior of the children. The reliability of the tool was r=0.91.The study findings showed that the obtained t value was significantly different in eating behavior among obese and non obese school children. Thus it concluded that parents and children should be made aware through health education .Mass media about healthy eating behavior and encouraging in modifying the eating behavior.
Shehab A Alenazi (2012) conducted a cross sectional study to assess the prevalence of overweight and obesity among 523 male adolescent students who were randomly selected from different schools in Arar, a city formed of about 240000 inhabitants and lying in the northern borders region of KSA. This study was conducted over a two month period (March and April 2012). Determine the prevalence of overweight and obesity among male adolescents in Arar city,Saudi Arabia (KSA).They estimated the future risk of developing
cardiovascular diseases in this ageǦgroup. Questionnaire and anthropometric
Sasikala Javdhi (2012) conducteda study among the 9-14 age group in Kerala at the Achutha Menon centre for health sciences to find out the relationship of child obesity to parental and sibling obesity. It revealed the obesity in children was found to be clearly linked to parental and sibling obesity the father of 10.9% children and the mother of 13% children were obese. Obesity among children in private unaided schools was 7.2% while in Government schools it was 4.9%.
Pavaneh Reza Sottari (2012)conducted case control study to assess the obesity related factors in school children in Rasht, Iran case control study was performed in 8 primary schools of Rasht. A cluster sampling method was used
to select 320 students including 80 in case (BMI WK percentile for age and
gender) and 240 in control group (BMI = 5th to 85th percentile for age and gender). Date were collected by a scale, tape meter and a form which consisted of obesity related factors and analyzed by chi-square, Mann-whiteney and step wise multivariate regression tests in SPSS 19. Findings showed that the mean and standard deviation of birth weight in case and control groups were 3671±5.64 and 190± 5.46, respectively (P=0.000) 82.5% of case and 92.9% of control group had exclusive breast feeding for 4-6 months(P=0.024). Also multivariate regression analysis indicated birth weight, age, exclusive breast feeding and frequency of meals have significant effects on body mass index.
out of 125 boys 26.4% were found to be obese and the rest 73.6% were within normal limits out of 75 girls 18.6% were found to be obese and the rest 81.3% were found to be within normal limits. There is a definite association between child hood obesity and TV watching habits of children.
Warden and warden (2011) identified 15 chromosomal loci linked to weight, body fat and other obesity related traits in humans. They state that seven genes have been identified as causing obesity in human and that in most cases, obesity results from interactions between multiple genes, not the action of single gene. In exceptional case, mutaitons of the leptin gene and its receptors of mutation of melanocortin receptor have been described. There obesity genes encode proteins that are strongly connie as part of the loop regulating food intake. They all involve the leptin axis and one of its hypothalamic targets. Thus successful leptin protein replacement in a leptin deficient child may have potential reduction of obesity.
James (2009) conducted a clustered randamized controlled trial to investigate a education based intervention to discourage the consumption of carbonated beverages and encourage fruit intake and consumption of water in United Kingdom. 6 Years children were radmomized by class (N=19; 14 control and 15 intervention) in six schools. Children were aged between 7-11 years and had a mean body mass index BMI of 17.6 in the control classes and 17.4 in the intervention classes. At baseline, the prevalence of obesity was boys: controls (n=155) 10% and intervention (n=169) 11% girls: controls (n=164)12% and intervention (n=156) 10%. The intervention evaluated the effect of reducing carbonated drink consumption in children. The serious promoted drinking water or diluted fruit juice, tasting fruit and the children were encouraged to access the project website. Control program was not described on assessment at 12 months, changes in BMI Z scores were not significantly different between intervention and control classes mean Z score 0.7 versus mean Z score 0.8 respectively. The prevalence of obesity at follow up was boys controls 12% and intervention 9%. There was a reduction is self reported soft drink consumption over 3 days in increase of 0.2 glasses in control group.
Kamatchi(2009) conducted a comparative study on obesity among obese and non obese school children in selected schools, Trichy in march 2009. A sample size was 150 school children. The subjects were 11 to 13 years of age and the total 150 school children 30 obese male, 30 0bese female and 45 non obese male and 45 non obese female by the purposive quota sampling. Semi structured questionnaire were used to collect information
regarding determinants of obesity. The result showed that genetic
school children (p<0.005).There was no association between determinants of obesity with selected background factors of obese and non obese school children (p>0.05).
CHAPTER -III
METHODOLOGY
Methodology is a significant part of any research which enables the researcher to organize the procedure of collecting reliable data for the problem under study or investigation. This chapter deals with the description of methodology and the various steps adopted to collect and organize data for the study.
According to Polit and Beck (2004) research methods are the
techniques used by researcher to structure a study to gather and analyze information relevant to research question.
According to Dempsey (1999) research methodology defines the way
technique, sampling criteria, development of the tool, description of the tool, validity, reliability, pilot study, data collection procedure, plan for analysis and ethical consideration.
RESEARCH APPROACH
According toSuresh K. Sharma (2011)the research approach involves
the description of the plan to investigate the phenomenon under study in a quantitative, qualitative or a combination of the two methods. Furthermore, it helps to decide whether the presence or absence as well as manipulation and control over variables. Also, it helps to identify the presence or absence of and comparison between groups.
When the association between two factors is strong and consistent a case control study can be used. If the association is biological in nature and specific in the available time, a retrospective study can be done.
direction from known outcome to the exposure factors which are thought to be the cause. Two groups were studied: the case group is one who had the selected factors of obese among school children. The control group is one in which the school children were free from selected factors of obesity. The selected factors of obese were assessed retrospectively.
RESEARCH DESIGN
According to Nancy Burns, the research design is a blue print for
conducting a study that maximizes control over factors that could interfere with the validity of the findings.
According to thePolit (2012)stated that an investigators overall plan for
After considering the factors related to the selected problem which was retrospective in nature, the investigator has selected the “case control design” as suitable for this study. There are four basic steps in conducting a case controls study, selection of cases and controls, matching, measurements of exposure and analysis and interpretation.
Target Population
School Children between 10 to 14 years of age
Accessible Population
School children of 10 to 14 years age with and without obesity in Selected private Schools at Kumbakonam.
Screening for Obesity 1.BMI
Sampling Technique
Purposive Sampling
Sample and Sample Size
School Children with and without obesity
Cases 50 School Children with obestiy Data Collection Semi structured questionnaire Variables Age Sex
Birth order
Family Type
Residential area Religion Educational Status of Father Educational Status of Mother Occupation of Father Occupation of Mother Economic status Controls 50 School children without obesity Findings
REPORTING / THESIS
Data Analysis/Interpretation
CRITERION MEASURES
[image:60.612.58.565.66.675.2]VARIABLES
Variables are attributes that vary or differ among the persons or objects being studied. The variables measured in this study were as follows.
Dependent Variable
Dependent variable in a mathematical equation or relationship between two or more variables, a variable whose value depends on those of others; it represents a response, behavior, or outcome that the researcher wishes to predict or explain.
Attribute Variable
Attribute variable is a mathematical process used to analyze the characteristics of a given population of subjects.
The attribute variable in this study were selected factors including demographic as Age, Sex, Order of the child, Type of family, Residential area, religion, Education of father and mother, Employment status of father and mother, Economic status of family. The other selected factors were Nutritional, Genetic predisposition, Medical, Physical, Leisure activity and Psychological.
SETTING
According to Polit and Beck (2012) setting is the more specific places
The setting for the study was selected school at Kumbakonam. Two schools namely St.Antony's Matriculation Higher Secondary School and Sri.Kumaraguruparar Matriculation Higher Secondary School.
POPULATION
According to Suresh K. Sharma (2011)population is the entire set of
individuals or objects having some common characteristics selected for a research study. There are two types of population target population and accessible population.
TARGET POPULATION
ACCESSIBLE POPULATION
The accessible population is the population of subject available for a particular study from whom the study samples are selected. The accessible populations selected for this study were obese and normal school children in selected private schools at Kumbakonam.
SAMPLE SIZE
SAMPLE
The sample for the present study includes 100 school children inclusive of 30 obese male and 20 obese female and 23 normal male and 27 normal female. The sample size was arbitrarily decided to 50 cases and 50 controls. Large samples give better results.
Age Cases Control
Female Male Female Male
10 to 11 yrs 5 6 6 5
11 to 12 yrs 5 8 7 6
12 to 13 yrs 5 8 7 6
SAMPLING TECHNIQUE
According to Talbot (1995) “sampling” is the process of selection of
portion of population to obtain the data about problems which represents entire population.
In present study, purposive sampling technique was used to select cases and controls for study.
After screening the school children, the cases and controls were allotted based on BMI
SAMPLING CRITERIA
Inclusion Criteria
• School children who had body mass index more than 25 (Obese).
• In the age of 10-14 years.
• From both sex.
• Who are available in selected schools at Kumbakonam.
Exclusion Criteria
• School children suffering from psychiatric illness.
• Who had suffered from any illness for the past one month.
• Children who had attended any teaching programme on obesity and
obesity related factors.
DEVELOPMENT OF THE TOOL
The tool is a written device that a researcher assess to collect the data. The tool was developed by using the information obtained from literature review. The questionnaire was formulated on the basis of selected background factors and also contributing factors of overweight/obesity. Simplicity of language, organization and clarity of items are few factors kept in mind while preparing the tool. The tool was drafted in English.
DESCRIPTION OF THE TOOL
The tool used for the research study was a semi structured questionnaire.
The tool consisted of two sections:
Section 1: Background data of school children.
Section 2: Selected contributing factors of obesity.
Section 1: Selected Background factors of school children
It consisted of 11 questions seeking information on the selected background data of obese and normal school children. the item included Age, Sex, Order of the child, Type of family, Residential area, Religion, Education of father and mother, Employment status of father and mother and Economic status of family.
Section 2: Selected contributing Factors of obesity.
This section sought information regarding factors of obesity.
It consisted of six factors namely Nutritional, Genetic
1. Nutritional factor - 13 (1, 2, 3, 4, 5, 6, 7, 8, 9, 10, 11, 12, 13)
2. Genetic Predisposition factor-3(14, 15, 16)
3. Medical factors-2(17, 18)
4. Physical factors-4(19, 20, 21, 22)
5. Leisure activity - 4(23, 24, 25, 26)
6. Psychological Factor-4(27, 28, 29, 30)
VALIDITY OF THE TOOL
Validity of the tool refers to the degree to which the test or other measuring device is truly measuring what it is indented to measure. The important aspect in assessing an instrument is content validity, criteria validity and construction validity.
RELIABILITY OF THE TOOL
Polit and Hungler define reliability as the degree of consistency or accuracy with which an instrument measures the attribute it is designed to measure. The test-retest method was used to establish reliability for Tamil and English questionnaire. Among 10 school children the questionnaire were administered. The coefficient of correlation for Tamil questionnaire was r=0.84 and English questionnaire was r=0.81 high. Therefore semi structured questionnaire was found to be reliable.
PILOT STUDY
According to Polit and Beck, Pilot study is a small scale version or a
The pilot study was conducted among 5 obese and 5 normal children who fulfilled the sample criteria of sample selection and after obtained an written consent from each children's parent, the semi structured questionnaire was administered to child and data was collected. Feasibility of conducting the study was ascertained with regard to men, money and material. Data had to be collected in three faces namely, introductory phase, action phase and termination phase.
DATA COLLECTION PROCEDURE
Talbot (1995) defined that data collection is gathering of information from sampling unit. The study was planned for four weeks in the month of June 2015. Prior permission from concerned authority was sought and obtained. The objectives and purpose of the study were explained and confidentiality was assured.
PHASE I: SCREENING PHASE
Data were collected for four weeks in the month of June 2015 prior permission from authority was obtained.
Screening for obesity was done for school children. Weight was checked
by weighing machine and height was checked by Stature measure. Body
mass index was calculated based on height and weight. Then children were selected for the study on quota basis. To assess each child, it took 10 to 15 minutes.
PHASE II: DATA COLLECTION PHASE
PHASE III: TERMINATION PHASE
The tool was verified for completion. The children were assured about the confidentiality of the data. This phase lasted for a period of 5 minutes per school age child..
PLAN FOR DATA ANALYSIS
Data analysis is the systematic organization and synthesis of research data and testing of the research hypothesis using the data.
The data collected from the subjects were compiled and analyzed using descriptive and inferential statistics.
The following plan of analysis was developed
• Data on demographic variables among cases and control.
• Data on association between the selected contributing factors among
cases and control group.
• Data on association between the selected factors and demographic
ETHICAL CONSIDERATION
CHAPTER – IV
DATA ANALYSIS AND INTERPRETATION
This chapter deals with the analysis and interpretation of the data collected from 100 school children (50 Cases and 50 Controls) at selected schools, Kumbakonam, Thanjavur District. The data collected was organized, tabulated and analyzed according to the objectives. The findings based on the descriptive and inferential statistical analysis are presented under the following sections.
ORGANIZATION OF DATA
Section A: Data on demographic variables of the school children in cases and controls.
Section B: Data on level of factors contributing to obesity among school children in cases and controls.
Section C: Data on Comparison of factors contributing to obesity among school children between cases and controls.
SECTION A: DATA ON DEMOGRAPHIC VARIABLES OF THE SCHOOL CHILDREN IN CASES AND CONTROLS.
Table 1: Frequency and percentage distribution of demographic variables of school children in the cases and controls.
N = 100 (50+50)
Demographic Variables Cases (50) Controls (50)
No. % No. %
Age in years
10 - 11 yrs 6 12.0 12 24.0
11 - 12 yrs 17 34.0 11 22.0
12 - 13 yrs 9 18.0 12 24.0
13 - 14 yrs 18 36.0 15 30.0
Sex of the child
Male 30 60.0 23 46.0
Female 20 40.0 27 54.0
Birth order of the child
First child 25 50.0 19 38.0
Second child 23 46.0 25 50.0
Third child and above 2 4.0 6 12.0
Type of family
Demographic Variables Cases (50) Controls (50)
No. % No. %
Extended 2 4.0 5 10.0
Residential area
Urban 19 38.0 20 40.0
Rural 31 62.0 30 60.0
Religion
Hindu 31 62.0 40 80.0
Muslim 8 16.0 7 14.0
Christian 9 18.0 3 6.0
Others 2 4.0 0 0.0
Educational status of father
Illiterate 10 20.0 3 6.0
Primary schooling 15 30.0 17 34.0
Higher secondary school 21 42.0 20 40.0
Degree and above 4 8.0 10 20.0
Educational status of mother
Illiterate 7 14.0 3 6.0
Primary schooling 16 32.0 16 32.0
Higher secondary school 20 40.0 25 50.0
Degree and above 7 14.0 6 12.0
Employment status of father
Employed 16 32.0 24 48.0
Unemployed 8 16.0 6 12.0
Self employed 21 42.0 13 26.0
Coolie 5 10.0 7 14.0
Employment status of mother
Demographic Variables Cases (50) Controls (50)
No. % No. %
Self employed 4 8.0 10 20.0
Coolie 4 8.0 2 4.0
Economic status
Low income 8 16.0 11 22.0
Middle income 30 60.0 32 64.0
[image:78.612.121.525.80.255.2]Upper income 12 24.0 7 14.0
Table 1 shows the frequency and percentage distribution of demographic variables of school children in the cases and controls.
Regarding age, among cases majority 18(36%) were in 13 to 14 years
of age, 17(34%) were in 11 to 12 years of age, 9(18%) were in 12 to13 years of age and the least 6(12%) were 10 to 11 years of age, and in controls majority 15(30%) were in 13 to 14 years of age, 12(24%) were in 10 to 11 years of age and in 12 to 13 years of age, least 11(22%) were in 11 to 12 years of age.
Regarding sex, among cases majority 30(60%) were in males, 20(40%)
Regarding birth order of the child, among cases majority 25(50%) were first child, 23(46%) were second child and the least 2(4%) were third child, and in control majority 25(50%) were second child, 19(38%) were first child and the least 6(12%) were third child.
Regarding type of family, among cases majority 26(52%) were in
nuclear family, 22(44%) were in joint family and the least 2(4%) were in extended family, and in controls majority 30(60%) were in nuclear family, 15(30%) were in joint family and the least 5(10%) were in extended family.
Regarding residential area, among cases majority 31(62%) were in
rural areas and least 19(38%) were in urban areas, and in controls majority 30(60%) were in rural areas and the least 20(40%) were in urban areas.
Regardingreligion, among cases majority 31(62%) were Hindus, 9(18%)
Regarding education status of father, among cases majority 21(42%) were higher secondary education, 15(30%) were in primary education, 10(20%) were illiterate and least 4(8%) were in degree and above and in controls majority 20(40%) were in higher secondary education, 34(17%) were in primary education, 10 (20%) were in degree and above and least 3 (6%) were illiterate.
Regardingeducation status of mother, among cases majority 20(40%)
were in higher secondary education, 16(32%) were in primary education, 7(14%) were illiterate and least 7(14%) were in degree and above and in controls majority 25(50%) were in higher secondary education, 32(16%) were in primary education, 6(12%) were in degree and above and least 6 (12%) were illiterate.
Regarding employment status of father, among cases majority
21(42%) were self employed, 16(32%) were employed, 8(16%) were unemployed and least 5(10%) were coolie and in controls majority 24(48%) were employed, 13(26%) were self employed, 7(14%) were coolie and least 6 (12%) were unemployed.
Regarding employment status of mother, among cases majority
30(60%) were unemployed, 12(24%) were employed and least 4(8%) were self employed and coolie least 5(10%) were coolie and in controls majority
27(54%) were unemployed, 11(22%) were employed, 20(10%) were self
Regarding economic status, among cases majority, 30(60%) were in middle income, 12(24%) were in upper income and least 8(16%) were in low income divorced or separated, and in control majority 32(64%) were in middle income,11(22%) were in low income and least 7(14%) were in upper income.
It was inferred that among cases majority 18(36%) were in the age group of 13 – 14 yrs, 30(60%) were male, 25(50%) were first born child, 26(52%) belonged to nuclear family, 31(62%) were from rural area, 31(62%) were Hindus, 21(42%) of fathers were educated up to higher secondary school, 20(40%) of mothers were educated up to higher secondary school, 21(42%) of fathers were self employed, 30(60%) of mothers were unemployed and 30(60%) belonged to middle income group.
Fig.3 Percentage distribution of educational status of father among school children
It was inferred that education status of father, among cases majority
21(42%) were higher secondary education, 15(30%) were in primary
education, 10(20%) were illiterate and least 4(8%) were in degree and above and in controls majority 20(40%) were in higher secondary education,34(17%) were in primary education, 10 (20%) were in degree and above and least 3 (6%) were illiterate.
0 5 10 15 20 25 30 35 40 45
Illiterate Primary schooling Higher secondary school
Degree and above 20 30 42 8 6 34 40 20 Pe rc e n ta g e
Educational status of father
SECTION B: DATA ON LEVEL OF FACTORS CONTRIBUTING TO OBESITY AMONG SCHOOL CHILDREN IN CASES AND CONTROLS.
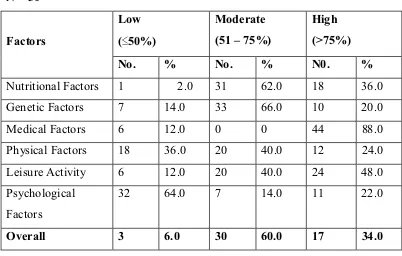
Table 2: Data on level of factors contributing to obesity among school children in the cases.
N = 50
Factors
Low (҅50%)
Moderate (51 – 75%)
High (>75%)
No. % No. % N0. %
Nutritional Factors 1 2.0 31 62.0 18 36.0
Genetic Factors 7 14.0 33 66.0 10 20.0
Medical Factors 6 12.0 0 0 44 88.0
Physical Factors 18 36.0 20 40.0 12 24.0
Leisure Activity 6 12.0 20 40.0 24 48.0
Psychological Factors
32 64.0 7 14.0 11 22.0
[image:83.612.121.523.281.537.2]Overall 3 6.0 30 60.0 17 34.0
Table 2: Shows the level of factors contributing to obesity among school children in the cases.
Regarding genetic factors, majority 33(66%) had moderate level of contribution to obesity, 10(20%) had high level of contribution and 7(14%) had low level of contribution to obesity among school children.
Regarding medical factors, majority 44(88%) had high level of contribution to obesity and 6(12%) had low level of contribution to obesity among school children.
Regarding physical factors, majority 20(40%) had moderate level of contribution, 18(36%) had low level of contribution to obesity and 12(24%) had high level of contribution to obesity among school children.
Regarding leisure activity revealed that, majority 24(48%) had high level of contribution, 20(40%) had medium level of contribution and 6(12%) had low level of contribution to obesity.
Regarding psychological factor revealed that, majority 32(64%) had low level of contribution, 11(22%) had high level of contribution and 7(14%) had medium level of contribution to obesity among school children.
Table 3: Data on level of factors contributing to obesity among school children in the controls.
N = 50
Factors
Low (҅50%)
Moderate (51 – 75%)
High (>75%)
No. % No. % N0. %
Nutritional Factors 41 82.0 9 18.0 0 0
Genetic Factors 34 68.0 15 30.0 1 2.0
Medical Factors 39 78.0 0 0 11 22.0
Physical Factors 50 100.0 0 0 0 0
Leisure Activity 35 70.0 14 28.0 2 4.0
Psychological Factors
49 98.0 1 2.0 0 0
[image:86.612.106.525.162.417.2]Overall 47 94.0 3 6.0 0 0
Table 3 shows the level of factors contributing to obesity among school children in the controls.
Regarding nutritional factors, majority 41(82%) had low level of contribution to obesity and only 9(18%) had moderate level of contribution to obesity among school children.